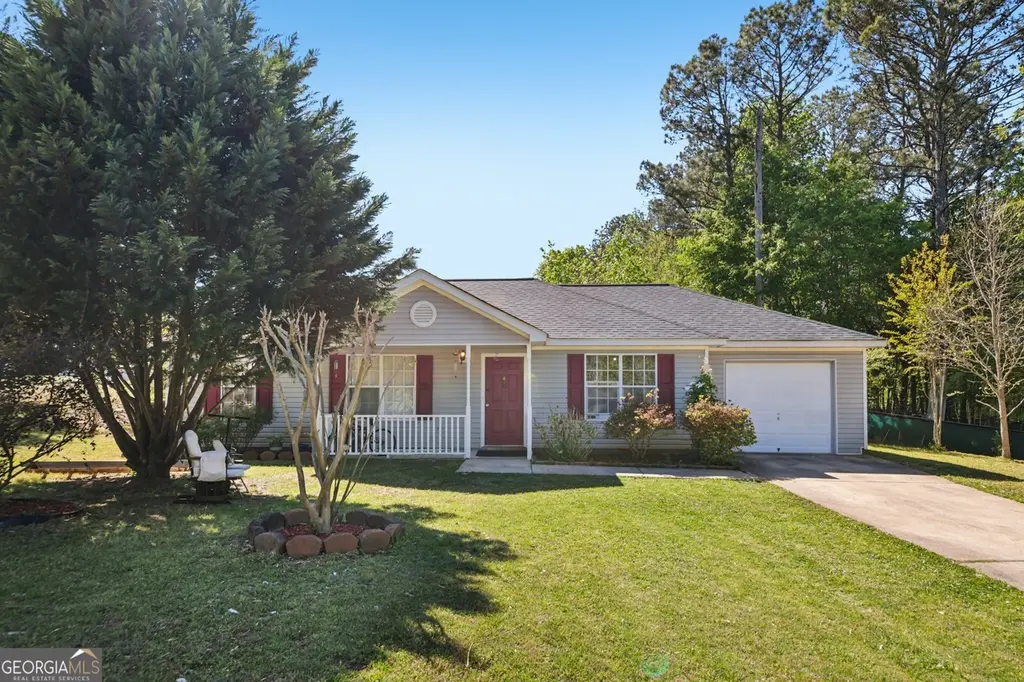
2 Ruby Ct · Grantville, GA
Flood risk 1/10 · Minimal
- FEMA flood zone
- X (unshaded)
- Chance of flooding over 30 yrs
- 0.0%
- Est. flood insurance / yr
- $507 – $1,088
Fire risk 4/10 · Minor
- Est. fire insurance / yr
- $963 – $1,789
Heat risk 6/10 · Moderate
- Hot days now (above 105°F)
- 7 days/yr
- Hot days in 30 yrs
- 20 days/yr
Wind risk 6/10 · Moderate
- Chance of severe wind over 30 yrs
- 42.0%
Air-quality risk 3/10 · Minor
- Unhealthy air days now
- 3 days/yr
- Unhealthy air days in 30 yrs
- 4 days/yr
Risk factors via First Street. Map © Google.
Why this score? — see what drove the D- grade
The composite is a weighted blend of 9 inputs, each scored 0–100. Each bar is that input's sub-score; the figure is the points it added to the 100-point composite (weight × sub-score).
- Cash flow +11.1/30.0
- ARV discount +10.3/15.0
- Schools +3.6/10.0
- DSCR +3.2/10.0
- Livability +3.2/5.0
- 1% rule +2.8/10.0
- Rent growth +2.5/5.0
- Condition / age +2.5/5.0
- Appreciation +0.0/10.0
$216,000
🖨 Deal sheet (PDF) 📄 Offer letter ✓ Due diligence
Listing remarks MLS
Come visit this charming corner lot ranch in a great neighborhood with NO HOA perfect for gardeners, hobbyists, or those looking to bring their own style to a property. Featuring a functional layout, the split floor plan is great for anyone and everyone to enjoy. If your needing convenience to the interstate and the opportunity for a quiet quaint home, come check out 2 Ruby Court!
Key facts
- Garage
- Built 2002
- Listed 28 days
Neighborhood map
What this means for you Summary
Snapshot
- This is a 3-bed/2.0-bath single-family listed at $216k.
Deal economics
- At list price, monthly cash flow is $-87 ($-1k/yr) — negative.
- To cash-flow at today's rent, offer at most $201k (7.1% below list).
- To meet the 1% rule (rent ≥ 1% of price), the offer needs to be $168k (22.3% below list).
- Recommended offer: $168k (22.3% below list) — sets the bar for 1% rule.
- Cap rate 5.8% vs local median 3.3% in Grantville — top-decile yield for the area; either an underpriced asset or a hidden risk that comps aren't pricing in. Stress-test before assuming the spread holds.
Location & tenants
- Location reads 64/100 on livability (#242 in GA) — a middle-class / working-renter tenant base. Strengths: crime A+, cost of living A+, housing A+; Watch: amenities F, commute F, health & safety F.
- Coweta County (rural): math 37% / reading 43% proficiency, ranked #36 of 174 in GA (top 21%) — families likely to look elsewhere, expect single-tenant / working-renter base with shorter leases.
- Zoned schools: Glanton Elementary (math 17% / reading 32%, grade F, #753 of 1,228 statewide, top 64%, 264 students, 66% FRL); Smokey Road Middle School (math 21% / reading 33%, grade F, #271 of 470 statewide, top 60%, 595 students, 60% FRL); Newnan High School (math 42% / reading 26%, grade F, #93 of 424 statewide, top 23%, 2,335 students, 41% FRL) — zoned schools average 56% FRL vs 37% district-wide (19 pts higher); higher-poverty schools than district average — tighter screening recommended.
- Market conditions: 69 active listings in the ZIP; 8 comparable units currently listed for rent nearby; rentals at typical pace (median 24d on market — plan ~3-4 weeks tenant-placement turnaround); 963 units permitted in Coweta County in 2024 (8 in 5+ unit buildings).
Forward outlook
- Local home prices are declining (-3.0%/yr); year-one equity from $1k of loan paydown is wiped out by about $6k of value loss. Plan a longer hold.
- Coweta County population projected at +31% by 2050 — long-run rental-demand tailwind backs the buy-and-hold thesis.
Negotiation context
- It's been on market 28 days — a 2% lower offer ($213k) is reasonable based on typical stale-listing flexibility.
Risks & watch-outs
- Climate carrying-cost: major wind risk, 42% chance of damaging wind over 30y; extreme-heat days projected 7→20/yr by 2055 (HVAC capex compounding) — expect insurance premiums to compound above CPI over the hold.
Questions for the listing agent
- What do current leases actually rent for vs. the listed asking? Can we see a recent rent roll and the last 12 months of T-12 income?
- Is there a deadline driving the sale (1031 exchange, divorce, estate, relocation)? That informs how much negotiation room exists.
- Schools are D-rated, which usually means shorter tenancies and higher turnover. Who's the typical renter profile here, and what's been the actual vacancy rate?
- The area grade is low — what's the realistic commute time and amenity access for the typical tenant pool here? Any planned neighborhood developments (good or bad) we should know about?
- What's the average days-on-market for RENTAL listings here right now (not sales)? A rising rental-DOM trend means longer vacancies and softer asking-rent achievability than the comps imply.
- What's the recent tenant-quality profile in this submarket — average credit score on applications, eviction rate, late-payment / NSF rate, and stable-employment percentage? A property-management company in the area should have these aggregated.
- How much new for-sale + rental construction is in the pipeline within 1–3 miles? Heavy new supply typically softens prices + rents 12–24 months out; constrained supply supports both.
Investment metrics
- 1% rule
- 0.78% ✗
- Cap rate
- 5.81%
- Cash-on-cash
- -1.72%
- DSCR
- 0.92
- GRM
- 10.7
CMA / ARV
- ARV (median comp)
- $230,417
- List price
- $216,000
- Delta
- -6.26%
- Verdict
- FAIR
- Comps
- 20 within 1.0 mi
Show comp detail 12 sales within ~0.75 mi
| Address | Dist | Beds/Ba | Sqft | Sold | Price | $/sf | Match |
|---|---|---|---|---|---|---|---|
| 2 Ray Way | 0.08mi | 3/2.0 | 1,077 (-3%) | 1mo | $242,000 | $225 | 90 |
| 299 Lagrange St | 0.21mi | 3/2.0 | 1,192 (+7%) | 6mo | $285,000 | $239 | 74 |
| 24 Chelsea Ln | 0.17mi | 3/2.0 | 1,242 (+12%) | 2mo | $243,000 | $196 | 71 |
| 180 Creekside Dr | 0.47mi | 3/2.0 | 1,161 (+4%) | 1mo | $250,000 | $215 | 70 |
| 120 Creekside Dr | 0.54mi | 3/2.0 | 1,118 (+0%) | 6mo | $249,900 | $224 | 69 |
| 21 Shepard St | 0.48mi | 2/2.0 (-1) | 1,092 (-2%) | 2mo | $209,900 | $192 | 67 |
| 34 Canterbury Dr | 0.45mi | 3/2.0 | 1,210 (+9%) | 3mo | $234,900 | $194 | 62 |
| 30 Canterbury Dr | 0.46mi | 3/2.0 | 1,224 (+10%) | 0mo | $244,900 | $200 | 62 |
| 37 Canterbury Dr | 0.43mi | 3/2.0 | 1,203 (+8%) | 6mo | $235,000 | $195 | 61 |
| 109 Calico Loop | 0.57mi | 3/2.0 | 1,166 (+5%) | 7mo | $278,500 | $239 | 60 |
| 14 Huntington Dr | 0.57mi | 3/2.0 | 1,231 (+10%) | 7mo | $220,000 | $179 | 50 |
| 69 Canterbury Dr | 0.64mi | 3/2.0 | 1,268 (+14%) | 5mo | $255,000 | $201 | 43 |
Match score weights: distance 35% · size 25% · config 20% · recency 20%. Top-matched comps best support the ARV.
Projected returns pro-forma
-3.0% appreciation · 3.0% rent growth · sell at horizon
- IRR
- -19.2%
- Equity multiple
- 0.33×
- Total profit
- $-40,542
- Equity at exit
- $32,206
- IRR
- -11.8%
- Equity multiple
- 0.30×
- Total profit
- $-42,506
- Equity at exit
- $18,676
Cash invested: $60,480 (down + closing). Projections, not guarantees.
Landlord ↔ Tenant lean methodology
- Overall (STATE)
- 90 Strongly Landlord-Friendly
- State Georgia
- 90 Strongly Landlord-Friendly · R+3
- County
- — inherits STATE
- City
- — inherits STATE
ZIP-level market 30220
- Home prices YoY
- -5.5%
- Active inventory
- 69
- Price-to-rent
- 10.7×
Monthly cashflow live
- Estimated rent
- $1,677 high interval (Pro) →
- Mortgage (P&I)
- −$1,133
- Tax from tax record
- −$189 /mo · $2,269/yr
- Insurance
- −$90
- HOA
- −$0
- Vacancy / Maint / Mgmt
- −$352
- Net cashflow
- $-87
Break-even live
Sensitivity live
| Price | -10% $36 | -5% $-25 | +0% $-87 | +5% $-148 | +10% $-209 |
|---|---|---|---|---|---|
| Rent | -10% $-219 | -5% $-153 | +0% $-87 | +5% $-20 | +10% $46 |
| Rate | -1.0pp $22 | -0.5pp $-32 | base $-87 | +0.5pp $-143 | +1.0pp $-200 |
UW: 25.0% down · 7.5% · 30yr · 1.5% tax · 5.0% vac · 8.0% maint · 8.0% mgmt
Financing live
Cash to close
- Down payment
- $54,000
- Closing costs
- $6,480
- Reserves months
- —
- Total cash needed
- —
Loan-product check · same deal, 3 products live
Conventional
25% down · 7.5% · 30yr
- Down + closing
- —
- Monthly P&I
- —
- Monthly cashflow
- —
- DSCR
- —
- Eligible?
- —
Personal DTI + credit; lowest rate.
DSCR
20% down · 8.5% · 30yr
- Down + closing
- —
- Monthly P&I
- —
- Monthly cashflow
- —
- DSCR
- —
- Eligible?
- —
No personal income docs; deal must DSCR.
Hard money
10% down · 12.0% · 12mo
- Down + closing
- —
- Monthly P&I
- —
- Monthly cashflow
- —
- DSCR
- —
- Eligible?
- —
Short-term bridge; refi at stabilization.
Rent comps 8 comps
| Address | Beds | Baths | Sqft | Rent | $/sqft | DOM | Units | Dist |
|---|---|---|---|---|---|---|---|---|
| 19 Connie Trl Grantville, GA | 3.0 | 2.0 | 1016 | $1,675 | $1.65 | 18d | 1 | 0.01mi |
| 26 Connie Trl Grantville, GA | 3.0 | 2.0 | 1100 | $1,500 | $1.36 | 17d | 1 | 0.05mi |
| 9 Evan Ct Grantville, GA | 3.0 | 2.0 | 1088 | $1,575 | $1.45 | 26d | 1 | 0.26mi |
| 116 Calico Loop Grantville, GA | 3.0 | 2.5 | 1498 | $1,776 | $1.19 | 23d | 1 | 0.32mi |
| 22 Edmond Leigh Cir Grantville, GA | 3.0 | 1.0 | 1088 | $1,199 | $1.10 | 26d | 1 | 0.71mi |
| 180 W Grantville Rd Grantville, GA | 3.0 | 2.0 | 1280 | $1,475 | $1.15 | 14d | 1 | 0.71mi |
| 82 Maple St Grantville, GA | 2.0 | 1.5 | 1144 | $1,075 | $0.94 | 26d | 1 | 0.90mi |
| 125 Arnold St Grantville, GA | 2.0 | 1.0 | 1018 | $950 | $0.93 | 21d | 1 | 0.91mi |
Listing history 3 events
-
2026-05-07status Under Contract 383-char remark
Show marketing remark (383 chars)
Come visit this charming corner lot ranch in a great neighborhood with NO HOA perfect for gardeners, hobbyists, or those looking to bring their own style to a property. Featuring a functional layout, the split floor plan is great for anyone and everyone to enjoy. If your needing convenience to the interstate and the opportunity for a quiet quaint home, come check out 2 Ruby Court!
-
2026-05-02price $216,000 383-char remark
Show marketing remark (383 chars)
Come visit this charming corner lot ranch in a great neighborhood with NO HOA perfect for gardeners, hobbyists, or those looking to bring their own style to a property. Featuring a functional layout, the split floor plan is great for anyone and everyone to enjoy. If your needing convenience to the interstate and the opportunity for a quiet quaint home, come check out 2 Ruby Court!
-
2026-03-21$225,000 New 383-char remark
Show marketing remark (383 chars)
Come visit this charming corner lot ranch in a great neighborhood with NO HOA perfect for gardeners, hobbyists, or those looking to bring their own style to a property. Featuring a functional layout, the split floor plan is great for anyone and everyone to enjoy. If your needing convenience to the interstate and the opportunity for a quiet quaint home, come check out 2 Ruby Court!
ⓘ Source: listings_history table (triggers on properties + properties_extension) + one-shot
backfill from property_details.listing_events for pre-trigger history.
Tax reassessment forecast GA · Resets to sale price
- Current annual tax
- $2,269 · $189/mo
- Projected year-2 tax
- $2,269 · $189/mo
- Expected delta
- $0/yr ($0/mo · 0.0%)
ⓘ Screening estimate from a state-policy table — verify with the county assessor before closing.
Climate risk First Street
- Flood 1/10 Low FEMA zone X (unshaded) · 0% chance over 30 yrs
- Wildfire 4/10 Moderate
- Heat 6/10 Major 7 d/yr ≥105°F today · 20 d/yr by 30 yrs out
- Wind 6/10 Major 42% chance of damaging wind over 30 yrs
- Air quality 3/10 Moderate 3 unhealthy d/yr today · 4 by 30 yrs out
Nearby sold comps map
Loading sold comps map…
Walkable amenities ~0.75 mi
Loading nearby amenities…
Taxation est. · year 1
- Rental income
- $20,129
- − Mortgage interest
- −$12,099
- − Property taxes
- −$2,269
- − Insurance
- −$1,080
- − Repairs & maintenance
- −$1,610
- − Management
- −$1,610
- − Depreciation
- −$6,284
- Taxable loss
- −$4,823
- Est. tax savings @ 24.0%
- +$1,158
- After-tax cash flow
- $118/yr
For passive investors: Depreciation is non-cash, so a rental often shows a tax loss while cash-flowing — sheltering income. Rental losses are passive: they offset passive income freely, and up to $25,000/yr can offset ordinary (W-2) income if you actively participate and your MAGI is under $100k (phasing out to $0 by $150k); unused losses carry forward. On sale, claimed depreciation is recaptured at up to 25%, and gains may owe capital-gains tax (a 1031 exchange can defer both). Figures are a year-1 estimate at your 24.0% rate — not tax advice; consult a CPA.
Schools (NCES district)
- District
- Coweta County
- NCES district ID
- 1301500
- Math proficiency
- 37% ▼ -16.00%
- Reading proficiency
- 43% ▼ -11.00%
- Median HH income
- $62,978
- Composite
- 35.72/100
- National rank
- #4860
- State rank
- #36 of 174 in GA
Livability — Grantville
- Score
- 64/100
- State rank
- #242
- US rank
- #13777
Category grades
Schools grade is shown separately in the Schools card above.
Census & demographics
- Census place
- Grantville, GA
- County
- Coweta County · 148,589 people
- City population
- 5,366
- Metro
- Atlanta-Sandy Springs-Alpharetta, GA
- Population (ZIP)
- 5,366
- Household income
- $72,091
- Rent vs Own
- Severe rent burden
- 59.0
Population outlook (Coweta County) Hauer SSP2
- Today (2025)
- 162,063 people
- By 2030
- 173,373 · +7.0%
- By 2040
- 194,658 · +20.1%
- By 2050
- 212,246 · +31.0%
- By 2075
- 246,544 · +52.1%
- By 2100
- 257,059 · +58.6%
Race, ethnicity, and origin ACS 2023
- Neighborhood character
- Predominantly White (71%)
- Race & ethnicity
- White 71% Black 23% Two or more races 4% Asian 2%
- Common ancestry
- Lithuanian 2% Slovak 1% Portuguese 1%
- Foreign-born
- 2%
- Languages at home
- 97% English-only · Spanish 2% Tagalog/Filipino 1%
Political lean MEDSL · Coweta
- 2024 margin
- Solid R (+33.9) · D 32.7% · R 66.6%
- 2008→2024 swing
- +7.3pp toward D · 2008: -41.2pp · 2024: -33.9pp
- All cycles
- 2024: R+33.9 2020: R+35.5 2016: R+42.3 2012: R+44.1 2008: R+41.2
Not yet ingested
- Civics
- —
Market trends
- HPI YoY
- ▼ -17.44%
- Current HPI
- 298.8739
- Rent YoY
- —
- Metro
- Atlanta-Sandy Springs-Alpharetta, GA
- State GDP YoY
- ▲ 2.66%
- F500 in state
- 28
Industry mix (Fortune 500 HQ in GA)
| Industry | F500 HQs | Revenue |
|---|---|---|
| Paper / Packaging | 2 | $29B |
|
||
| Retail | 1 | $160B |
|
||
| Transportation / Logistics | 1 | $91B |
|
||
| Airlines | 1 | $62B |
|
||
| Consumer Goods | 1 | $47B |
|
||
| Utilities | 1 | $25B |
|
||
Price history
-4.0% since first listed3 events — show timeline
- 2026-05-07 Pending — GAMLS
- 2026-05-02 Price Changed $216,000 GAMLS
- 2026-03-21 Listed $225,000 GAMLS
Property tax history
+3.4%/yrLatest (2025): $2,269 · +2.0% YoY. Source: county tax records.
Cash-flow waterfall
monthlySold comps — $/sqft
last 12 mo · ≤1 miLoading sold comps…