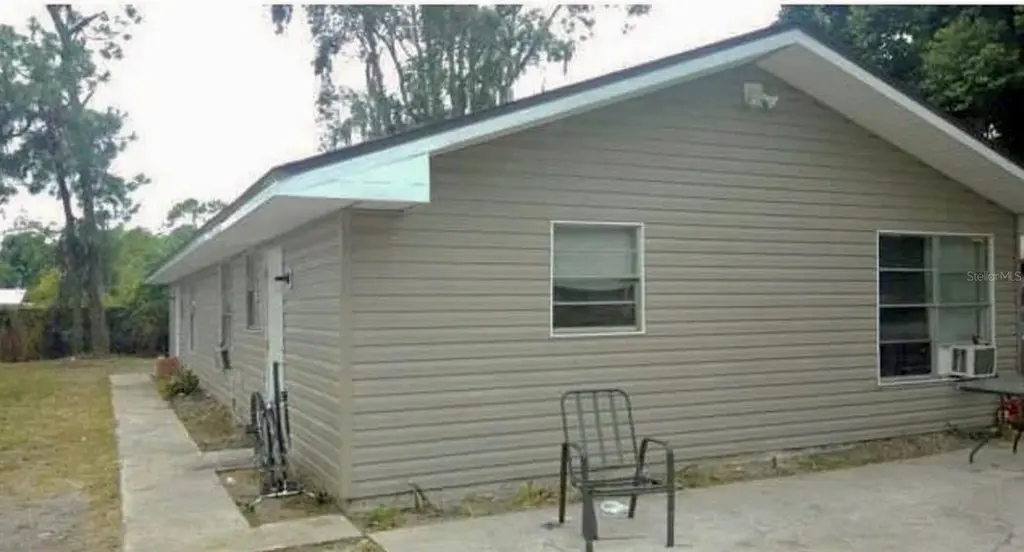
 Duplex
5638 5th Ave · Pine Manor, FL
Flood risk 7/10 · Major
- FEMA flood zone
- X (shaded)
- Chance of flooding over 30 yrs
- 0.76%
- Est. flood insurance / yr
- $507 – $1,088
Fire risk 1/10 · Minimal
- Est. fire insurance / yr
- $947 – $1,759
Heat risk 10/10 · Severe
- Hot days now (above 107°F)
- 7 days/yr
- Hot days in 30 yrs
- 30 days/yr
Wind risk 10/10 · Severe
- Chance of severe wind over 30 yrs
- 99.0%
Air-quality risk 2/10 · Minimal
- Unhealthy air days now
- 1 days/yr
- Unhealthy air days in 30 yrs
- 1 days/yr
Risk factors via First Street. Map © Google.
Why this score? — see what drove the C+ grade
The composite is a weighted blend of 9 inputs, each scored 0–100. Each bar is that input's sub-score; the figure is the points it added to the 100-point composite (weight × sub-score).
- Cash flow +25.1/30.0
- ARV discount +14.0/15.0
- DSCR +8.2/10.0
- 1% rule +6.4/10.0
- Schools +4.1/10.0
- Livability +3.2/5.0
- Condition / age +2.5/5.0
- Rent growth +0.1/5.0
- Appreciation +0.0/10.0
$219,000
🖨 Deal sheet 📄 Offer letter ✓ Due diligence
Multi-family units
County records classify this as Multi-Family (2-4 Unit). Listing-text estimate: 2 units. confirmed
Listing remarks MLS
Great cash flow property! Buy now and make instant return with a 14% cap rate. This duplex has been completely renovated inside and out. Brand new A/C units, electrical panels, siding, flooring, cabinets, countertops, toilets, tile around tubs, light fixtures, plumbing fixtures, and more! Because of it's new condition, it will make for very few maintenance requests. This won't last long!
Key facts
- Central ac
- County water
- County sewer
Tags
Neighborhood map
What this means for you Summary
Snapshot
- This is a 2 × 2-bed/1.0-bath units multifamily listed at $219k.
Deal economics
- At list price, monthly cash flow is $417 ($5k/yr) — positive. Per door: $208/mo.
- The deal already cash-flows at list — no discount required.
- Meets the 1% rule at list price ($3k rent vs $219k).
- Recommended offer: $216k (1.5% below list) — sets the bar for market timing.
Location & tenants
- Location reads 64/100 on livability (#695 in FL) — a middle-class / working-renter tenant base. Strengths: cost of living A+, health & safety A+, housing A-; Watch: amenities F, commute F, employment F.
- Lee (suburban): math 47% / reading 50% proficiency, ranked #42 of 73 in FL (top 58%) — families likely to look elsewhere, expect single-tenant / working-renter base with shorter leases.
- Zoned schools: Villas Elementary School (math 45% / reading 47%, grade D-, #1,234 of 2,144 statewide, top 58%, 855 students, 61% FRL); Cape Coral High School (math 50% / reading 58%, grade C-, #144 of 667 statewide, top 22%, 1,887 students, 41% FRL).
- Market conditions: Rents falling (-9.7%/yr); 346 active listings in the ZIP; 21 comparable units currently listed for rent nearby; rentals at typical pace (median 24d on market — plan ~3-4 weeks tenant-placement turnaround); 15,411 units permitted in Lee County in 2024 (4,686 in 5+ unit buildings).
- At $2,502/mo this rent would consume 57% of the median local household income ($52k/yr) (locally 1960% of renters already pay >50% of income on rent) — very limited rent-growth headroom before tenants either downsize or default.
Forward outlook
- Local home prices are declining (-3.0%/yr); year-one equity from $2k of loan paydown is wiped out by about $7k of value loss. Plan a longer hold.
- Lee County population projected at +44% by 2050 — long-run rental-demand tailwind backs the buy-and-hold thesis.
Negotiation context
- It's been on market 18 days — a 2% lower offer ($216k) is reasonable based on typical stale-listing flexibility.
- 3 sale attempts since 9y ago with the ask held roughly flat each time — persistent listings suggest the price (not the market) is what's stuck; bring a comps-based counter.
- Current owner paid $110k; list at $219k implies a 99% gain — meaningful room to come down on a strong offer.
Risks & watch-outs
- Watch-outs: flood insurance adds $66/mo.
- Climate carrying-cost: major flood risk; severe wind risk, 99% chance of damaging wind over 30y; extreme-heat days projected 7→30/yr by 2055 (HVAC capex compounding) — expect insurance premiums to compound above CPI over the hold.
Questions for the listing agent
- Can we see the unit-by-unit rent roll, current vacancy, and any below-market leases? What's the average tenancy length?
- What capital expenditures (roof, boiler, parking lot, exteriors) have been made in the last 5 years, and what's planned in the next 2?
- What's the actual annual flood-insurance premium (NFIP or private), and is the property in a SFHA with mandatory coverage?
- Is there a deadline driving the sale (1031 exchange, divorce, estate, relocation)? That informs how much negotiation room exists.
- Schools are F-rated, which usually means shorter tenancies and higher turnover. Who's the typical renter profile here, and what's been the actual vacancy rate?
- What's the average days-on-market for RENTAL listings here right now (not sales)? A rising rental-DOM trend means longer vacancies and softer asking-rent achievability than the comps imply.
- What's the recent tenant-quality profile in this submarket — average credit score on applications, eviction rate, late-payment / NSF rate, and stable-employment percentage? A property-management company in the area should have these aggregated.
- How much new apartment / multifamily construction is in the pipeline within 1–3 miles? Heavy new supply (>2% of stock underway) typically softens rents 12–24 months out; light construction supports rent growth.
Investment metrics
- 1% rule
- 1.14% ✓
- Cap rate
- 8.94%
- Cash-on-cash
- 9.45%
- DSCR
- 1.42
- GRM
- 7.3
CMA / ARV
- ARV (on-the-fly)
- $255,840
- Comps found
- 5
Show comp detail 5 sales within ~0.75 mi
| Address | Dist | Beds/Ba | Sqft | Sold | Price | $/sf | Match |
|---|---|---|---|---|---|---|---|
| 5637-5639 Fifth Ave | 0.03mi | 4/2.0 | 1,560 (0%) | 5mo | $180,000 | $115 | 94 |
| 5625/5627 Fourth Ave | 0.09mi | 4/2.5 | 1,528 (-2%) | 1mo | $250,000 | $164 | 89 |
| 5532/5534 Seventh Ave | 0.18mi | 4/2.0 | 1,440 (-8%) | 2mo | $275,000 | $191 | 77 |
| 1652 Cypress Dr | 0.12mi | 4/2.0 | 1,792 (+15%) | 5mo | $256,000 | $143 | 66 |
| 5508 10th Ave | 0.35mi | 4/2.0 | 1,440 (-8%) | 15mo | $282,646 | $196 | 59 |
Match score weights: distance 35% · size 25% · config 20% · recency 20%. Top-matched comps best support the ARV.
Projected returns pro-forma
-3.0% appreciation · 0.0% rent growth · sell at horizon
- IRR
- -7.4%
- Equity multiple
- 0.74×
- Total profit
- $-16,219
- Equity at exit
- $32,654
- IRR
- -2.2%
- Equity multiple
- 0.87×
- Total profit
- $-8,024
- Equity at exit
- $18,935
Cash invested: $61,320 (down + closing). Projections, not guarantees.
Landlord ↔ Tenant lean methodology
- Overall (STATE)
- 87 Strongly Landlord-Friendly
- State Florida
- 87 Strongly Landlord-Friendly · R+3
- County
- — inherits STATE
- City
- — inherits STATE
ZIP-level market 33907
- Home prices YoY
- -26.8%
- Rents YoY
- -9.7%
- Active inventory
- 346
- Price-to-rent
- 14.6×
Monthly cashflow live
- Estimated rent
- $2,502 high interval (Pro) →
- Mortgage (P&I)
- −$1,148
- Tax from tax record
- −$254 /mo · $3,046/yr
- Insurance
- −$91
- Flood insurance flood zone
- −$66 /mo · $798/yr
- HOA
- −$0
- Vacancy / Maint / Mgmt
- −$525
- Net cashflow
- $417
Break-even live
2-unit breakdown (identical units grouped — click to expand)
| Units | Beds | Baths | Est. rent |
|---|---|---|---|
| 2× units | 2 | 1 | $2,502 |
| #1 | 2 | 1 | $1,251 |
| #2 | 2 | 1 | $1,251 |
| Total (2 units) | $2,502 | ||
UW: 25.0% down · 7.5% · 30yr · 1.5% tax · 5.0% vac · 8.0% maint · 8.0% mgmt
Financing live
Cash to close
- Down payment
- $54,750
- Closing costs
- $6,570
- Reserves months
- —
- Total cash needed
- —
Loan-product check · same deal, 3 products live
Conventional
25% down · 7.5% · 30yr
- Down + closing
- —
- Monthly P&I
- —
- Monthly cashflow
- —
- DSCR
- —
- Eligible?
- —
Personal DTI + credit; lowest rate.
DSCR
20% down · 8.5% · 30yr
- Down + closing
- —
- Monthly P&I
- —
- Monthly cashflow
- —
- DSCR
- —
- Eligible?
- —
No personal income docs; deal must DSCR.
Hard money
10% down · 12.0% · 12mo
- Down + closing
- —
- Monthly P&I
- —
- Monthly cashflow
- —
- DSCR
- —
- Eligible?
- —
Short-term bridge; refi at stabilization.
Rent comps 21 comps
| Address | Beds | Baths | Sqft | Rent | $/sqft | DOM | Units | Dist |
|---|---|---|---|---|---|---|---|---|
| 1608 Park Meadows Dr #1 Fort Myers, FL | 3.0 | 2.5 | 1722 | $1,950 | $1.13 | 23d | 1 | 0.30mi |
| 5457 9th Ave Fort Myers, FL | 3.0 | 2.0 | 1158 | $2,050 | $1.77 | 23d | 1 | 0.36mi |
| 5001 Palm Pointe Ct Fort Myers, FL | 1.0–3.0 | 1.0–2.0 | 990 | $2,735 | $2.76 | 2d | 35 | 0.43mi |
| 12750 Equestrian Cir #3005 Fort Myers, FL | 3.0 | 2.0 | 1154 | $1,650 | $1.43 | 23d | 1 | 0.58mi |
| 5335 Hawks Landing Dr Unit 202 Fort Myers, FL | 3.0 | 2.0 | 1154 | $1,555 | $1.35 | 23d | 1 | 0.59mi |
| 2181 Coronet St Fort Myers, FL | 3.0 | 1.0 | 1810 | $1,200 | $0.66 | 3d | 1 | 0.75mi |
| 5883 Sand Oak Dr Fort Myers, FL | 3.0 | 2.0 | 1582 | $2,300 | $1.45 | 3d | 1 | 0.88mi |
| 5625 Trailwinds Dr #412 Fort Myers, FL | 3.0 | 2.0 | 1331 | $2,150 | $1.62 | 23d | 1 | 0.96mi |
| 1601 Red Cedar Dr Fort Myers, FL | 1.0–3.0 | 1.0–2.0 | 1000 | $1,594 | $1.59 | 1d | 36 | 1.05mi |
| 5710 Trailwinds Dr #525 Fort Myers, FL | 3.0 | 3.0 | 1171 | $1,700 | $1.45 | 2d | 1 | 1.06mi |
| 5710 Trailwinds Dr #525 Fort Myers, FL | 3.0 | 2.0 | 1435 | $1,950 | $1.36 | 19d | 1 | 1.06mi |
| 1411 Whiskey Creek Dr Fort Myers, FL | 3.0 | 2.0 | 2087 | $3,390 | $1.62 | 23d | 1 | 1.08mi |
| 1463 Tanglewood Pkwy Fort Myers, FL | 3.0 | 2.0 | 1754 | $3,100 | $1.77 | 23d | 1 | 1.16mi |
| 8251 Pathfinder Loop #621 Fort Myers, FL | 3.0 | 2.0 | 1306 | $4,000 | $3.06 | 23d | 1 | 1.17mi |
| 1448 Covington Cir W Fort Myers, FL | 3.0 | 2.0 | 1350 | $3,500 | $2.59 | 23d | 1 | 1.21mi |
| 1208 Westfield Dr Fort Myers, FL | 3.0 | 2.0 | 1600 | $2,900 | $1.81 | 23d | 1 | 1.36mi |
| 6346 Saint Andrews Cir S Fort Myers, FL | 3.0 | 2.0 | 1174 | $2,400 | $2.04 | 3d | 1 | 1.40mi |
| 958 Indiana Ave Fort Myers, FL | 3.0 | 2.0 | 1422 | $2,500 | $1.76 | 23d | 1 | 1.45mi |
| 6313 Saint Andrews Cir S Fort Myers, FL | 3.0 | 2.0 | 1418 | $2,350 | $1.66 | 3d | 1 | 1.45mi |
| 4797 Albacore Ln Fort Myers, FL | 3.0 | 2.5 | 1391 | $1,900 | $1.37 | 23d | 1 | 1.46mi |
| 2425 Woodland Cir Fort Myers, FL | 3.0 | 2.0 | 1379 | $2,220 | $1.61 | 23d | 1 | 1.50mi |
Listing history 2 events
-
2026-06-13remarks 540-char remark
-
2026-06-13$219,000 Pending 18 DOM
ⓘ Source: listings_history table (triggers on properties + properties_extension) + one-shot
backfill from property_details.listing_events for pre-trigger history.
Tax reassessment forecast FL · Resets to sale price
- Current annual tax
- $3,046 · $254/mo
- Projected year-2 tax
- $3,046 · $254/mo
- Expected delta
- $0/yr ($0/mo · 0.0%)
ⓘ Screening estimate from a state-policy table — verify with the county assessor before closing.
Climate risk First Street
- Flood 7/10 Severe FEMA zone X (shaded) · 76% chance over 30 yrs
- Wildfire 1/10 Low
- Heat 10/10 Extreme 7 d/yr ≥107°F today · 30 d/yr by 30 yrs out
- Wind 10/10 Extreme 99% chance of damaging wind over 30 yrs
- Air quality 2/10 Low 1 unhealthy d/yr today · 1 by 30 yrs out
Nearby sold comps map
Loading sold comps map…
Walkable amenities ~0.75 mi
Loading nearby amenities…
Taxation est. · year 1
- Rental income
- $30,024
- − Mortgage interest
- −$12,267
- − Property taxes
- −$3,046
- − Insurance
- −$1,892
- − Repairs & maintenance
- −$2,402
- − Management
- −$2,402
- − Depreciation
- −$6,371
- Taxable income
- $1,644
- Est. tax owed @ 24.0%
- −$394
- After-tax cash flow
- $4,605/yr
For passive investors: Depreciation is non-cash, so a rental often shows a tax loss while cash-flowing — sheltering income. Rental losses are passive: they offset passive income freely, and up to $25,000/yr can offset ordinary (W-2) income if you actively participate and your MAGI is under $100k (phasing out to $0 by $150k); unused losses carry forward. On sale, claimed depreciation is recaptured at up to 25%, and gains may owe capital-gains tax (a 1031 exchange can defer both). Figures are a year-1 estimate at your 24.0% rate — not tax advice; consult a CPA.
Schools (NCES district)
- District
- Lee
- NCES district ID
- 1201080
- Math proficiency
- 47% ▼ -11.00%
- Reading proficiency
- 50% ▼ -4.00%
- Median HH income
- $49,518
- Composite
- 41.49/100
- National rank
- #3458
- State rank
- #42 of 73 in FL
Livability — Pine Manor
- Score
- 64/100
- State rank
- #695
- US rank
- #14531
Category grades
Schools grade is shown separately in the Schools card above.
Census & demographics
- Census place
- Pine Manor, FL
- County
- Lee County · 788,662 people
- Metro
- Cape Coral-Fort Myers, FL
- Population (ZIP)
- 25,033
- Household income
- $52,478
- Rent vs Own
- Severe rent burden
- 1960.0
Population outlook (Lee County) Hauer SSP2
- Today (2025)
- 871,946 people
- By 2030
- 955,468 · +9.6%
- By 2040
- 1,113,587 · +27.7%
- By 2050
- 1,256,891 · +44.1%
- By 2075
- 1,560,270 · +78.9%
- By 2100
- 1,726,848 · +98.0%
Race, ethnicity, and origin ACS 2023
- Neighborhood character
- Diverse neighborhood (Simpson 0.63)
- Race & ethnicity
- White 52% Hispanic / Latino 30% Two or more races 21% Black 10% Asian 2%
- Hispanic origin (detail)
- Mexican 10% Puerto Rican 6% Cuban 2% Dominican 1%
- Common ancestry
- Hispanic 2% Romanian 2% Lithuanian 2%
- Foreign-born
- 26% · Canada, Jamaica, Dominican Republic
- Languages at home
- 65% English-only · Spanish 25% Other Indo-European 4% French/Haitian/Cajun 2%
Political lean MEDSL · Lee
- 2024 margin
- Strong R (+28.4) · D 35.5% · R 63.9%
- 2008→2024 swing
- -18.0pp toward R · 2008: -10.4pp · 2024: -28.4pp
- All cycles
- 2024: R+28.4 2020: R+19.2 2016: R+20.4 2012: R+16.6 2008: R+10.4
Not yet ingested
- Civics
- —
Market trends
- HPI YoY
- ▼ -93.02%
- Current HPI
- 254.2264
- Rent YoY
- ▼ -9.68%
- Metro
- Cape Coral-Fort Myers, FL
- State GDP YoY
- ▲ 3.28%
- F500 in state
- 36
Industry mix (Fortune 500 HQ in FL)
| Industry | F500 HQs | Revenue |
|---|---|---|
| Industrial Technology | 2 | $29B |
|
||
| Insurance | 2 | $17B |
|
||
| Retail | 1 | $60B |
|
||
| Technology Distribution | 1 | $58B |
|
||
| Homebuilding | 1 | $35B |
|
||
| Technology Manufacturing | 1 | $35B |
|
||
Price history
+655.2% since first listed18 events — show timeline
- 2026-04-28 Pending — Stellar MLS as Distributed by MLS Grid
- 2026-04-20 Price Changed $219,000 Stellar MLS as Distributed by MLS Grid
- 2026-04-10 Price Changed $239,000 Stellar MLS as Distributed by MLS Grid
- 2026-04-10 Price Changed $240,000 Stellar MLS as Distributed by MLS Grid
- 2026-04-10 Listed $225,000 Stellar MLS as Distributed by MLS Grid
- 2017-06-26 Pending — FORTMLS
- 2017-06-26 Sold (MLS) $110,000 FORTMLS
- 2017-06-22 Sold (Public Records) $110,000 Public Records
- 2017-04-21 Price Changed $113,900 FORTMLS
- 2017-04-11 Relisted — FORTMLS
- 2017-04-05 Pending — FORTMLS
- 2017-04-04 Price Changed $114,900 FORTMLS
- 2017-03-02 Listed $119,900 FORTMLS
- 2016-08-03 Sold (Public Records) $40,000 Public Records
- 2006-10-10 Sold (Public Records) $400,000 Public Records
- 2001-05-01 Sold (Public Records) $100,000 Public Records
- 1990-04-26 Sold (Public Records) $27,500 Public Records
- 1990-01-01 Sold (Public Records) $29,000 Public Records
Property tax history
+12.0%/yrLatest (2025): $3,046 · +6.8% YoY. Source: county tax records.
Cash-flow waterfall
monthlySold comps — $/sqft
last 12 mo · ≤1 miLoading sold comps…