3551 12th Ave SE · St. Cloud, MN
Flood risk 1/10 · Minimal
- FEMA flood zone
- X (unshaded)
- Chance of flooding over 30 yrs
- 0.0%
- Est. flood insurance / yr
- $507 – $1,088
Fire risk 2/10 · Minimal
- Est. fire insurance / yr
- $888 – $1,650
Heat risk 2/10 · Minimal
- Hot days now (above 97°F)
- 7 days/yr
- Hot days in 30 yrs
- 13 days/yr
Wind risk 2/10 · Minimal
- Chance of severe wind over 30 yrs
- —
Air-quality risk 3/10 · Minor
- Unhealthy air days now
- 3 days/yr
- Unhealthy air days in 30 yrs
- 3 days/yr
Risk factors via First Street. Map © Google.
Why this score? — see what drove the F grade
The composite is a weighted blend of 9 inputs, each scored 0–100. Each bar is that input's sub-score; the figure is the points it added to the 100-point composite (weight × sub-score).
- Cash flow +10.6/30.0
- ARV discount +7.5/15.0
- Rent growth +3.4/5.0
- DSCR +3.1/10.0
- Schools +2.8/10.0
- Livability +2.5/5.0
- Condition / age +2.5/5.0
- 1% rule +2.3/10.0
- Appreciation +0.0/10.0
$280,000
🖨 Deal sheet 📄 Offer letter ✓ Due diligence
Listing remarks
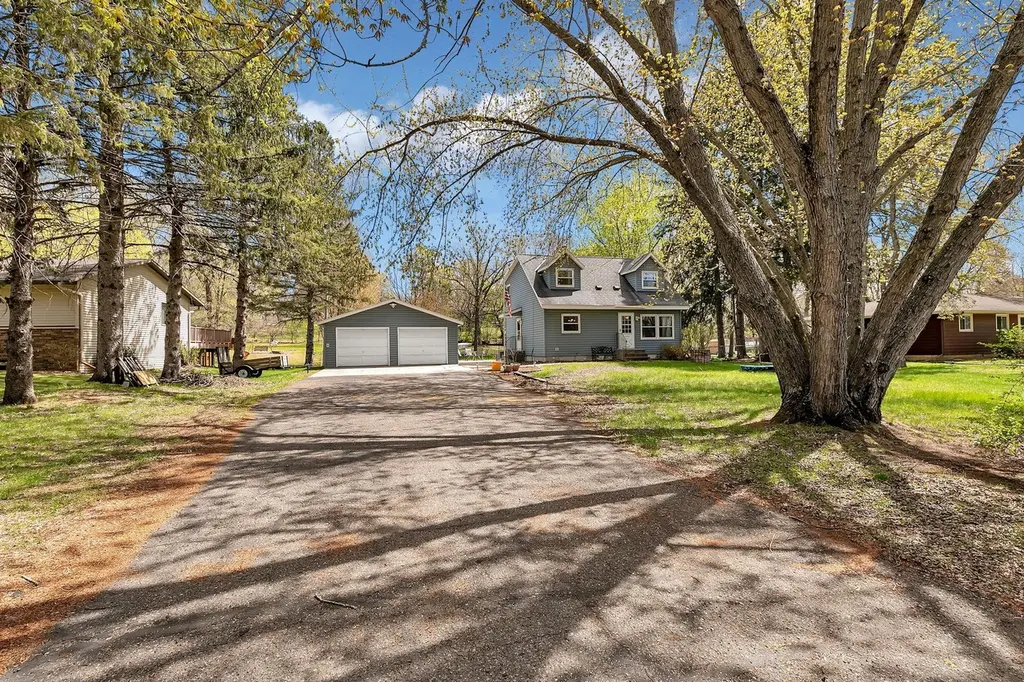
Charming 4-bedroom, 2-bath story-and-a-half home situated on a peaceful 0.65-acre lot. The main level offers a spacious kitchen, dining area, living room, full bath, one bedroom, and convenient main-floor laundry. The upper level features two additional bedrooms and a ¾ bath, while the lower level includes a bedroom, family room, and mechanicals. A 24’ x 32’ detached two-stall garage provides ample space for vehicles, storage, or hobbies. The home is serviced by natural gas and features durable steel siding. Recent updates include a furnace and central A/C (6 years ago) and a water heater (5 years ago). The septic system has been certified. Enjoy the expansive yard with m
Key facts
- 0.65 acre lot
- 2 garage spots
- Built 1986
Property features AI
Exterior
- Parking: Asphalt driveway; 2-car garage (approximately 23.5 x 31.5)
- Utilities: Well water; Septic system compliant; Natural gas
- Home design: Residential property; One and one-half story; Above-grade finished area 1,456 (living area split across levels); Below-grade finished area present
- Construction: Block foundation; Basement present (finished); Foundation area 728
- Exterior features: Patio; Lot approximately 0.65 acres; Lot dimensions: 106 x 277 x 105 x 262
Interior
- Kitchen: Range; Microwave; Refrigerator; Dishwasher
- Bedrooms: 4 bedrooms total; Main-floor bedroom; Two upper-level bedrooms; Lower-level bedroom
- Bathrooms: Main-floor full bathroom; Upper-level 3/4 bathroom
- Heating & cooling: Forced air heating; Central air conditioning
- Interior features: Finished basement with block construction; Water softener (owned)
- Laundry & utility: Main-level laundry; Washer; Dryer
Neighborhood map
What this means for you Summary
Snapshot
- This is a 4-bed/2.0-bath single-family listed at $280k.
Deal economics
- At list price, monthly cash flow is $-136 ($-2k/yr) — negative.
- To cash-flow at today's rent, offer at most $256k (8.6% below list).
- To meet the 1% rule (rent ≥ 1% of price), the offer needs to be $204k (27.2% below list).
- Recommended offer: $204k (27.2% below list) — sets the bar for 1% rule.
- Cap rate 5.7% vs local median 3.9% in St. Cloud — top-decile yield for the area; either an underpriced asset or a hidden risk that comps aren't pricing in. Stress-test before assuming the spread holds.
Location & tenants
- Location reads: area grade F — affects rentability + tenant quality, not the cash-flow math above.
- St. Cloud Public School District (urban): math 27% / reading 38% proficiency, ranked #264 of 301 in MN (top 88%) — families likely to look elsewhere, expect single-tenant / working-renter base with shorter leases.
- Market conditions: Rents rising (+3.8%/yr); 116 active listings in the ZIP; 334 units permitted in Sherburne County in 2024 (58 in 5+ unit buildings).
- This rent runs 42% of the median local income ($58k/yr) — at the standard rent-burdened threshold; future hikes will face affordability resistance.
Forward outlook
- Local home prices are declining (-3.0%/yr); year-one equity from $2k of loan paydown is wiped out by about $8k of value loss. Plan a longer hold.
Negotiation context
- It's been on market 19 days — a 2% lower offer ($276k) is reasonable based on typical stale-listing flexibility.
Questions for the listing agent
- What do current leases actually rent for vs. the listed asking? Can we see a recent rent roll and the last 12 months of T-12 income?
- Is there a deadline driving the sale (1031 exchange, divorce, estate, relocation)? That informs how much negotiation room exists.
- The area grade is low — what's the realistic commute time and amenity access for the typical tenant pool here? Any planned neighborhood developments (good or bad) we should know about?
- What's the average days-on-market for RENTAL listings here right now (not sales)? A rising rental-DOM trend means longer vacancies and softer asking-rent achievability than the comps imply.
- What's the recent tenant-quality profile in this submarket — average credit score on applications, eviction rate, late-payment / NSF rate, and stable-employment percentage? A property-management company in the area should have these aggregated.
- How much new for-sale + rental construction is in the pipeline within 1–3 miles? Heavy new supply typically softens prices + rents 12–24 months out; constrained supply supports both.
Investment metrics
- 1% rule
- 0.73% ✗
- Cap rate
- 5.71%
- Cash-on-cash
- -2.09%
- DSCR
- 0.91
- GRM
- 11.4
CMA / ARV
No comps found within radius.
Projected returns pro-forma
-3.0% appreciation · 3.79% rent growth · sell at horizon
- IRR
- -19.0%
- Equity multiple
- 0.33×
- Total profit
- $-52,503
- Equity at exit
- $41,749
- IRR
- -10.3%
- Equity multiple
- 0.36×
- Total profit
- $-50,427
- Equity at exit
- $24,209
Cash invested: $78,400 (down + closing). Projections, not guarantees.
Landlord ↔ Tenant lean methodology
- Overall (STATE)
- 46 Balanced
- State Minnesota
- 46 Balanced · D+2
- County
- — inherits STATE
- City
- — inherits STATE
ZIP-level market 56304
- Home prices YoY
- -21.4%
- Rents YoY
- 3.8%
- Active inventory
- 116
- Price-to-rent
- 11.4×
Monthly cashflow live
- Estimated rent
- $2,039 medium interval (Pro) →
- Mortgage (P&I)
- −$1,468
- Tax from tax record
- −$162 /mo · $1,944/yr
- Insurance
- −$117
- HOA
- −$0
- Vacancy / Maint / Mgmt
- −$428
- Net cashflow
- $-136
Break-even live
UW: 25.0% down · 7.5% · 30yr · 1.5% tax · 5.0% vac · 8.0% maint · 8.0% mgmt
Financing live
Cash to close
- Down payment
- $70,000
- Closing costs
- $8,400
- Reserves months
- —
- Total cash needed
- —
Loan-product check · same deal, 3 products live
Conventional
25% down · 7.5% · 30yr
- Down + closing
- —
- Monthly P&I
- —
- Monthly cashflow
- —
- DSCR
- —
- Eligible?
- —
Personal DTI + credit; lowest rate.
DSCR
20% down · 8.5% · 30yr
- Down + closing
- —
- Monthly P&I
- —
- Monthly cashflow
- —
- DSCR
- —
- Eligible?
- —
No personal income docs; deal must DSCR.
Hard money
10% down · 12.0% · 12mo
- Down + closing
- —
- Monthly P&I
- —
- Monthly cashflow
- —
- DSCR
- —
- Eligible?
- —
Short-term bridge; refi at stabilization.
Listing history 2 events
-
2026-05-11$280,000 Active 840-char remark
-
2026-05-09historical $280,000 840-char remark
ⓘ Source: listings_history table (triggers on properties + properties_extension) + one-shot
backfill from property_details.listing_events for pre-trigger history.
Tax reassessment forecast MN · Partial reset (capped growth)
- Current annual tax
- $1,944 · $162/mo
- Projected year-2 tax
- $2,540 · $212/mo
- Expected delta
- +$596/yr (+$50/mo · 30.7%)
ⓘ Screening estimate from a state-policy table — verify with the county assessor before closing.
Climate risk First Street
- Flood 1/10 Low FEMA zone X (unshaded) · 0% chance over 30 yrs
- Wildfire 2/10 Low
- Heat 2/10 Low 7 d/yr ≥97°F today · 13 d/yr by 30 yrs out
- Wind 2/10 Low
- Air quality 3/10 Moderate 3 unhealthy d/yr today · 3 by 30 yrs out
Nearby sold comps map
Loading sold comps map…
Walkable amenities ~0.75 mi
Loading nearby amenities…
Taxation est. · year 1
- Rental income
- $24,467
- − Mortgage interest
- −$15,684
- − Property taxes
- −$1,944
- − Insurance
- −$1,400
- − Repairs & maintenance
- −$1,957
- − Management
- −$1,957
- − Depreciation
- −$8,145
- Taxable loss
- −$6,621
- Est. tax savings @ 24.0%
- +$1,589
- After-tax cash flow
- $-46/yr
For passive investors: Depreciation is non-cash, so a rental often shows a tax loss while cash-flowing — sheltering income. Rental losses are passive: they offset passive income freely, and up to $25,000/yr can offset ordinary (W-2) income if you actively participate and your MAGI is under $100k (phasing out to $0 by $150k); unused losses carry forward. On sale, claimed depreciation is recaptured at up to 25%, and gains may owe capital-gains tax (a 1031 exchange can defer both). Figures are a year-1 estimate at your 24.0% rate — not tax advice; consult a CPA.
Schools (NCES district)
- District
- St. Cloud Public School District
- NCES district ID
- 2733510
- Math proficiency
- 27% ▼ -9.00%
- Reading proficiency
- 38% ▼ -5.00%
- Median HH income
- $46,638
- Composite
- 27.91/100
- National rank
- #6866
- State rank
- #264 of 301 in MN
Livability — St. Cloud
No livability data for this city. (Only ~50 U.S. cities are tracked.)
Census & demographics
- County
- Sherburne County · 120,363 people
- City population
- 60,914
- Metro
- Minneapolis-St. Paul-Bloomington, MN-WI
- Population (ZIP)
- 17,473
- Household income
- $58,148
- Rent vs Own
- Severe rent burden
- 1175.0
Population outlook (Sherburne County) Hauer SSP2
- Today (2025)
- 97,402 people
- By 2030
- 99,341 · +2.0%
- By 2040
- 101,188 · +3.9%
- By 2050
- 99,214 · +1.9%
- By 2075
- 88,700 · -8.9%
- By 2100
- 72,241 · -25.8%
Race, ethnicity, and origin ACS 2023
- Neighborhood character
- Predominantly White (65%)
- Race & ethnicity
- White 65% Black 17% Two or more races 9% Asian 5% Hispanic / Latino 4% Native American 2%
- Common ancestry
- Portuguese 6% Romanian 5% Slovak 3%
- Foreign-born
- 10% · Vietnam, Canada, China
- Languages at home
- 85% English-only · Spanish 3% Vietnamese 2% Other Asian/Pacific 1%
Political lean MEDSL · Sherburne
- 2024 margin
- Solid R (+34.9) · D 31.7% · R 66.6% · Other 1.7%
- 2008→2024 swing
- -16.7pp toward R · 2008: -18.2pp · 2024: -34.9pp
- All cycles
- 2024: R+34.9 2020: R+32.6 2016: R+37.0 2012: R+22.1 2008: R+18.2
Not yet ingested
- Civics
- —
Market trends
- HPI YoY
- ▼ -60.11%
- Current HPI
- 220.2539
- Rent YoY
- ▲ 3.79%
- Metro
- Minneapolis-St. Paul-Bloomington, MN-WI
- State GDP YoY
- ▲ 2.41%
- F500 in state
- 34
Industry mix (Fortune 500 HQ in MN)
| Industry | F500 HQs | Revenue |
|---|---|---|
| Healthcare | 2 | $407B |
|
||
| Retail | 2 | $150B |
|
||
| Consumer Goods | 2 | $32B |
|
||
| Industrial Machinery | 2 | $6B |
|
||
| Agriculture | 1 | $40B |
|
||
| Healthcare / Medical Devices | 1 | $32B |
|
||
Price history
+0.0% since first listed4 events — show timeline
- 2026-05-30 Pending — NORTHSTARMLS as Distributed by MLS Grid
- 2026-05-20 Contingent — NORTHSTARMLS as Distributed by MLS Grid
- 2026-05-11 Listed $280,000 NORTHSTARMLS as Distributed by MLS Grid
- 2026-05-09 Coming Soon $280,000 NORTHSTARMLS as Distributed by MLS Grid
Property tax history
+4.9%/yrLatest (2025): $1,944 · +1.7% YoY. Source: county tax records.
Cash-flow waterfall
monthlySold comps — $/sqft
last 12 mo · ≤1 miLoading sold comps…