560 S Navarro St · Giddings, TX
Flood risk 1/10 · Minimal
- FEMA flood zone
- X (unshaded)
- Chance of flooding over 30 yrs
- 0.0%
- Est. flood insurance / yr
- $507 – $1,088
Fire risk 3/10 · Minor
- Est. fire insurance / yr
- $1,222 – $2,270
Heat risk 8/10 · Major
- Hot days now (above 109°F)
- 7 days/yr
- Hot days in 30 yrs
- 22 days/yr
Wind risk 8/10 · Major
- Chance of severe wind over 30 yrs
- 91.0%
Air-quality risk 1/10 · Minimal
- Unhealthy air days now
- 0 days/yr
- Unhealthy air days in 30 yrs
- 0 days/yr
Risk factors via First Street. Map © Google.
Why this score? — see what drove the B+ grade
The composite is a weighted blend of 9 inputs, each scored 0–100. Each bar is that input's sub-score; the figure is the points it added to the 100-point composite (weight × sub-score).
- Cash flow +30.0/30.0
- ARV discount +15.0/15.0
- 1% rule +10.0/10.0
- DSCR +10.0/10.0
- Schools +3.8/10.0
- Livability +3.2/5.0
- Rent growth +2.5/5.0
- Condition / age +2.5/5.0
- Appreciation +0.0/10.0
$55,000
🖨 Deal sheet (PDF) 📄 Offer letter ✓ Due diligence
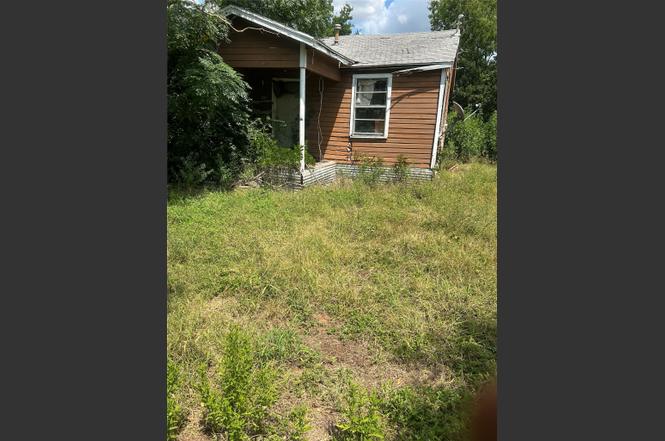
Listing remarks
This is an excellent lot for new construction, competitively priced to sell. The seller is highly motivated.
Key facts
- 8,624 sq ft lot
- Built 1955
- Listed 20 days
Neighborhood map
What this means for you Summary
Snapshot
- This is a 1-bed/1.0-bath single-family listed at $55k.
Deal economics
- At list price, monthly cash flow is $318 ($4k/yr) — positive.
- The deal already cash-flows at list — no discount required.
- Meets the 1% rule at list price ($970 rent vs $55k).
- Recommended offer: $54k (1.5% below list) — sets the bar for market timing.
- Cap rate 13.2% vs local median 3.4% in Giddings — top-decile yield for the area; either an underpriced asset or a hidden risk that comps aren't pricing in. Stress-test before assuming the spread holds.
Location & tenants
- Location reads 64/100 on livability (#751 in TX) — a middle-class / working-renter tenant base. Strengths: cost of living A+, housing A+; Watch: schools F, amenities F, commute F.
- Giddings ISD (rural): math 45% / reading 45% proficiency, ranked #270 of 826 in TX (top 33%) — families likely to look elsewhere, expect single-tenant / working-renter base with shorter leases.
- Market conditions: 92 active listings in the ZIP; 18 units permitted in Lee County in 2024 (0 in 5+ unit buildings).
Forward outlook
- Local home prices are declining (-3.0%/yr); year-one equity from $380 of loan paydown is wiped out by about $2k of value loss. Plan a longer hold.
- At projected returns (-3.0% appreciation + 3.0% rent growth), your $15k cash investment doubles in ~5 years — after that, you're playing with house money.
Negotiation context
- It's been on market 20 days — a 2% lower offer ($54k) is reasonable based on typical stale-listing flexibility.
Risks & watch-outs
- Watch-outs: property tax is 3.0% of price; built in 1955 — expect roof / HVAC / electrical / plumbing capex.
- Climate carrying-cost: severe wind risk, 91% chance of damaging wind over 30y; extreme-heat days projected 7→22/yr by 2055 (HVAC capex compounding) — expect insurance premiums to compound above CPI over the hold.
Questions for the listing agent
- Built in 1955 — when were the roof, HVAC, electrical panel, plumbing, and water heater last replaced?
- Property tax is high relative to price — has the assessment been appealed recently, and will the sale trigger a re-assessment?
- Is there a deadline driving the sale (1031 exchange, divorce, estate, relocation)? That informs how much negotiation room exists.
- Schools are F-rated, which usually means shorter tenancies and higher turnover. Who's the typical renter profile here, and what's been the actual vacancy rate?
- What's the average days-on-market for RENTAL listings here right now (not sales)? A rising rental-DOM trend means longer vacancies and softer asking-rent achievability than the comps imply.
- What's the recent tenant-quality profile in this submarket — average credit score on applications, eviction rate, late-payment / NSF rate, and stable-employment percentage? A property-management company in the area should have these aggregated.
- How much new for-sale + rental construction is in the pipeline within 1–3 miles? Heavy new supply typically softens prices + rents 12–24 months out; constrained supply supports both.
Investment metrics
- 1% rule
- 1.76% ✓
- Cap rate
- 13.24%
- Cash-on-cash
- 24.81%
- DSCR
- 2.10
- GRM
- 4.7
CMA / ARV
- ARV (on-the-fly)
- $84,672
- Comps found
- 1
Show comp detail 1 sale within ~0.75 mi
| Address | Dist | Beds/Ba | Sqft | Sold | Price | $/sf | Match |
|---|---|---|---|---|---|---|---|
| 207 S Waco St | 0.26mi | 1/1.0 | 706 (+5%) | 3mo | $89,000 | $126 | 77 |
Match score weights: distance 35% · size 25% · config 20% · recency 20%. Top-matched comps best support the ARV.
Projected returns pro-forma
-3.0% appreciation · 3.0% rent growth · sell at horizon
- IRR
- 18.3%
- Equity multiple
- 1.74×
- Total profit
- $11,426
- Equity at exit
- $8,201
- IRR
- 26.7%
- Equity multiple
- 3.36×
- Total profit
- $36,295
- Equity at exit
- $4,755
Cash invested: $15,400 (down + closing). Projections, not guarantees.
Landlord ↔ Tenant lean methodology
- Overall (STATE)
- 87 Strongly Landlord-Friendly
- State Texas
- 87 Strongly Landlord-Friendly · R+5
- County
- — inherits STATE
- City
- — inherits STATE
ZIP-level market 78942
- Home prices YoY
- -17.2%
- Active inventory
- 92
- Price-to-rent
- 4.7×
Monthly cashflow live
- Estimated rent
- $970 medium interval (Pro) →
- Mortgage (P&I)
- −$288
- Tax from tax record
- −$136 /mo · $1,637/yr
- Insurance
- −$23
- HOA
- −$0
- Vacancy / Maint / Mgmt
- −$204
- Net cashflow
- $318
Break-even live
Sensitivity live
| Price | -10% $350 | -5% $334 | +0% $318 | +5% $303 | +10% $287 |
|---|---|---|---|---|---|
| Rent | -10% $242 | -5% $280 | +0% $318 | +5% $357 | +10% $395 |
| Rate | -1.0pp $346 | -0.5pp $332 | base $318 | +0.5pp $304 | +1.0pp $290 |
UW: 25.0% down · 7.5% · 30yr · 1.5% tax · 5.0% vac · 8.0% maint · 8.0% mgmt
Financing live
Cash to close
- Down payment
- $13,750
- Closing costs
- $1,650
- Reserves months
- —
- Total cash needed
- —
Loan-product check · same deal, 3 products live
Conventional
25% down · 7.5% · 30yr
- Down + closing
- —
- Monthly P&I
- —
- Monthly cashflow
- —
- DSCR
- —
- Eligible?
- —
Personal DTI + credit; lowest rate.
DSCR
20% down · 8.5% · 30yr
- Down + closing
- —
- Monthly P&I
- —
- Monthly cashflow
- —
- DSCR
- —
- Eligible?
- —
No personal income docs; deal must DSCR.
Hard money
10% down · 12.0% · 12mo
- Down + closing
- —
- Monthly P&I
- —
- Monthly cashflow
- —
- DSCR
- —
- Eligible?
- —
Short-term bridge; refi at stabilization.
Listing history 5 events
-
2025-09-04status Pending
-
2025-08-21price $55,000
-
2025-08-17price $70,000
-
2025-08-15$99,000 Active
-
1990-04-09soldstatus
ⓘ Source: listings_history table (triggers on properties + properties_extension) + one-shot
backfill from property_details.listing_events for pre-trigger history.
Tax reassessment forecast TX · Resets to sale price
- Current annual tax
- $1,637 · $136/mo
- Projected year-2 tax
- $1,637 · $136/mo
- Expected delta
- $0/yr ($0/mo · 0.0%)
ⓘ Screening estimate from a state-policy table — verify with the county assessor before closing.
Climate risk First Street
- Flood 1/10 Low FEMA zone X (unshaded) · 0% chance over 30 yrs
- Wildfire 3/10 Moderate
- Heat 8/10 Severe 7 d/yr ≥109°F today · 22 d/yr by 30 yrs out
- Wind 8/10 Severe 91% chance of damaging wind over 30 yrs
- Air quality 1/10 Low 0 unhealthy d/yr today · 0 by 30 yrs out
Nearby sold comps map
Loading sold comps map…
Walkable amenities ~0.75 mi
Loading nearby amenities…
Taxation est. · year 1
- Rental income
- $11,639
- − Mortgage interest
- −$3,081
- − Property taxes
- −$1,637
- − Insurance
- −$275
- − Repairs & maintenance
- −$931
- − Management
- −$931
- − Depreciation
- −$1,600
- Taxable income
- $3,184
- Est. tax owed @ 24.0%
- −$764
- After-tax cash flow
- $3,057/yr
For passive investors: Depreciation is non-cash, so a rental often shows a tax loss while cash-flowing — sheltering income. Rental losses are passive: they offset passive income freely, and up to $25,000/yr can offset ordinary (W-2) income if you actively participate and your MAGI is under $100k (phasing out to $0 by $150k); unused losses carry forward. On sale, claimed depreciation is recaptured at up to 25%, and gains may owe capital-gains tax (a 1031 exchange can defer both). Figures are a year-1 estimate at your 24.0% rate — not tax advice; consult a CPA.
Schools (NCES district)
- District
- Giddings ISD
- NCES district ID
- 4820640
- Math proficiency
- 45% ▬ 0.00%
- Reading proficiency
- 45% ▲ 4.00%
- Median HH income
- $46,580
- Composite
- 38.32/100
- National rank
- #4226
- State rank
- #270 of 826 in TX
Livability — Giddings
- Score
- 64/100
- State rank
- #751
- US rank
- #13837
Category grades
Schools grade is shown separately in the Schools card above.
Census & demographics
- Census place
- Giddings, TX
- Population (ZIP)
- 9,858
Population outlook (Lee County) Hauer SSP2
- Today (2025)
- 17,796 people
- By 2030
- 18,082 · +1.6%
- By 2040
- 18,377 · +3.3%
- By 2050
- 17,950 · +0.9%
- By 2075
- 16,005 · -10.1%
- By 2100
- 13,413 · -24.6%
Race, ethnicity, and origin ACS 2023
- Neighborhood character
- Diverse neighborhood (Simpson 0.61)
- Race & ethnicity
- White 51% Hispanic / Latino 34% Black 12% Two or more races 10% Native American 3%
- Hispanic origin (detail)
- Mexican 32%
- Common ancestry
- Lithuanian 2% Romanian 2% Portuguese 2%
- Foreign-born
- 10% · Canada
- Languages at home
- 73% English-only · Spanish 26% German/W. Germanic 1%
Political lean MEDSL · Lee
- 2024 margin
- Solid R (+60.4) · D 19.5% · R 79.9%
- 2008→2024 swing
- -24.2pp toward R · 2008: -36.3pp · 2024: -60.4pp
- All cycles
- 2024: R+60.4 2020: R+55.7 2016: R+55.6 2012: R+46.3 2008: R+36.3
Not yet ingested
- Civics
- —
Market trends
- HPI YoY
- ▼ -42.66%
- Current HPI
- 205.1633
- Rent YoY
- —
- Metro
- —
- State GDP YoY
- ▲ 3.95%
- F500 in state
- 110
Industry mix (Fortune 500 HQ in TX)
| Industry | F500 HQs | Revenue |
|---|---|---|
| Energy | 16 | $1,198B |
|
||
| Technology | 5 | $198B |
|
||
| Engineering / Construction | 4 | $72B |
|
||
| Energy Services | 3 | $60B |
|
||
| Utilities | 3 | $41B |
|
||
| Healthcare | 2 | $330B |
|
||
Price history
-44.4% since first listed5 events — show timeline
- 2025-09-04 Pending — Unlock MLS
- 2025-08-21 Price Changed $55,000 Unlock MLS
- 2025-08-17 Price Changed $70,000 Unlock MLS
- 2025-08-15 Listed $99,000 Unlock MLS
- 1990-04-09 Sold (Public Records) — Public Records
Property tax history
+9.0%/yrLatest (2025): $1,637 · +7.6% YoY. Source: county tax records.
Cash-flow waterfall
monthlySold comps — $/sqft
last 12 mo · ≤1 miLoading sold comps…