 🏗️ New Construction
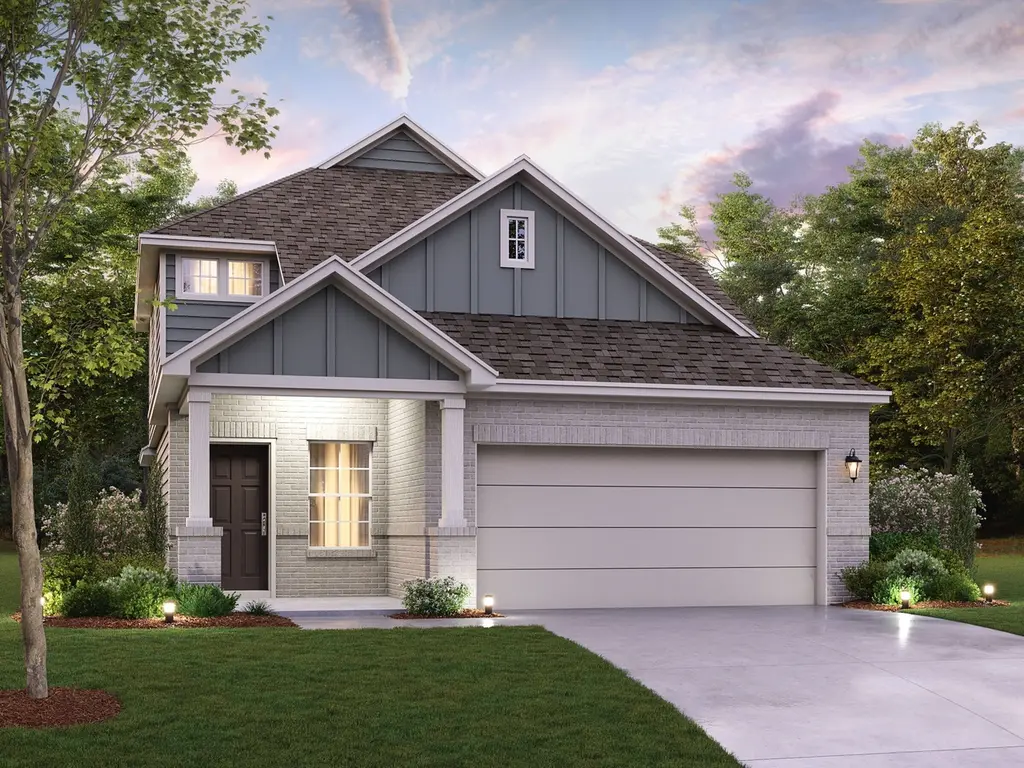
Gardenia Plan · Willis, TX
Flood risk 1/10 · Minimal
- FEMA flood zone
- X (unshaded)
- Chance of flooding over 30 yrs
- 0.0%
- Est. flood insurance / yr
- $507 – $1,088
Fire risk 4/10 · Minor
- Est. fire insurance / yr
- $1,222 – $2,270
Heat risk 8/10 · Major
- Hot days now (above 111°F)
- 6 days/yr
- Hot days in 30 yrs
- 20 days/yr
Wind risk 8/10 · Major
- Chance of severe wind over 30 yrs
- 99.0%
Air-quality risk 2/10 · Minimal
- Unhealthy air days now
- 1 days/yr
- Unhealthy air days in 30 yrs
- 1 days/yr
Risk factors via First Street. Map © Google.
Why this score? — see what drove the F grade
The composite is a weighted blend of 9 inputs, each scored 0–100. Each bar is that input's sub-score; the figure is the points it added to the 100-point composite (weight × sub-score).
- ARV discount +7.5/15.0
- Cash flow +5.8/30.0
- Schools +3.2/10.0
- Livability +3.1/5.0
- Rent growth +2.7/5.0
- Condition / age +2.5/5.0
- 1% rule +1.2/10.0
- Appreciation +0.9/10.0
- DSCR +0.2/10.0
$290,990
🖨 Deal sheet (PDF) 📄 Offer letter ✓ Due diligence
Listing remarks MLS
The Gardenia is a two-story floorplan by M/I Homes offering 2,318 to 2,393 square feet of thoughtfully crafted living space. Featuring 3 spacious bedrooms, 2.5 bathrooms, and a flexible 2- or 3-car garage, this home is designed to accommodate your lifestyle.
Key facts
- 2 garage spots
- Listed 86 days
Neighborhood map
What this means for you Summary
Snapshot
- This is a 4-bed/3.0-bath single-family listed at $291k.
Deal economics
- At list price, monthly cash flow is $-694 ($-8k/yr) — negative.
- To cash-flow at today's rent, offer at most $250k (14.2% below list).
- To meet the 1% rule (rent ≥ 1% of price), the offer needs to be $219k (24.9% below list).
- Recommended offer: $219k (24.9% below list) — sets the bar for 1% rule.
Location & tenants
- Location reads 62/100 on livability (#933 in TX) — a middle-class / working-renter tenant base. Strengths: cost of living A+, housing A+; Watch: crime C-, employment D+, amenities F.
- Willis ISD (rural): math 33% / reading 40% proficiency, ranked #458 of 826 in TX (top 55%) — families likely to look elsewhere, expect single-tenant / working-renter base with shorter leases.
- Zoned schools: W Lloyd Meador El (math 45% / reading 44%, grade F, #1,155 of 4,322 statewide, top 29%, 617 students, 43% FRL); Robert P Brabham Middle (math 33% / reading 41%, grade F, #756 of 1,662 statewide, top 47%, 1,117 students, 52% FRL); Willis H S (math 19% / reading 46%, grade F, #1,029 of 1,632 statewide, top 64%, 2,521 students, 57% FRL).
- Market conditions: Rents flat; 721 active listings in the ZIP; 13,259 units permitted in Montgomery County in 2024 (1,402 in 5+ unit buildings).
- This rent runs 37% of the median local income ($71k/yr) — at the standard rent-burdened threshold; future hikes will face affordability resistance.
Forward outlook
- Local home prices are declining (-3.0%/yr); year-one equity from $2k of loan paydown is wiped out by about $11k of value loss. Plan a longer hold.
- Montgomery County population projected at +65% by 2050 — long-run rental-demand tailwind backs the buy-and-hold thesis.
Negotiation context
- It's been on market 86 days — a 6% lower offer ($274k) is reasonable based on typical stale-listing flexibility.
Risks & watch-outs
- Climate carrying-cost: severe wind risk, 99% chance of damaging wind over 30y; extreme-heat days projected 6→20/yr by 2055 (HVAC capex compounding) — expect insurance premiums to compound above CPI over the hold.
Questions for the listing agent
- What do current leases actually rent for vs. the listed asking? Can we see a recent rent roll and the last 12 months of T-12 income?
- It's been on market 86 days. Have you received any prior offers? Is the seller open to a 25% concession, seller financing, or rate buy-down credit?
- Why hasn't it sold? Are there any deal-killer items the seller is aware of (foundation, flood, title, zoning, code violations)?
- Is there a deadline driving the sale (1031 exchange, divorce, estate, relocation)? That informs how much negotiation room exists.
- Schools are D-rated, which usually means shorter tenancies and higher turnover. Who's the typical renter profile here, and what's been the actual vacancy rate?
- The area grade is low — what's the realistic commute time and amenity access for the typical tenant pool here? Any planned neighborhood developments (good or bad) we should know about?
- What's the average days-on-market for RENTAL listings here right now (not sales)? A rising rental-DOM trend means longer vacancies and softer asking-rent achievability than the comps imply.
- What's the recent tenant-quality profile in this submarket — average credit score on applications, eviction rate, late-payment / NSF rate, and stable-employment percentage? A property-management company in the area should have these aggregated.
- How much new for-sale + rental construction is in the pipeline within 1–3 miles? Heavy new supply typically softens prices + rents 12–24 months out; constrained supply supports both.
Investment metrics
- 1% rule
- 0.62% ✗
- Cap rate
- 3.91%
- Cash-on-cash
- -8.49%
- DSCR
- 0.62
- GRM
- 13.4
CMA / ARV
- ARV (median comp)
- $350,237
- List price
- $290,990
- Delta
- -16.92%
- Verdict
- UNDERPRICED
- Comps
- 20 within 1.0 mi
Show comp detail 12 sales within ~0.75 mi
| Address | Dist | Beds/Ba | Sqft | Sold | Price | $/sf | Match |
|---|---|---|---|---|---|---|---|
| 725 Ivory Creek Ct | 0.05mi | 4/3.0 | 2,356 (+2%) | 1mo | $390,000 | $166 | 94 |
| 841 Village Brook Dr | 0.24mi | 4/3.0 | 2,318 (0%) | 1mo | $307,990 | $133 | 88 |
| 237 Draper Shadows Dr | 0.32mi | 4/3.0 | 2,241 (-3%) | 2mo | $314,990 | $141 | 78 |
| 664 Crested Duck Ct | 0.55mi | 4/3.0 | 2,444 (+5%) | 1mo | $430,399 | $176 | 64 |
| 982 Garden Path Dr | 0.35mi | 4/3.0 | 2,069 (-11%) | 2mo | $294,990 | $143 | 64 |
| 275 Mallards Rim Dr | 0.58mi | 4/2.5 | 2,425 (+5%) | 2mo | $409,566 | $169 | 62 |
| 957 Garden Path Dr | 0.32mi | 4/2.0 | 1,990 (-14%) | 2mo | $289,990 | $146 | 56 |
| 526 Cotton Patch Dr | 0.58mi | 3/2.0 (-1) | 2,198 (-5%) | 0mo | $365,000 | $166 | 55 |
| 140 Mockingbird Trails Dr | 0.68mi | 4/3.0 | 2,513 (+8%) | 1mo | $364,990 | $145 | 54 |
| 206 Brecon Buff Dr | 0.63mi | 4/3.5 | 2,525 (+9%) | 2mo | $334,990 | $133 | 52 |
| 303 Landes Trl | 0.74mi | 3/2.0 (-1) | 2,040 (-12%) | 1mo | $339,990 | $167 | 35 |
| 255 Brecon Buff Dr | 0.74mi | 3/2.0 (-1) | 2,025 (-13%) | 0mo | $349,990 | $173 | 35 |
Match score weights: distance 35% · size 25% · config 20% · recency 20%. Top-matched comps best support the ARV.
Projected returns pro-forma
-3.0% appreciation · 0.98% rent growth · sell at horizon
- IRR
- -33.5%
- Equity multiple
- -0.07×
- Total profit
- $-105,286
- Equity at exit
- $52,221
- IRR
- -55.4%
- Equity multiple
- -0.69×
- Total profit
- $-165,633
- Equity at exit
- $30,282
Cash invested: $98,066 (down + closing). Projections, not guarantees.
Landlord ↔ Tenant lean methodology
- Overall (STATE)
- 87 Strongly Landlord-Friendly
- State Texas
- 87 Strongly Landlord-Friendly · R+5
- County
- — inherits STATE
- City
- — inherits STATE
ZIP-level market 77378
- Home prices YoY
- -3.0%
- Rents YoY
- 1.0%
- Active inventory
- 721
- Price-to-rent
- 11.1×
Monthly cashflow live
- Estimated rent
- $2,185 medium interval (Pro) →
- Mortgage (P&I)
- −$1,837
- Tax est. 1.5%
- −$438 /mo · $5,254/yr
- Insurance
- −$146
- HOA
- −$0
- Vacancy / Maint / Mgmt
- −$459
- Net cashflow
- $-694
Break-even live
Sensitivity live
| Price | -10% $-452 | -5% $-573 | +0% $-694 | +5% $-815 | +10% $-936 |
|---|---|---|---|---|---|
| Rent | -10% $-867 | -5% $-780 | +0% $-694 | +5% $-608 | +10% $-522 |
| Rate | -1.0pp $-518 | -0.5pp $-605 | base $-694 | +0.5pp $-785 | +1.0pp $-877 |
UW: 25.0% down · 7.5% · 30yr · 1.5% tax · 5.0% vac · 8.0% maint · 8.0% mgmt
Financing live
Cash to close
- Down payment
- $87,559
- Closing costs
- $10,507
- Reserves months
- —
- Total cash needed
- —
Loan-product check · same deal, 3 products live
Conventional
25% down · 7.5% · 30yr
- Down + closing
- —
- Monthly P&I
- —
- Monthly cashflow
- —
- DSCR
- —
- Eligible?
- —
Personal DTI + credit; lowest rate.
DSCR
20% down · 8.5% · 30yr
- Down + closing
- —
- Monthly P&I
- —
- Monthly cashflow
- —
- DSCR
- —
- Eligible?
- —
No personal income docs; deal must DSCR.
Hard money
10% down · 12.0% · 12mo
- Down + closing
- —
- Monthly P&I
- —
- Monthly cashflow
- —
- DSCR
- —
- Eligible?
- —
Short-term bridge; refi at stabilization.
Listing history 16 events
-
2026-06-21days on market $290,990 Active 86 DOM
-
2026-06-18days on market $290,990 Active 83 DOM
-
2026-06-17days on market $290,990 Active 82 DOM
-
2026-06-16days on market $290,990 Active 81 DOM
-
2026-06-15days on market $290,990 Active 80 DOM
-
2026-06-13days on market $290,990 Active 78 DOM
-
2026-06-09days on market $290,990 Active 74 DOM
-
2026-06-08days on market $290,990 Active 73 DOM
-
2026-06-07days on market $290,990 Active 72 DOM
-
2026-06-04days on market $290,990 Active 69 DOM
-
2026-06-03days on market $290,990 Active 68 DOM
-
2026-06-02days on market $290,990 Active 67 DOM
-
2026-06-01days on market $290,990 Active 66 DOM
-
2026-05-31days on market $290,990 Active 65 DOM
-
2026-04-03price $290,490 258-char remark
Show marketing remark (258 chars)
The Gardenia is a two-story floorplan by M/I Homes offering 2,318 to 2,393 square feet of thoughtfully crafted living space. Featuring 3 spacious bedrooms, 2.5 bathrooms, and a flexible 2- or 3-car garage, this home is designed to accommodate your lifestyle.
-
2026-03-27$289,990 Active 258-char remark
Show marketing remark (258 chars)
The Gardenia is a two-story floorplan by M/I Homes offering 2,318 to 2,393 square feet of thoughtfully crafted living space. Featuring 3 spacious bedrooms, 2.5 bathrooms, and a flexible 2- or 3-car garage, this home is designed to accommodate your lifestyle.
ⓘ Source: listings_history table (triggers on properties + properties_extension) + one-shot
backfill from property_details.listing_events for pre-trigger history.
Climate risk First Street
- Flood 1/10 Low FEMA zone X (unshaded) · 0% chance over 30 yrs
- Wildfire 4/10 Moderate
- Heat 8/10 Severe 6 d/yr ≥111°F today · 20 d/yr by 30 yrs out
- Wind 8/10 Severe 99% chance of damaging wind over 30 yrs
- Air quality 2/10 Low 1 unhealthy d/yr today · 1 by 30 yrs out
Nearby sold comps map
Loading sold comps map…
Walkable amenities ~0.75 mi
Loading nearby amenities…
Taxation est. · year 1
- Rental income
- $26,221
- − Mortgage interest
- −$19,619
- − Property taxes
- −$5,254
- − Insurance
- −$1,751
- − Repairs & maintenance
- −$2,098
- − Management
- −$2,098
- − Depreciation
- −$10,189
- Taxable loss
- −$14,786
- Est. tax savings @ 24.0%
- +$3,549
- After-tax cash flow
- $-4,781/yr
For passive investors: Depreciation is non-cash, so a rental often shows a tax loss while cash-flowing — sheltering income. Rental losses are passive: they offset passive income freely, and up to $25,000/yr can offset ordinary (W-2) income if you actively participate and your MAGI is under $100k (phasing out to $0 by $150k); unused losses carry forward. On sale, claimed depreciation is recaptured at up to 25%, and gains may owe capital-gains tax (a 1031 exchange can defer both). Figures are a year-1 estimate at your 24.0% rate — not tax advice; consult a CPA.
Schools (NCES district)
- District
- Willis ISD
- NCES district ID
- 4845900
- Math proficiency
- 33% ▼ -15.00%
- Reading proficiency
- 40% ▼ -2.00%
- Median HH income
- $57,828
- Composite
- 32.32/100
- National rank
- #5746
- State rank
- #458 of 826 in TX
Livability — Willis
- Score
- 62/100
- State rank
- #933
- US rank
- #16579
Category grades
Schools grade is shown separately in the Schools card above.
Census & demographics
- County
- Montgomery County · 663,713 people
- City population
- 38,421
- Metro
- Houston-The Woodlands-Sugar Land, TX
- Population (ZIP)
- 17,629
- Household income
- $71,143
- Rent vs Own
- Severe rent burden
- 402.0
Population outlook (Montgomery County) Hauer SSP2
- Today (2025)
- 713,896 people
- By 2030
- 805,263 · +12.8%
- By 2040
- 992,708 · +39.1%
- By 2050
- 1,179,590 · +65.2%
- By 2075
- 1,628,084 · +128.1%
- By 2100
- 1,937,880 · +171.5%
Race, ethnicity, and origin ACS 2023
- Neighborhood character
- Diverse neighborhood (Simpson 0.55)
- Race & ethnicity
- White 58% Hispanic / Latino 32% Two or more races 14% Black 7% Native American 1%
- Hispanic origin (detail)
- Mexican 27%
- Common ancestry
- Romanian 2% Slovak 2% Serbian 1%
- Foreign-born
- 12% · Canada
- Languages at home
- 80% English-only · Spanish 19%
Political lean MEDSL · Montgomery
- 2024 margin
- Solid R (+45.5) · D 26.8% · R 72.3%
- 2008→2024 swing
- +7.2pp toward D · 2008: -52.7pp · 2024: -45.5pp
- All cycles
- 2024: R+45.5 2020: R+43.8 2016: R+51.4 2012: R+60.7 2008: R+52.7
Not yet ingested
- Civics
- —
Market trends
- HPI YoY
- ▼ -8.25%
- Current HPI
- 261.9673
- Rent YoY
- ▲ 0.98%
- Metro
- Houston-The Woodlands-Sugar Land, TX
- State GDP YoY
- ▲ 3.95%
- F500 in state
- 110
Industry mix (Fortune 500 HQ in TX)
| Industry | F500 HQs | Revenue |
|---|---|---|
| Energy | 16 | $1,198B |
|
||
| Technology | 5 | $198B |
|
||
| Engineering / Construction | 4 | $72B |
|
||
| Energy Services | 3 | $60B |
|
||
| Utilities | 3 | $41B |
|
||
| Healthcare | 2 | $330B |
|
||
Price history
+0.2% since first listed2 events — show timeline
- 2026-04-03 Price Changed $290,490 Zillow
- 2026-03-27 Listed $289,990 Zillow
Cash-flow waterfall
monthlySold comps — $/sqft
last 12 mo · ≤1 miLoading sold comps…