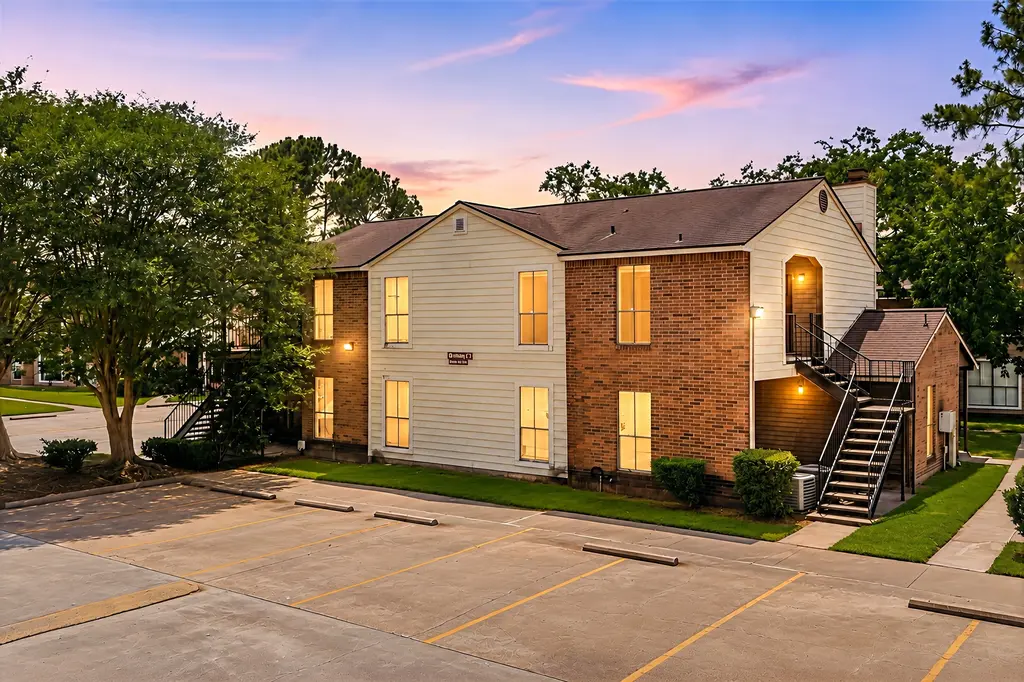
 Fourplex
7200 W T C Jester Blvd #41 · Houston, TX
Flood risk 4/10 · Minor
- FEMA flood zone
- X (unshaded)
- Chance of flooding over 30 yrs
- 0.2%
- Est. flood insurance / yr
- $507 – $1,088
Fire risk 1/10 · Minimal
- Est. fire insurance / yr
- $1,222 – $2,270
Heat risk 9/10 · Severe
- Hot days now (above 109°F)
- 7 days/yr
- Hot days in 30 yrs
- 24 days/yr
Wind risk 9/10 · Severe
- Chance of severe wind over 30 yrs
- 99.0%
Air-quality risk 3/10 · Minor
- Unhealthy air days now
- 3 days/yr
- Unhealthy air days in 30 yrs
- 4 days/yr
Risk factors via First Street. Map © Google.
Why this score? — see what drove the C+ grade
The composite is a weighted blend of 9 inputs, each scored 0–100. Each bar is that input's sub-score; the figure is the points it added to the 100-point composite (weight × sub-score).
- Cash flow +27.0/30.0
- 1% rule +9.9/10.0
- DSCR +9.4/10.0
- ARV discount +7.5/15.0
- Livability +3.7/5.0
- Condition / age +2.5/5.0
- Rent growth +2.2/5.0
- Schools +1.5/10.0
- Appreciation +0.0/10.0
$360,000
🖨 Deal sheet 📄 Offer letter ✓ Due diligence
Multi-family units
County records classify this as Multi-Family (2-4 Unit). Listing-text estimate: 4 units. confirmed
Listing remarks
Rare FULLY RENTED 4-plex investment opportunity in a convenient Houston location w/ proven profitable rental history & strong unit variety! This income-producing property offers no known foundation issues, PEX piping, granite counters in all units, tile flooring in downstairs units & vinyl flooring upstairs. The property features 2 newer AC units, 2 older AC units that are currently working, 2 new water heaters & only one unit needing some kitchen cabinet repair. Smart unit mix includes Units A & B w/ 1 bed/1 bath layouts at approx. 762-769 SF, Unit C w/ 2 beds/2 baths at approx. 1,025 SF & Unit D w/ 3 beds/2 baths at approx. 1,179 SF. Current rent notes show 1
Key facts
- Location near dining
- New water heaters
- Pex piping
Tags
Property features AI
Finance
- Other: Seller disclosure available
- HOA & community: Inwood Village Owners Association; Monthly association fee of $745 covering common areas, structure maintenance, and insurance; Guarded community
Exterior
- Parking: Paved parking
- Security: Guard at association
- Home design: Residential income property; 4-unit building
- Construction: Built in 1983; Brick and cement siding construction; Composition roof
- Exterior features: Security gate; Fire alarm
Interior
- Kitchen: Dishwasher
- Flooring: Plank; Tile; Vinyl
- Bathrooms: 6 full bathrooms
- Heating & cooling: Central heating (electric); Central air (electric)
- Interior features: Fireplace; Granite counters
Neighborhood map
What this means for you Summary
Snapshot
- This is a 2×1bd/1ba + 1×2bd/2ba + 1×3bd/2ba units multifamily listed at $360k.
Deal economics
- At list price, monthly cash flow is $1k ($12k/yr) — positive. Per door: $253/mo.
- The deal already cash-flows at list — no discount required.
- Meets the 1% rule at list price ($5k rent vs $360k).
- Recommended offer: $355k (1.5% below list) — sets the bar for market timing.
- Cap rate 9.7% vs local median 3.2% in Houston — top-decile yield for the area; either an underpriced asset or a hidden risk that comps aren't pricing in. Stress-test before assuming the spread holds.
Location & tenants
- Location reads 74/100 on livability (#184 in TX, #4,771 nationally) — a middle-class / working-renter tenant base. Strengths: amenities A+, cost of living A+, housing A+; Watch: crime F.
- Aldine ISD (suburban): math 16% / reading 21% proficiency, ranked #790 of 826 in TX (top 96%) — low school quality limits family demand, transient renter base, plan for 1-2y turnover; 79% free/reduced lunch — lower-income household profile, screen leases tightly.
- Zoned schools: Reed Academy (math 11% / reading 14%, grade F, #4,167 of 4,322 statewide, top 97%, 677 students, 93% FRL); Hoffman Middle (math 17% / reading 24%, grade F, #1,407 of 1,662 statewide, top 86%, 637 students, 91% FRL); Eisenhower H S (math 16% / reading 23%, grade F, #1,424 of 1,632 statewide, top 88%, 2,855 students, 83% FRL).
- Market conditions: Rents soft (-1.0%/yr); 468 active listings in the ZIP; 29,883 units permitted in Harris County in 2024 (8,621 in 5+ unit buildings).
- At $5,373/mo this rent would consume 118% of the median local household income ($54k/yr) (locally 2294% of renters already pay >50% of income on rent) — very limited rent-growth headroom before tenants either downsize or default.
Forward outlook
- Local home prices are declining (-3.0%/yr); year-one equity from $2k of loan paydown is wiped out by about $11k of value loss. Plan a longer hold.
- Harris County population projected at +47% by 2050 — long-run rental-demand tailwind backs the buy-and-hold thesis.
Negotiation context
- It's been on market 16 days — a 2% lower offer ($355k) is reasonable based on typical stale-listing flexibility.
- 2 sale attempts since 24y ago with the ask held roughly flat each time — persistent listings suggest the price (not the market) is what's stuck; bring a comps-based counter.
Risks & watch-outs
- Climate carrying-cost: severe wind risk, 99% chance of damaging wind over 30y; extreme-heat days projected 7→24/yr by 2055 (HVAC capex compounding) — expect insurance premiums to compound above CPI over the hold.
Questions for the listing agent
- Can we see the unit-by-unit rent roll, current vacancy, and any below-market leases? What's the average tenancy length?
- What capital expenditures (roof, boiler, parking lot, exteriors) have been made in the last 5 years, and what's planned in the next 2?
- What does the HOA fee cover, when was the last increase, and are there any pending special assessments or reserve-fund shortfalls?
- Is there a deadline driving the sale (1031 exchange, divorce, estate, relocation)? That informs how much negotiation room exists.
- Schools are D-rated, which usually means shorter tenancies and higher turnover. Who's the typical renter profile here, and what's been the actual vacancy rate?
- Crime grade is F in this area — have there been break-ins, vandalism, or insurance claims at this property in the last 3 years? What carrier currently insures it and at what premium?
- What's the average days-on-market for RENTAL listings here right now (not sales)? A rising rental-DOM trend means longer vacancies and softer asking-rent achievability than the comps imply.
- What's the recent tenant-quality profile in this submarket — average credit score on applications, eviction rate, late-payment / NSF rate, and stable-employment percentage? A property-management company in the area should have these aggregated.
- How much new apartment / multifamily construction is in the pipeline within 1–3 miles? Heavy new supply (>2% of stock underway) typically softens rents 12–24 months out; light construction supports rent growth.
Investment metrics
- 1% rule
- 1.49% ✓
- Cap rate
- 9.67%
- Cash-on-cash
- 12.05%
- DSCR
- 1.54
- GRM
- 5.6
CMA / ARV
No comps found within radius.
Projected returns pro-forma
-3.0% appreciation · 0.0% rent growth · sell at horizon
- IRR
- -2.5%
- Equity multiple
- 0.91×
- Total profit
- $-9,101
- Equity at exit
- $53,677
- IRR
- 2.7%
- Equity multiple
- 1.16×
- Total profit
- $16,390
- Equity at exit
- $31,126
Cash invested: $100,800 (down + closing). Projections, not guarantees.
Landlord ↔ Tenant lean methodology
- Overall (STATE)
- 87 Strongly Landlord-Friendly
- State Texas
- 87 Strongly Landlord-Friendly · R+5
- County
- — inherits STATE
- City
- — inherits STATE
ZIP-level market 77088
- Home prices YoY
- -23.2%
- Rents YoY
- -1.0%
- Active inventory
- 468
- Price-to-rent
- 29.2×
Monthly cashflow live
- Estimated rent
- $5,373 high interval (Pro) →
- Mortgage (P&I)
- −$1,888
- Tax est. 1.5%
- −$450 /mo · $5,400/yr
- Insurance
- −$150
- HOA
- −$745
- Vacancy / Maint / Mgmt
- −$1,128
- Net cashflow
- $1,012
Break-even live
4-unit breakdown (identical units grouped — click to expand)
| Units | Beds | Baths | Est. rent |
|---|---|---|---|
| 2× units | 1 | 1 | $2,056 |
| #1 | 1 | 1 | $1,028 |
| #2 | 1 | 1 | $1,028 |
| 1× unit | 2 | 2 | $1,551 |
| 1× unit | 3 | 2 | $1,767 |
| Total (4 units) | $5,373 | ||
UW: 25.0% down · 7.5% · 30yr · 1.5% tax · 5.0% vac · 8.0% maint · 8.0% mgmt
Financing live
Cash to close
- Down payment
- $90,000
- Closing costs
- $10,800
- Reserves months
- —
- Total cash needed
- —
Loan-product check · same deal, 3 products live
Conventional
25% down · 7.5% · 30yr
- Down + closing
- —
- Monthly P&I
- —
- Monthly cashflow
- —
- DSCR
- —
- Eligible?
- —
Personal DTI + credit; lowest rate.
DSCR
20% down · 8.5% · 30yr
- Down + closing
- —
- Monthly P&I
- —
- Monthly cashflow
- —
- DSCR
- —
- Eligible?
- —
No personal income docs; deal must DSCR.
Hard money
10% down · 12.0% · 12mo
- Down + closing
- —
- Monthly P&I
- —
- Monthly cashflow
- —
- DSCR
- —
- Eligible?
- —
Short-term bridge; refi at stabilization.
HOA detail
- Monthly dues
- $745 · $8,940/yr
- Likely covers
- water
Listing history 7 events
-
2026-06-03days on market $360,000 Pending 16 DOM
-
2026-06-02days on market $360,000 Pending 15 DOM
-
2026-06-01days on market $360,000 Pending 14 DOM
-
2026-05-31days on market $360,000 Pending 13 DOM
-
2026-05-18$360,000 Active
-
2003-05-10historical
-
2002-10-15$136,500
ⓘ Source: listings_history table (triggers on properties + properties_extension) + one-shot
backfill from property_details.listing_events for pre-trigger history.
Climate risk First Street
- Flood 4/10 Moderate FEMA zone X (unshaded) · 20% chance over 30 yrs
- Wildfire 1/10 Low
- Heat 9/10 Extreme 7 d/yr ≥109°F today · 24 d/yr by 30 yrs out
- Wind 9/10 Extreme 99% chance of damaging wind over 30 yrs
- Air quality 3/10 Moderate 3 unhealthy d/yr today · 4 by 30 yrs out
Nearby sold comps map
Loading sold comps map…
Walkable amenities ~0.75 mi
Loading nearby amenities…
Taxation est. · year 1
- Rental income
- $64,476
- − Mortgage interest
- −$20,166
- − Property taxes
- −$5,400
- − Insurance
- −$1,800
- − Repairs & maintenance
- −$5,158
- − Management
- −$5,158
- − HOA
- −$8,940
- − Depreciation
- −$10,473
- Taxable income
- $7,382
- Est. tax owed @ 24.0%
- −$1,772
- After-tax cash flow
- $10,370/yr
For passive investors: Depreciation is non-cash, so a rental often shows a tax loss while cash-flowing — sheltering income. Rental losses are passive: they offset passive income freely, and up to $25,000/yr can offset ordinary (W-2) income if you actively participate and your MAGI is under $100k (phasing out to $0 by $150k); unused losses carry forward. On sale, claimed depreciation is recaptured at up to 25%, and gains may owe capital-gains tax (a 1031 exchange can defer both). Figures are a year-1 estimate at your 24.0% rate — not tax advice; consult a CPA.
Schools (NCES district)
- District
- Aldine ISD
- NCES district ID
- 4807710
- Math proficiency
- 16% ▼ -23.00%
- Reading proficiency
- 21% ▼ -11.00%
- Median HH income
- $37,081
- Composite
- 15.42/100
- National rank
- #9317
- State rank
- #790 of 826 in TX
Livability — Houston
- Score
- 74/100
- State rank
- #184
- US rank
- #4771
Category grades
Schools grade is shown separately in the Schools card above.
Census & demographics
- Census place
- Houston, TX
- County
- Harris County · 4,702,590 people
- City population
- 3,226,434
- Metro
- Houston-The Woodlands-Sugar Land, TX
- Population (ZIP)
- 57,047
- Household income
- $54,411
- Rent vs Own
- Severe rent burden
- 2294.0
Population outlook (Harris County) Hauer SSP2
- Today (2025)
- 5,571,493 people
- By 2030
- 6,089,821 · +9.3%
- By 2040
- 7,142,806 · +28.2%
- By 2050
- 8,185,864 · +46.9%
- By 2075
- 10,574,329 · +89.8%
- By 2100
- 12,109,958 · +117.4%
Race, ethnicity, and origin ACS 2023
- Neighborhood character
- Diverse neighborhood (Simpson 0.59)
- Race & ethnicity
- Hispanic / Latino 52% Black 37% Two or more races 18% White 6% Asian 4%
- Hispanic origin (detail)
- Mexican 36%
- Common ancestry
- Lithuanian 1%
- Foreign-born
- 25% · Canada, Vietnam, China
- Languages at home
- 49% English-only · Spanish 47% Vietnamese 3%
Political lean MEDSL · Harris
- 2024 margin
- Lean D (+5.5) · D 52.0% · R 46.4% · Other 1.6%
- 2008→2024 swing
- +3.9pp toward D · 2008: 1.6pp · 2024: 5.5pp
- All cycles
- 2024: D+5.5 2020: D+13.3 2016: D+12.4 2012: D+0.1 2008: D+1.6
Not yet ingested
- Civics
- —
Market trends
- HPI YoY
- ▼ -98.37%
- Current HPI
- 325.0499
- Rent YoY
- ▼ -1.01%
- Metro
- Houston-The Woodlands-Sugar Land, TX
- State GDP YoY
- ▲ 3.95%
- F500 in state
- 110
Industry mix (Fortune 500 HQ in TX)
| Industry | F500 HQs | Revenue |
|---|---|---|
| Energy | 16 | $1,198B |
|
||
| Technology | 5 | $198B |
|
||
| Engineering / Construction | 4 | $72B |
|
||
| Energy Services | 3 | $60B |
|
||
| Utilities | 3 | $41B |
|
||
| Healthcare | 2 | $330B |
|
||
Price history
+163.7% since first listed3 events — show timeline
- 2026-05-18 Listed $360,000 HARMLS
- 2003-05-10 Listing Removed — HARMLS
- 2002-10-15 Listed $136,500 HARMLS
Cash-flow waterfall
monthlySold comps — $/sqft
last 12 mo · ≤1 miLoading sold comps…