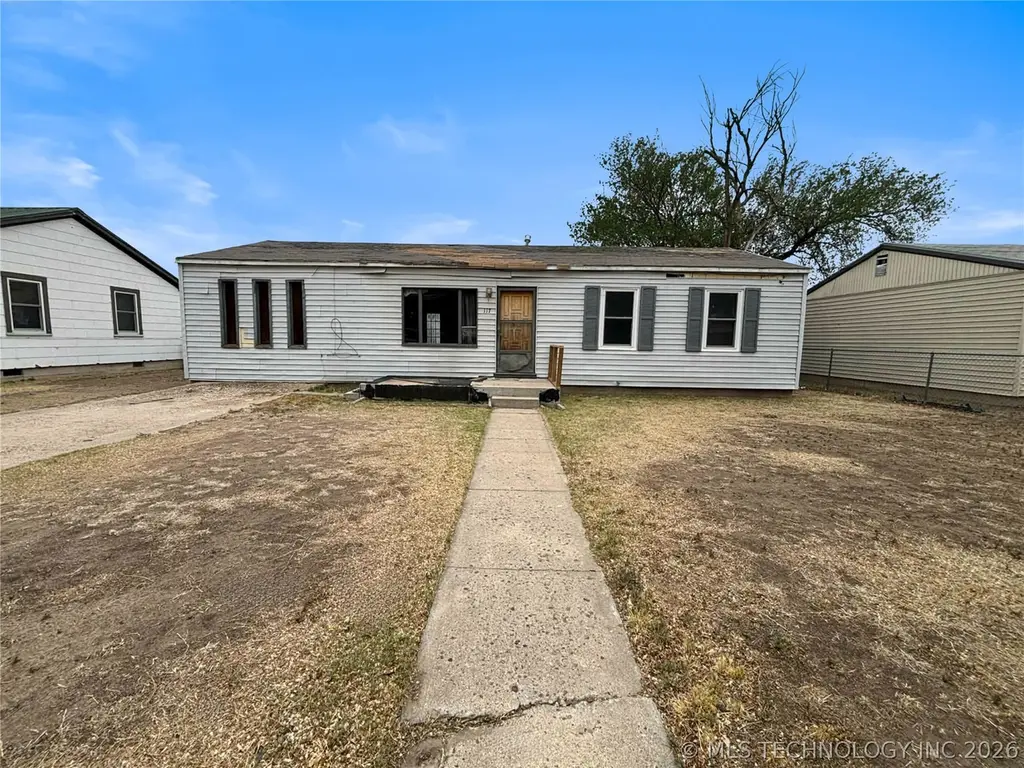
117 N East St · Guymon, OK
Flood risk 4/10 · Minor
- FEMA flood zone
- X (unshaded)
- Chance of flooding over 30 yrs
- 0.2%
- Est. flood insurance / yr
- $507 – $1,088
Fire risk 5/10 · Moderate
- Est. fire insurance / yr
- $2,463 – $4,575
Heat risk 5/10 · Moderate
- Hot days now (above 101°F)
- 7 days/yr
- Hot days in 30 yrs
- 20 days/yr
Wind risk 2/10 · Minimal
- Chance of severe wind over 30 yrs
- —
Air-quality risk 2/10 · Minimal
- Unhealthy air days now
- 1 days/yr
- Unhealthy air days in 30 yrs
- 1 days/yr
Risk factors via First Street. Map © Google.
Why this score? — see what drove the B- grade
The composite is a weighted blend of 9 inputs, each scored 0–100. Each bar is that input's sub-score; the figure is the points it added to the 100-point composite (weight × sub-score).
- Cash flow +30.0/30.0
- 1% rule +10.0/10.0
- DSCR +10.0/10.0
- ARV discount +7.5/15.0
- Livability +3.7/5.0
- Rent growth +2.5/5.0
- Condition / age +2.5/5.0
- Schools +1.9/10.0
- Appreciation +0.0/10.0
$65,000
🖨 Deal sheet (PDF) 📄 Offer letter ✓ Due diligence
Listing remarks
Charming Bungalow on a Large Lot-Full of Potential! This 3 bedrooms, 1 bath home offers comfortable living space and in a quiet small town setting. With plenty of room to spread out, this property is full of potential for a first time buyer, investor, or anyone looking to add their personal touch. The home features a spacious layout, a relaxing back deck that's perfect for enjoying the outdoors, and a small shop that's ideal for storage, hobbies, or projects. The lot provides ample space for gardening, entertaining, or future expansions. If you're looking for a property with character, space, and opportunity in a peaceful small town, this one is worth a look. Schedule your showing today and
Key facts
- Large lot
- Back deck
- Ample space
Tags
Property features AI
Exterior
- Security: No safety shelter
- Utilities: Public water; Public sewer
- Home design: Single-story; Faces west; Crawlspace foundation
- Construction: Vinyl siding; Wood siding; Wood frame construction; Asphalt/fiberglass roof
- Exterior features: Deck; Porch; Storage structure; Chain link fencing
Interior
- Kitchen: Gas range connection; Gas oven connection; Laminate counters
- Flooring: Carpet; Laminate; Plywood
- Bathrooms: 1 full bathroom
- Heating & cooling: Central heating; Electric heating available; Gas heating available
- Interior features: Aluminum-framed and vinyl windows; Laminate countertops; Gas range and gas oven connections; No additional interior amenities listed
- Laundry & utility: Washer hookup; Electric dryer hookup; Electric and gas water heaters
Neighborhood map
What this means for you Summary
Snapshot
- This is a 3-bed/1.0-bath single-family listed at $65k.
Deal economics
- At list price, monthly cash flow is $472 ($6k/yr) — positive.
- The deal already cash-flows at list — no discount required.
- Meets the 1% rule at list price ($1k rent vs $65k).
- Recommended offer: $64k (1.5% below list) — sets the bar for market timing.
- Cap rate 15.0% vs local median 3.3% in Guymon — top-decile yield for the area; either an underpriced asset or a hidden risk that comps aren't pricing in. Stress-test before assuming the spread holds.
Location & tenants
- Location reads 74/100 on livability (#14 in OK, #4,559 nationally) — a middle-class / working-renter tenant base. Strengths: cost of living A+, housing A+, health & safety A+; Watch: amenities F, commute F.
- Guymon (town): math 24% / reading 18% proficiency, ranked #153 of 270 in OK (top 57%) — low school quality limits family demand, transient renter base, plan for 1-2y turnover; 65% free/reduced lunch — lower-income household profile, screen leases tightly.
- Zoned schools: Prairie Es (471 students, 0% FRL); Central Jhs (math 14% / reading 10%, grade F, #269 of 345 statewide, top 79%, 438 students, 0% FRL); Guymon Hs (math 12% / reading 17%, grade F, #348 of 447 statewide, top 79%, 827 students, 0% FRL) — zoned schools average 0% FRL vs 65% district-wide (65 pts lower); this property's tenant base skews higher-income than the district average.
- Market conditions: 45 active listings in the ZIP; 4 units permitted in Texas County in 2024 (0 in 5+ unit buildings).
Forward outlook
- Local home prices are declining (-3.0%/yr); year-one equity from $449 of loan paydown is wiped out by about $2k of value loss. Plan a longer hold.
- Texas County population projected at +21% by 2050 — long-run rental-demand tailwind backs the buy-and-hold thesis.
- At projected returns (-3.0% appreciation + 3.0% rent growth), your $18k cash investment doubles in ~4 years — after that, you're playing with house money.
Negotiation context
- It's been on market 16 days — a 2% lower offer ($64k) is reasonable based on typical stale-listing flexibility.
Risks & watch-outs
- Watch-outs: built in 1958 — expect roof / HVAC / electrical / plumbing capex.
- Climate carrying-cost: moderate wildfire risk; extreme-heat days projected 7→20/yr by 2055 (HVAC capex compounding) — expect insurance premiums to compound above CPI over the hold.
Questions for the listing agent
- Built in 1958 — when were the roof, HVAC, electrical panel, plumbing, and water heater last replaced?
- Is there a deadline driving the sale (1031 exchange, divorce, estate, relocation)? That informs how much negotiation room exists.
- Schools are F-rated, which usually means shorter tenancies and higher turnover. Who's the typical renter profile here, and what's been the actual vacancy rate?
- What's the average days-on-market for RENTAL listings here right now (not sales)? A rising rental-DOM trend means longer vacancies and softer asking-rent achievability than the comps imply.
- What's the recent tenant-quality profile in this submarket — average credit score on applications, eviction rate, late-payment / NSF rate, and stable-employment percentage? A property-management company in the area should have these aggregated.
- How much new for-sale + rental construction is in the pipeline within 1–3 miles? Heavy new supply typically softens prices + rents 12–24 months out; constrained supply supports both.
Investment metrics
- 1% rule
- 1.73% ✓
- Cap rate
- 15.00%
- Cash-on-cash
- 31.10%
- DSCR
- 2.38
- GRM
- 4.8
CMA / ARV
- ARV (on-the-fly)
- $165,104
- Comps found
- 3
Show comp detail 3 sales within ~0.75 mi
| Address | Dist | Beds/Ba | Sqft | Sold | Price | $/sf | Match |
|---|---|---|---|---|---|---|---|
| 210 N Perkins | 0.26mi | 3/1.5 | 1,182 (-3%) | 18mo | $165,000 | $140 | 67 |
| 215 N Beaver St | 0.74mi | 3/1.0 | 1,203 (-1%) | 15mo | $154,000 | $128 | 51 |
| 309 N Beaver St | 0.75mi | 3/1.0 | 1,064 (-12%) | 24mo | $145,000 | $136 | 25 |
Match score weights: distance 35% · size 25% · config 20% · recency 20%. Top-matched comps best support the ARV.
Projected returns pro-forma
-3.0% appreciation · 3.0% rent growth · sell at horizon
- IRR
- 25.9%
- Equity multiple
- 2.07×
- Total profit
- $19,511
- Equity at exit
- $9,692
- IRR
- 33.6%
- Equity multiple
- 4.06×
- Total profit
- $55,668
- Equity at exit
- $5,620
Cash invested: $18,200 (down + closing). Projections, not guarantees.
Landlord ↔ Tenant lean methodology
- Overall (STATE)
- 83 Strongly Landlord-Friendly
- State Oklahoma
- 83 Strongly Landlord-Friendly · R+20
- County
- — inherits STATE
- City
- — inherits STATE
ZIP-level market 73942
- Active inventory
- 45
- Price-to-rent
- 4.8×
Monthly cashflow live
- Estimated rent
- $1,125 medium interval (Pro) →
- Mortgage (P&I)
- −$341
- Tax from tax record
- −$49 /mo · $592/yr
- Insurance
- −$27
- HOA
- −$0
- Vacancy / Maint / Mgmt
- −$236
- Net cashflow
- $472
Break-even live
Sensitivity live
| Price | -10% $509 | -5% $490 | +0% $472 | +5% $453 | +10% $435 |
|---|---|---|---|---|---|
| Rent | -10% $383 | -5% $427 | +0% $472 | +5% $516 | +10% $561 |
| Rate | -1.0pp $504 | -0.5pp $488 | base $472 | +0.5pp $455 | +1.0pp $438 |
UW: 25.0% down · 7.5% · 30yr · 1.5% tax · 5.0% vac · 8.0% maint · 8.0% mgmt
Financing live
Cash to close
- Down payment
- $16,250
- Closing costs
- $1,950
- Reserves months
- —
- Total cash needed
- —
Loan-product check · same deal, 3 products live
Conventional
25% down · 7.5% · 30yr
- Down + closing
- —
- Monthly P&I
- —
- Monthly cashflow
- —
- DSCR
- —
- Eligible?
- —
Personal DTI + credit; lowest rate.
DSCR
20% down · 8.5% · 30yr
- Down + closing
- —
- Monthly P&I
- —
- Monthly cashflow
- —
- DSCR
- —
- Eligible?
- —
No personal income docs; deal must DSCR.
Hard money
10% down · 12.0% · 12mo
- Down + closing
- —
- Monthly P&I
- —
- Monthly cashflow
- —
- DSCR
- —
- Eligible?
- —
Short-term bridge; refi at stabilization.
Listing history 12 events
-
2026-06-15statusdays on market $65,000 Pending 16 DOM
-
2026-06-13days on market $65,000 Active 15 DOM
-
2026-06-12days on market $65,000 Active 14 DOM
-
2026-06-09days on market $65,000 Active 11 DOM
-
2026-06-08days on market $65,000 Active 10 DOM
-
2026-06-08days on market $65,000 Active 9 DOM
-
2026-06-07days on market $65,000 Active 8 DOM
-
2026-06-04days on market $65,000 Active 5 DOM
-
2026-06-02days on market $65,000 Active 4 DOM
-
2026-06-01days on market $65,000 Active 3 DOM
-
2026-05-31days on market $65,000 Active 2 DOM
-
2026-05-28$65,000 Active
ⓘ Source: listings_history table (triggers on properties + properties_extension) + one-shot
backfill from property_details.listing_events for pre-trigger history.
Tax reassessment forecast OK · Resets to sale price
- Current annual tax
- $592 · $49/mo
- Projected year-2 tax
- $592 · $49/mo
- Expected delta
- $0/yr ($0/mo · 0.0%)
ⓘ Screening estimate from a state-policy table — verify with the county assessor before closing.
Climate risk First Street
- Flood 4/10 Moderate FEMA zone X (unshaded) · 20% chance over 30 yrs
- Wildfire 5/10 Major
- Heat 5/10 Major 7 d/yr ≥101°F today · 20 d/yr by 30 yrs out
- Wind 2/10 Low
- Air quality 2/10 Low 1 unhealthy d/yr today · 1 by 30 yrs out
Nearby sold comps map
Loading sold comps map…
Walkable amenities ~0.75 mi
Loading nearby amenities…
Taxation est. · year 1
- Rental income
- $13,504
- − Mortgage interest
- −$3,641
- − Property taxes
- −$592
- − Insurance
- −$325
- − Repairs & maintenance
- −$1,080
- − Management
- −$1,080
- − Depreciation
- −$1,891
- Taxable income
- $4,895
- Est. tax owed @ 24.0%
- −$1,175
- After-tax cash flow
- $4,486/yr
For passive investors: Depreciation is non-cash, so a rental often shows a tax loss while cash-flowing — sheltering income. Rental losses are passive: they offset passive income freely, and up to $25,000/yr can offset ordinary (W-2) income if you actively participate and your MAGI is under $100k (phasing out to $0 by $150k); unused losses carry forward. On sale, claimed depreciation is recaptured at up to 25%, and gains may owe capital-gains tax (a 1031 exchange can defer both). Figures are a year-1 estimate at your 24.0% rate — not tax advice; consult a CPA.
Schools (NCES district)
- District
- Guymon
- NCES district ID
- 4013590
- Math proficiency
- 24% ▼ -3.00%
- Reading proficiency
- 18% ▼ -6.00%
- Median HH income
- $48,487
- Composite
- 18.63/100
- National rank
- #8894
- State rank
- #153 of 270 in OK
Livability — Guymon
- Score
- 74/100
- State rank
- #14
- US rank
- #4559
Category grades
Schools grade is shown separately in the Schools card above.
Census & demographics
- Census place
- Guymon, OK
- Population (ZIP)
- 13,659
Population outlook (Texas County) Hauer SSP2
- Today (2025)
- 22,936 people
- By 2030
- 23,733 · +3.5%
- By 2040
- 25,578 · +11.5%
- By 2050
- 27,732 · +20.9%
- By 2075
- 32,511 · +41.7%
- By 2100
- 35,649 · +55.4%
Race, ethnicity, and origin ACS 2023
- Neighborhood character
- Diverse neighborhood (Simpson 0.57)
- Race & ethnicity
- Hispanic / Latino 58% White 31% Two or more races 21% Black 6% Native American 5% Asian 2%
- Hispanic origin (detail)
- Mexican 42%
- Common ancestry
- Slovak 1% Lithuanian 1% Iranian 1%
- Foreign-born
- 28% · Canada
- Languages at home
- 51% English-only · Spanish 42% Tagalog/Filipino 2% Arabic 1%
Political lean MEDSL · Texas
- 2024 margin
- Solid R (+67.7) · D 15.2% · R 83.0% · Other 1.8%
- 2008→2024 swing
- +2.8pp toward D · 2008: -70.5pp · 2024: -67.7pp
- All cycles
- 2024: R+67.7 2020: R+65.4 2016: R+65.2 2012: R+70.4 2008: R+70.5
Not yet ingested
- Civics
- —
Market trends
- HPI YoY
- ▼ -133.70%
- Current HPI
- 150.7505
- Rent YoY
- —
- Metro
- —
- State GDP YoY
- ▲ 1.55%
- F500 in state
- 6
Industry mix (Fortune 500 HQ in OK)
| Industry | F500 HQs | Revenue |
|---|---|---|
| Energy | 3 | $48B |
|
||
Price history
1 event — show timeline
- 2026-05-28 Listed $65,000 MLS Technology, Inc.
Property tax history
+8.9%/yrLatest (2025): $592 · +11.1% YoY. Source: county tax records.
Cash-flow waterfall
monthlySold comps — $/sqft
last 12 mo · ≤1 miLoading sold comps…