906 Center Point Rd Rd NE · Cedar Rapids, IA
Flood risk 1/10 · Minimal
- FEMA flood zone
- X (unshaded)
- Chance of flooding over 30 yrs
- 0.0%
- Est. flood insurance / yr
- $473 – $860
Fire risk 1/10 · Minimal
- Est. fire insurance / yr
- $902 – $1,676
Heat risk 3/10 · Minor
- Hot days now (above 104°F)
- 7 days/yr
- Hot days in 30 yrs
- 15 days/yr
Wind risk 2/10 · Minimal
- Chance of severe wind over 30 yrs
- —
Air-quality risk 2/10 · Minimal
- Unhealthy air days now
- 0 days/yr
- Unhealthy air days in 30 yrs
- 1 days/yr
Risk factors via First Street. Map © Google.
Why this score? — see what drove the D+ grade
The composite is a weighted blend of 9 inputs, each scored 0–100. Each bar is that input's sub-score; the figure is the points it added to the 100-point composite (weight × sub-score).
- Cash flow +18.0/30.0
- DSCR +5.6/10.0
- Rent growth +5.0/5.0
- Schools +4.7/10.0
- ARV discount +4.3/15.0
- 1% rule +4.2/10.0
- Livability +3.9/5.0
- Condition / age +2.5/5.0
- Appreciation +0.0/10.0
$135,000
🖨 Deal sheet 📄 Offer letter ✓ Due diligence
Listing remarks MLS
BRING YOUR HAMMER AND PAINT BRUSH TO THIS AFFORDABLE, CUTE AND COZY 2 BEDROOM HOME THAT OFFERS A FULL BASEMENT. THIS HOME HAS A LOT OF POSSIBILITIES. WHETHER YOU ARE JUST STARTING OUT, DOWNSIZING OR LOOKING FOR A RENTAL THIS COULD BE YOUR HOME. LARGE FENCED BACK YARD WITH FIREPIT. CONVENIENTLY LOCATED WITH EASY ACCESS TO I- 380, DANIELS PARK AND MCCLOUD'S RUN. HUD CASE # 161-271813. HUD HOMES ARE SOLD "AS_IS". SELLER DOES RECOMMEND A HOME INSPECTION. ALL OFFERS ARE SUBMITTED ONLINE AT www. HUDHOMESTORE.com PLEASE VISIT www. MMREM.com AND www. HUDHOMESTORE.com FOR ADDITIONAL INFORMATION INCLUDING ATTACHMENTS, DISCLOSURES AND CONTRACT PACKAGES. BUYER WILL NOT RECEIVE A KEY AT CLOSING, AND WILL BE RESPONSIBLE FOR CHANGING THE LOCKS AT THEIR EXPENSE.
Key facts
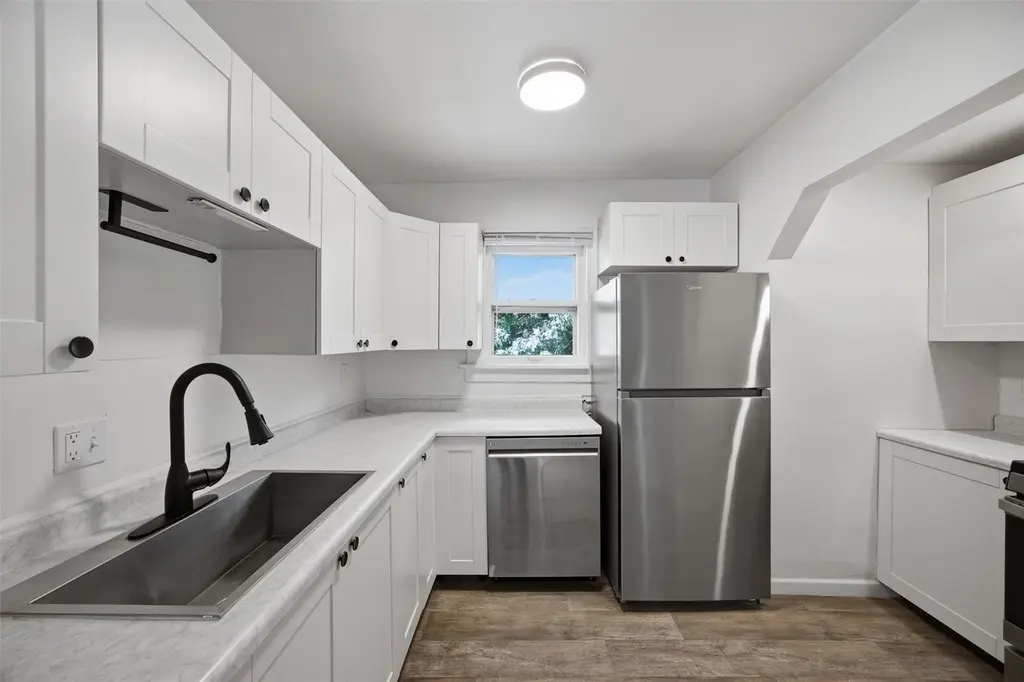
- Modern kitchen
- Fenced backyard
- Convenient parking
Tags
Property features AI
Exterior
- Parking: Off-street parking
- Utilities: Public water; Public sewer
- Home design: Single-family residence; Residential property
- Construction: Aluminum siding and frame construction; Block foundation
- Exterior features: Fenced yard
Interior
- Kitchen: Dishwasher, Microwave, Range, Refrigerator
- Bathrooms: 1 full bathroom
- Heating & cooling: Central air conditioning; Natural gas forced-air heating
- Interior features: Dryer, Washer, Dishwasher, Microwave, Range, Refrigerator; Has basement; 6 total rooms
- Laundry & utility: Washer and Dryer
Neighborhood map
What this means for you Summary
Snapshot
- This is a 2-bed/1.0-bath single-family listed at $135k.
Deal economics
- At list price, monthly cash flow is $116 ($1k/yr) — positive.
- The deal already cash-flows at list — no discount required.
- To meet the 1% rule (rent ≥ 1% of price), the offer needs to be $124k (8.4% below list).
- Recommended offer: $124k (8.4% below list) — sets the bar for 1% rule.
- Cap rate 7.3% vs local median 3.5% in Cedar Rapids — top-decile yield for the area; either an underpriced asset or a hidden risk that comps aren't pricing in. Stress-test before assuming the spread holds.
Location & tenants
- Location reads 78/100 on livability (#134 in IA, #2,474 nationally) — a middle-class / working-renter tenant base. Strengths: cost of living A+, housing A+, health & safety A+; Watch: crime C-, commute F.
- Cedar Rapids Community School District (urban): math 50% / reading 59% proficiency, ranked #265 of 289 in IA (top 92%) — acceptable for families but not a draw, mixed tenant base, ~2y average lease.
- Zoned schools: Franklin Middle School (math 49% / reading 59%, grade B-, #206 of 246 statewide, top 84%, 537 students, 56% FRL); George Washington High School (math 44% / reading 62%, grade C-, #296 of 336 statewide, top 88%, 1,291 students, 49% FRL).
- Market conditions: Rents rising fast (+11.0%/yr); 286 active listings in the ZIP; 3 comparable units currently listed for rent nearby; rentals lingering (median 44d on market — plan ~5-8 weeks vacancy on turnover, expect pricing pressure); 67% of comp listings sitting > 30 days — soft ceiling on asking rent; 1,023 units permitted in Linn County in 2024 (456 in 5+ unit buildings).
Forward outlook
- Local home prices are declining (-3.0%/yr); year-one equity from $933 of loan paydown is wiped out by about $4k of value loss. Plan a longer hold.
- Linn County population projected at +16% by 2050 — long-run rental-demand tailwind backs the buy-and-hold thesis.
- At projected returns (-3.0% appreciation + 8.0% rent growth), your $38k cash investment doubles in ~10 years — after that, you're playing with house money.
Negotiation context
- Only 1 days on market — expect competitive offers; lowballing is unlikely to land.
- 2 sale attempts since 11y ago with the ask held roughly flat each time — persistent listings suggest the price (not the market) is what's stuck; bring a comps-based counter.
- Current owner paid $55k; list at $135k implies a 145% gain — meaningful room to come down on a strong offer.
Risks & watch-outs
- Watch-outs: built in 1922 — expect roof / HVAC / electrical / plumbing capex.
Questions for the listing agent
- Built in 1922 — when were the roof, HVAC, electrical panel, plumbing, and water heater last replaced?
- Is there a deadline driving the sale (1031 exchange, divorce, estate, relocation)? That informs how much negotiation room exists.
- Schools are B-rated — typically a magnet for longer-tenancy family renters. What's the average tenant stay here, and is there a school-zone premium baked into asking?
- The area grade is low — what's the realistic commute time and amenity access for the typical tenant pool here? Any planned neighborhood developments (good or bad) we should know about?
- What's the average days-on-market for RENTAL listings here right now (not sales)? A rising rental-DOM trend means longer vacancies and softer asking-rent achievability than the comps imply.
- What's the recent tenant-quality profile in this submarket — average credit score on applications, eviction rate, late-payment / NSF rate, and stable-employment percentage? A property-management company in the area should have these aggregated.
- How much new for-sale + rental construction is in the pipeline within 1–3 miles? Heavy new supply typically softens prices + rents 12–24 months out; constrained supply supports both.
Investment metrics
- 1% rule
- 0.92% ✗
- Cap rate
- 7.32%
- Cash-on-cash
- 3.68%
- DSCR
- 1.16
- GRM
- 9.1
CMA / ARV
- ARV (on-the-fly)
- $126,000
- Comps found
- 12
Show comp detail 12 sales within ~0.75 mi
| Address | Dist | Beds/Ba | Sqft | Sold | Price | $/sf | Match |
|---|---|---|---|---|---|---|---|
| 923 Oakland Rd NE | 0.12mi | 2/1.0 | 836 (-0%) | 2mo | $4,201 | $5 | 92 |
| 915 Center Point Rd NE | 0.03mi | 3/1.0 (+1) | 784 (-7%) | 0mo | $135,000 | $172 | 82 |
| 1158 Brown Ave NE | 0.14mi | 2/1.5 | 819 (-2%) | 10mo | $119,000 | $145 | 79 |
| 1051 12th St St NE | 0.23mi | 2/1.0 | 816 (-3%) | 7mo | $43,500 | $53 | 78 |
| 1522 J Ave NE | 0.40mi | 2/1.0 | 852 (+1%) | 6mo | $127,500 | $150 | 74 |
| 1228 Oakland Rd Rd NE | 0.42mi | 2/1.0 | 816 (-3%) | 4mo | $120,000 | $147 | 73 |
| 910 Maplewood Dr Dr NE | 0.28mi | 2/1.0 | 780 (-7%) | 6mo | $128,000 | $164 | 70 |
| 813 Oakland Rd NE | 0.23mi | 2/1.0 | 734 (-13%) | 2mo | $157,700 | $215 | 67 |
| 1613 I Ave | 0.36mi | 2/1.0 | 748 (-11%) | 4mo | $100,000 | $134 | 62 |
| 1612 Greene Ave NE | 0.39mi | 2/1.0 | 748 (-11%) | 11mo | $138,000 | $184 | 54 |
| 1815 E Ave Ave NE | 0.62mi | 2/1.0 | 736 (-12%) | 5mo | $75,000 | $102 | 46 |
| 512 19th St St NE | 0.75mi | 2/1.0 | 960 (+14%) | 0mo | $174,900 | $182 | 41 |
Match score weights: distance 35% · size 25% · config 20% · recency 20%. Top-matched comps best support the ARV.
Projected returns pro-forma
-3.0% appreciation · 8.0% rent growth · sell at horizon
- IRR
- -5.4%
- Equity multiple
- 0.79×
- Total profit
- $-7,991
- Equity at exit
- $20,129
- IRR
- 9.1%
- Equity multiple
- 1.85×
- Total profit
- $32,167
- Equity at exit
- $11,672
Cash invested: $37,800 (down + closing). Projections, not guarantees.
Landlord ↔ Tenant lean methodology
- Overall (STATE)
- 83 Strongly Landlord-Friendly
- State Iowa
- 83 Strongly Landlord-Friendly · R+6
- County
- — inherits STATE
- City
- — inherits STATE
ZIP-level market 52402
- Rents YoY
- 11.0%
- Active inventory
- 286
- Price-to-rent
- 9.1×
Monthly cashflow live
- Estimated rent
- $1,236 medium interval (Pro) →
- Mortgage (P&I)
- −$708
- Tax from tax record
- −$96 /mo · $1,156/yr
- Insurance
- −$56
- HOA
- −$0
- Vacancy / Maint / Mgmt
- −$260
- Net cashflow
- $116
Break-even live
UW: 25.0% down · 7.5% · 30yr · 1.5% tax · 5.0% vac · 8.0% maint · 8.0% mgmt
Financing live
Cash to close
- Down payment
- $33,750
- Closing costs
- $4,050
- Reserves months
- —
- Total cash needed
- —
Loan-product check · same deal, 3 products live
Conventional
25% down · 7.5% · 30yr
- Down + closing
- —
- Monthly P&I
- —
- Monthly cashflow
- —
- DSCR
- —
- Eligible?
- —
Personal DTI + credit; lowest rate.
DSCR
20% down · 8.5% · 30yr
- Down + closing
- —
- Monthly P&I
- —
- Monthly cashflow
- —
- DSCR
- —
- Eligible?
- —
No personal income docs; deal must DSCR.
Hard money
10% down · 12.0% · 12mo
- Down + closing
- —
- Monthly P&I
- —
- Monthly cashflow
- —
- DSCR
- —
- Eligible?
- —
Short-term bridge; refi at stabilization.
Rent comps 3 comps
| Address | Beds | Baths | Sqft | Rent | $/sqft | DOM | Units | Dist |
|---|---|---|---|---|---|---|---|---|
| 1220 Sierra Dr NE Cedar Rapids, IA | 1.0–2.0 | 1.0–2.0 | 985 | $1,000 | $1.02 | 43d | 1 | 0.55mi |
| 511 23rd St NE Cedar Rapids, IA | 2.0 | 1.0 | 888 | $1,500 | $1.69 | 43d | 1 | 1.04mi |
| 906 10th St SE Cedar Rapids, IA | 1.0–2.0 | 1.0–2.0 | 890 | $1,300 | $1.46 | 13d | 6 | 1.40mi |
Listing history 3 events
-
2026-06-15status $135,000 Pending 1 DOM
-
2026-06-14remarks 634-char remark
-
2026-06-14$135,000 Active 1 DOM
ⓘ Source: listings_history table (triggers on properties + properties_extension) + one-shot
backfill from property_details.listing_events for pre-trigger history.
Tax reassessment forecast IA · Partial reset (capped growth)
- Current annual tax
- $1,156 · $96/mo
- Projected year-2 tax
- $1,638 · $136/mo
- Expected delta
- +$482/yr (+$40/mo · 41.7%)
ⓘ Screening estimate from a state-policy table — verify with the county assessor before closing.
Climate risk First Street
- Flood 1/10 Low FEMA zone X (unshaded) · 0% chance over 30 yrs
- Wildfire 1/10 Low
- Heat 3/10 Moderate 7 d/yr ≥104°F today · 15 d/yr by 30 yrs out
- Wind 2/10 Low
- Air quality 2/10 Low 0 unhealthy d/yr today · 1 by 30 yrs out
Nearby sold comps map
Loading sold comps map…
Walkable amenities ~0.75 mi
Loading nearby amenities…
Taxation est. · year 1
- Rental income
- $14,831
- − Mortgage interest
- −$7,562
- − Property taxes
- −$1,156
- − Insurance
- −$675
- − Repairs & maintenance
- −$1,187
- − Management
- −$1,187
- − Depreciation
- −$3,927
- Taxable loss
- −$862
- Est. tax savings @ 24.0%
- +$207
- After-tax cash flow
- $1,597/yr
For passive investors: Depreciation is non-cash, so a rental often shows a tax loss while cash-flowing — sheltering income. Rental losses are passive: they offset passive income freely, and up to $25,000/yr can offset ordinary (W-2) income if you actively participate and your MAGI is under $100k (phasing out to $0 by $150k); unused losses carry forward. On sale, claimed depreciation is recaptured at up to 25%, and gains may owe capital-gains tax (a 1031 exchange can defer both). Figures are a year-1 estimate at your 24.0% rate — not tax advice; consult a CPA.
Schools (NCES district)
- District
- Cedar Rapids Community School District
- NCES district ID
- 1906540
- Math proficiency
- 50% ▼ -12.00%
- Reading proficiency
- 59% ▼ -6.00%
- Median HH income
- $53,568
- Composite
- 46.82/100
- National rank
- #2378
- State rank
- #265 of 289 in IA
Livability — Cedar Rapids
- Score
- 78/100
- State rank
- #134
- US rank
- #2474
Category grades
Schools grade is shown separately in the Schools card above.
Census & demographics
- Census place
- Cedar Rapids, IA
- County
- Linn County · 179,860 people
- City population
- 137,154
- Metro
- Cedar Rapids, IA
- Population (ZIP)
- 42,938
- Household income
- $73,439
- Rent vs Own
- Severe rent burden
- 971.0
Population outlook (Linn County) Hauer SSP2
- Today (2025)
- 239,589 people
- By 2030
- 248,587 · +3.8%
- By 2040
- 264,817 · +10.5%
- By 2050
- 278,685 · +16.3%
- By 2075
- 311,754 · +30.1%
- By 2100
- 336,773 · +40.6%
Race, ethnicity, and origin ACS 2023
- Neighborhood character
- Predominantly White (77%)
- Race & ethnicity
- White 77% Two or more races 7% Black 6% Asian 6% Hispanic / Latino 4%
- Common ancestry
- Portuguese 4% Lithuanian 2% Iranian 2%
- Foreign-born
- 8% · Canada, Philippines, China
- Languages at home
- 89% English-only · Spanish 3% Other Indo-European 3% Other Asian/Pacific 2%
Political lean MEDSL · Linn
- 2024 margin
- Lean D (+9.9) · D 54.2% · R 44.3% · Other 1.4%
- 2008→2024 swing
- -11.6pp toward R · 2008: 21.5pp · 2024: 9.9pp
- All cycles
- 2024: D+9.9 2020: D+13.7 2016: D+9.0 2012: D+17.6 2008: D+21.5
Not yet ingested
- Civics
- —
Market trends
- HPI YoY
- ▼ -133.31%
- Current HPI
- 201.7061
- Rent YoY
- ▲ 10.97%
- Metro
- Cedar Rapids, IA
- State GDP YoY
- ▲ 2.48%
- F500 in state
- 4
Industry mix (Fortune 500 HQ in IA)
| Industry | F500 HQs | Revenue |
|---|---|---|
| Financial Services | 1 | $16B |
|
||
| Retail / Convenience | 1 | $15B |
|
||
Price history
+134.8% since first listed5 events — show timeline
- 2026-06-13 Listed $135,000 CRAAR, CDRMLS
- 2023-12-04 Sold (Public Records) $55,000 Public Records
- 2015-12-04 Sold (MLS) $24,500 CRAAR, CDRMLS
- 2015-04-22 Listed $28,600 CRAAR, CDRMLS
- 2004-11-17 Sold (Public Records) $57,500 Public Records
Property tax history
-1.3%/yrLatest (2025): $1,156 · -17.7% YoY. Source: county tax records.
Cash-flow waterfall
monthlySold comps — $/sqft
last 12 mo · ≤1 miLoading sold comps…