 🏗️ New Construction
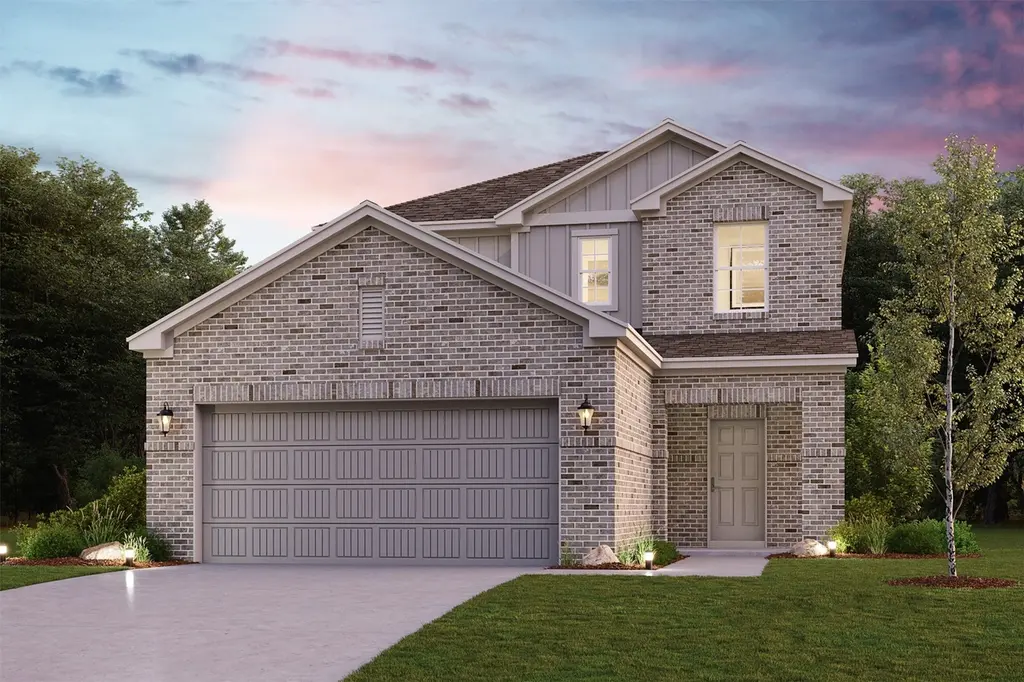
4018 Bay Ct · Brookshire, TX
Flood risk 1/10 · Minimal
- FEMA flood zone
- X (unshaded)
- Chance of flooding over 30 yrs
- 0.0%
- Est. flood insurance / yr
- $507 – $1,088
Fire risk 5/10 · Moderate
- Est. fire insurance / yr
- $1,222 – $2,270
Heat risk 8/10 · Major
- Hot days now (above 111°F)
- 7 days/yr
- Hot days in 30 yrs
- 22 days/yr
Wind risk 9/10 · Severe
- Chance of severe wind over 30 yrs
- 99.0%
Air-quality risk 2/10 · Minimal
- Unhealthy air days now
- 1 days/yr
- Unhealthy air days in 30 yrs
- 1 days/yr
Risk factors via First Street. Map © Google.
Why this score? — see what drove the C grade
The composite is a weighted blend of 9 inputs, each scored 0–100. Each bar is that input's sub-score; the figure is the points it added to the 100-point composite (weight × sub-score).
- Cash flow +24.5/30.0
- DSCR +7.9/10.0
- ARV discount +7.5/15.0
- 1% rule +5.5/10.0
- Schools +4.6/10.0
- Livability +3.1/5.0
- Condition / age +2.5/5.0
- Rent growth +2.2/5.0
- Appreciation +0.0/10.0
$320,900
🖨 Deal sheet (PDF) 📄 Offer letter ✓ Due diligence
Listing remarks MLS
The Hampton two-story home is an open-concept floor plan featuring the primary suite privately situated on the first floor, while the secondary bedrooms are on the second floor. The gourmet island kitchen overlooks the great room and the dining room, creating a spacious entertaining area. And the upstairs gameroom offers a secondary entertainment space for the home.
Key facts
- Primary suite
- Dining room
- Upstairs game room
Tags
Property features AI
Finance
- Other: Builder: Century Communities
- HOA & community: Community Solutions association; Annual association fee of $750
Exterior
- Parking: Attached 2-car garage
- Utilities: Public water; Public sewer
- Home design: Residential property; Under construction (new construction); Slab foundation
- Construction: Built in 2026; Brick construction; Composition roof
- Exterior features: Private yard; Subdivision setting
Interior
- Kitchen: Dishwasher; Gas oven; Gas range; Microwave
- Bedrooms: Total rooms: 5
- Bathrooms: Two full bathrooms; One half bathroom
- Heating & cooling: Central heating (gas); Central electric air conditioning
- Interior features: Kitchen island; Kitchen/family room combo; Primary bedroom with private bath; Quartz countertops; Separate shower and tub/shower combination; Ceiling fans; Programmable thermostat; Low emissivity windows
- Laundry & utility: Washer hookup; Electric dryer hookup; Tankless water heater
Neighborhood map
What this means for you Summary
Snapshot
- This is a 4-bed/2.5-bath land listed at $321k.
Deal economics
- At list price, monthly cash flow is $619 ($7k/yr) — positive.
- The deal already cash-flows at list — no discount required.
- To meet the 1% rule (rent ≥ 1% of price), the offer needs to be $316k (1.7% below list).
- Recommended offer: $311k (3.0% below list) — sets the bar for market timing.
- Cap rate 8.8% vs local median 5.9% in Brookshire — top-decile yield for the area; either an underpriced asset or a hidden risk that comps aren't pricing in. Stress-test before assuming the spread holds.
Location & tenants
- Location reads 62/100 on livability (#960 in TX) — a middle-class / working-renter tenant base. Strengths: cost of living A+, housing A+; Watch: crime D-, amenities F, commute F.
- Lamar CISD (suburban): math 50% / reading 53% proficiency, ranked #116 of 826 in TX (top 14%) — acceptable for families but not a draw, mixed tenant base, ~2y average lease.
- Zoned schools: Dean Leaman J H School (math 59% / reading 56%, grade B, #206 of 1,662 statewide, top 13%, 2,191 students, 32% FRL); Fulshear H S (math 52% / reading 70%, grade C+, #258 of 1,632 statewide, top 16%, 2,464 students, 30% FRL).
- Market conditions: Rents soft (-1.0%/yr); 1014 active listings in the ZIP; 2 comparable units currently listed for rent nearby; solid renter incomes; 12,093 units permitted in Fort Bend County in 2024 (815 in 5+ unit buildings).
- This rent runs 45% of the median local income ($84k/yr) — at the standard rent-burdened threshold; future hikes will face affordability resistance.
Forward outlook
- Local home prices are declining (-3.0%/yr); year-one equity from $2k of loan paydown is wiped out by about $9k of value loss. Plan a longer hold.
- Fort Bend County population projected at +75% by 2050 — long-run rental-demand tailwind backs the buy-and-hold thesis.
Negotiation context
- It's been on market 40 days — a 3% lower offer ($311k) is reasonable based on typical stale-listing flexibility.
- 2 sale attempts with the ask held roughly flat each time — persistent listings suggest the price (not the market) is what's stuck; bring a comps-based counter.
Risks & watch-outs
- Climate carrying-cost: severe wind risk, 99% chance of damaging wind over 30y; moderate wildfire risk; extreme-heat days projected 7→22/yr by 2055 (HVAC capex compounding) — expect insurance premiums to compound above CPI over the hold.
Questions for the listing agent
- It's been on market 40 days. Have you received any prior offers? Is the seller open to a 3% concession, seller financing, or rate buy-down credit?
- What does the HOA fee cover, when was the last increase, and are there any pending special assessments or reserve-fund shortfalls?
- Is there a deadline driving the sale (1031 exchange, divorce, estate, relocation)? That informs how much negotiation room exists.
- Schools are F-rated, which usually means shorter tenancies and higher turnover. Who's the typical renter profile here, and what's been the actual vacancy rate?
- Crime grade is D in this area — have there been break-ins, vandalism, or insurance claims at this property in the last 3 years? What carrier currently insures it and at what premium?
- What's the average days-on-market for RENTAL listings here right now (not sales)? A rising rental-DOM trend means longer vacancies and softer asking-rent achievability than the comps imply.
- What's the recent tenant-quality profile in this submarket — average credit score on applications, eviction rate, late-payment / NSF rate, and stable-employment percentage? A property-management company in the area should have these aggregated.
- How much new for-sale + rental construction is in the pipeline within 1–3 miles? Heavy new supply typically softens prices + rents 12–24 months out; constrained supply supports both.
Investment metrics
- 1% rule
- 1.05% ✓
- Cap rate
- 8.76%
- Cash-on-cash
- 8.80%
- DSCR
- 1.39
- GRM
- 8.0
CMA / ARV
- ARV (median comp)
- $301,470
- List price
- $320,900
- Delta
- 6.45%
- Verdict
- FAIR
- Comps
- 20 within 1.0 mi
Projected returns pro-forma
-3.0% appreciation · 0.0% rent growth · sell at horizon
- IRR
- -6.2%
- Equity multiple
- 0.78×
- Total profit
- $-18,771
- Equity at exit
- $44,950
- IRR
- -0.3%
- Equity multiple
- 0.98×
- Total profit
- $-1,669
- Equity at exit
- $26,066
Cash invested: $84,412 (down + closing). Projections, not guarantees.
Landlord ↔ Tenant lean methodology
- Overall (STATE)
- 87 Strongly Landlord-Friendly
- State Texas
- 87 Strongly Landlord-Friendly · R+5
- County
- — inherits STATE
- City
- — inherits STATE
ZIP-level market 77423
- Rents YoY
- -1.0%
- Active inventory
- 1014
- Price-to-rent
- 8.5×
Monthly cashflow live
- Estimated rent
- $3,156 medium interval (Pro) →
- Mortgage (P&I)
- −$1,581
- Tax from tax record
- −$105 /mo · $1,258/yr
- Insurance
- −$126
- HOA
- −$63
- Vacancy / Maint / Mgmt
- −$663
- Net cashflow
- $619
Break-even live
Sensitivity live
| Price | -10% $789 | -5% $704 | +0% $619 | +5% $533 | +10% $448 |
|---|---|---|---|---|---|
| Rent | -10% $369 | -5% $494 | +0% $619 | +5% $743 | +10% $868 |
| Rate | -1.0pp $771 | -0.5pp $695 | base $619 | +0.5pp $541 | +1.0pp $461 |
UW: 25.0% down · 7.5% · 30yr · 1.5% tax · 5.0% vac · 8.0% maint · 8.0% mgmt
Financing live
Cash to close
- Down payment
- $75,367
- Closing costs
- $9,044
- Reserves months
- —
- Total cash needed
- —
Loan-product check · same deal, 3 products live
Conventional
25% down · 7.5% · 30yr
- Down + closing
- —
- Monthly P&I
- —
- Monthly cashflow
- —
- DSCR
- —
- Eligible?
- —
Personal DTI + credit; lowest rate.
DSCR
20% down · 8.5% · 30yr
- Down + closing
- —
- Monthly P&I
- —
- Monthly cashflow
- —
- DSCR
- —
- Eligible?
- —
No personal income docs; deal must DSCR.
Hard money
10% down · 12.0% · 12mo
- Down + closing
- —
- Monthly P&I
- —
- Monthly cashflow
- —
- DSCR
- —
- Eligible?
- —
Short-term bridge; refi at stabilization.
Rent comps 2 comps
| Address | Beds | Baths | Sqft | Rent | $/sqft | DOM | Units | Dist |
|---|---|---|---|---|---|---|---|---|
| 5222 Wyatt James Ln Brookshire, TX | 4.0 | 2.5 | 2487 | $3,250 | $1.31 | 13d | 1 | 0.84mi |
| 5462 Grand View Dr Unit 1568482P Pattison, TX | 5.0 | 3.5 | 2992 | $3,637 | $1.22 | 2d | 1 | 1.16mi |
HOA detail
- Monthly dues
- $63 · $756/yr
Listing history 18 events
-
2026-06-21days on market $320,900 Active 40 DOM
-
2026-06-18days on market $320,900 Active 37 DOM
-
2026-06-17days on market $320,900 Active 36 DOM
-
2026-06-16days on market $320,900 Active 35 DOM
-
2026-06-15days on market $320,900 Active 34 DOM
-
2026-06-13days on market $320,900 Active 32 DOM
-
2026-06-09days on market $320,900 Active 28 DOM
-
2026-06-08days on market $320,900 Active 27 DOM
-
2026-06-07days on market $320,900 Active 26 DOM
-
2026-06-04days on market $320,900 Active 23 DOM
-
2026-06-03days on market $320,900 Active 22 DOM
-
2026-06-02days on market $320,900 Active 21 DOM
-
2026-06-01days on market $320,900 Active 20 DOM
-
2026-05-31days on market $320,900 Active 19 DOM
-
2026-05-12$320,900 Active 457-char remark
-
2026-05-09price $320,900 368-char remark
Show marketing remark (368 chars)
The Hampton two-story home is an open-concept floor plan featuring the primary suite privately situated on the first floor, while the secondary bedrooms are on the second floor. The gourmet island kitchen overlooks the great room and the dining room, creating a spacious entertaining area. And the upstairs gameroom offers a secondary entertainment space for the home.
-
2026-05-08price $322,100 368-char remark
Show marketing remark (368 chars)
The Hampton two-story home is an open-concept floor plan featuring the primary suite privately situated on the first floor, while the secondary bedrooms are on the second floor. The gourmet island kitchen overlooks the great room and the dining room, creating a spacious entertaining area. And the upstairs gameroom offers a secondary entertainment space for the home.
-
2026-05-07$320,900 Active 368-char remark
Show marketing remark (368 chars)
The Hampton two-story home is an open-concept floor plan featuring the primary suite privately situated on the first floor, while the secondary bedrooms are on the second floor. The gourmet island kitchen overlooks the great room and the dining room, creating a spacious entertaining area. And the upstairs gameroom offers a secondary entertainment space for the home.
ⓘ Source: listings_history table (triggers on properties + properties_extension) + one-shot
backfill from property_details.listing_events for pre-trigger history.
Tax reassessment forecast TX · Resets to sale price
- Current annual tax
- $1,258 · $105/mo
- Projected year-2 tax
- $5,872 · $489/mo
- Expected delta
- +$4,615/yr (+$385/mo · 366.9%)
ⓘ Screening estimate from a state-policy table — verify with the county assessor before closing.
Climate risk First Street
- Flood 1/10 Low FEMA zone X (unshaded) · 0% chance over 30 yrs
- Wildfire 5/10 Major
- Heat 8/10 Severe 7 d/yr ≥111°F today · 22 d/yr by 30 yrs out
- Wind 9/10 Extreme 99% chance of damaging wind over 30 yrs
- Air quality 2/10 Low 1 unhealthy d/yr today · 1 by 30 yrs out
Nearby sold comps map
Loading sold comps map…
Walkable amenities ~0.75 mi
Loading nearby amenities…
Taxation est. · year 1
- Rental income
- $37,870
- − Mortgage interest
- −$16,887
- − Property taxes
- −$1,258
- − Insurance
- −$1,507
- − Repairs & maintenance
- −$3,030
- − Management
- −$3,030
- − HOA
- −$756
- − Depreciation
- −$8,770
- Taxable income
- $2,633
- Est. tax owed @ 24.0%
- −$632
- After-tax cash flow
- $6,793/yr
For passive investors: Depreciation is non-cash, so a rental often shows a tax loss while cash-flowing — sheltering income. Rental losses are passive: they offset passive income freely, and up to $25,000/yr can offset ordinary (W-2) income if you actively participate and your MAGI is under $100k (phasing out to $0 by $150k); unused losses carry forward. On sale, claimed depreciation is recaptured at up to 25%, and gains may owe capital-gains tax (a 1031 exchange can defer both). Figures are a year-1 estimate at your 24.0% rate — not tax advice; consult a CPA.
Schools (NCES district)
- District
- Lamar CISD
- NCES district ID
- 4826580
- Math proficiency
- 50% ▼ -12.00%
- Reading proficiency
- 53% ▼ -4.00%
- Median HH income
- $75,213
- Composite
- 46.43/100
- National rank
- #2452
- State rank
- #116 of 826 in TX
Livability — Brookshire
- Score
- 62/100
- State rank
- #960
- US rank
- #17059
Category grades
Schools grade is shown separately in the Schools card above.
Census & demographics
- County
- Waller County · 18,767 people
- Metro
- Houston-The Woodlands-Sugar Land, TX
- Population (ZIP)
- 18,767
- Household income
- $84,490
- Rent vs Own
- Severe rent burden
- 20.0
Population outlook (Fort Bend County) Hauer SSP2
- Today (2025)
- 1,004,526 people
- By 2030
- 1,153,104 · +14.8%
- By 2040
- 1,453,718 · +44.7%
- By 2050
- 1,753,781 · +74.6%
- By 2075
- 2,455,772 · +144.5%
- By 2100
- 2,930,528 · +191.7%
Race, ethnicity, and origin ACS 2023
- Neighborhood character
- Diverse neighborhood (Simpson 0.64)
- Race & ethnicity
- Hispanic / Latino 41% White 41% Black 14% Two or more races 13% Asian 2% Native American 1%
- Hispanic origin (detail)
- Mexican 30% Cuban 2%
- Common ancestry
- Lithuanian 2% Italian 2% Slovak 1%
- Foreign-born
- 17% · Canada, China, Dominican Republic
- Languages at home
- 65% English-only · Spanish 32% French/Haitian/Cajun 1% Other Indo-European 1%
Political lean MEDSL · Fort Bend
- 2024 margin
- Toss-up / Even · D 49.5% · R 47.9% · Other 2.6%
- 2008→2024 swing
- +4.0pp toward D · 2008: -2.4pp · 2024: 1.6pp
- All cycles
- 2024: D+1.6 2020: D+10.6 2016: D+6.6 2012: R+6.8 2008: R+2.4
Not yet ingested
- Civics
- —
Market trends
- HPI YoY
- ▼ -125.28%
- Current HPI
- 204.8709
- Rent YoY
- ▼ -1.01%
- Metro
- Houston-The Woodlands-Sugar Land, TX
- State GDP YoY
- ▲ 3.95%
- F500 in state
- 110
Industry mix (Fortune 500 HQ in TX)
| Industry | F500 HQs | Revenue |
|---|---|---|
| Energy | 16 | $1,198B |
|
||
| Technology | 5 | $198B |
|
||
| Engineering / Construction | 4 | $72B |
|
||
| Energy Services | 3 | $60B |
|
||
| Utilities | 3 | $41B |
|
||
| Healthcare | 2 | $330B |
|
||
Price history
+0.0% since first listed4 events — show timeline
- 2026-05-12 Listed $320,900 HARMLS
- 2026-05-09 Price Changed $320,900 Zillow
- 2026-05-08 Price Changed $322,100 Zillow
- 2026-05-07 Listed $320,900 Zillow
Cash-flow waterfall
monthlySold comps — $/sqft
last 12 mo · ≤1 miLoading sold comps…