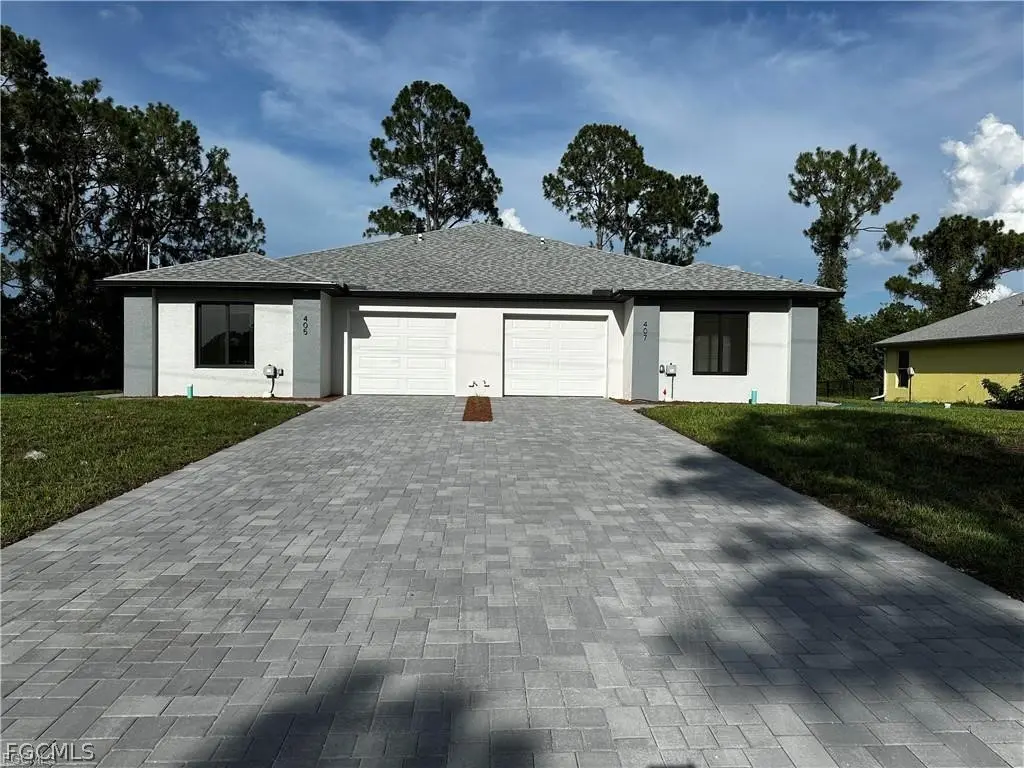
405-407 Chalet Ave S · Lehigh Acres, FL
Flood risk 1/10 · Minimal
- FEMA flood zone
- X (unshaded)
- Chance of flooding over 30 yrs
- 0.0%
- Est. flood insurance / yr
- $507 – $1,088
Fire risk 4/10 · Minor
- Est. fire insurance / yr
- $947 – $1,759
Heat risk 9/10 · Severe
- Hot days now (above 108°F)
- 7 days/yr
- Hot days in 30 yrs
- 27 days/yr
Wind risk 10/10 · Severe
- Chance of severe wind over 30 yrs
- 99.0%
Air-quality risk 2/10 · Minimal
- Unhealthy air days now
- 1 days/yr
- Unhealthy air days in 30 yrs
- 2 days/yr
Risk factors via First Street. Map © Google.
Why this score? — see what drove the D grade
The composite is a weighted blend of 9 inputs, each scored 0–100. Each bar is that input's sub-score; the figure is the points it added to the 100-point composite (weight × sub-score).
- Appreciation +10.0/10.0
- Cash flow +8.7/30.0
- ARV discount +7.5/15.0
- Schools +4.1/10.0
- Livability +3.0/5.0
- Condition / age +2.5/5.0
- DSCR +2.4/10.0
- 1% rule +1.4/10.0
- Rent growth +1.3/5.0
$465,900
🖨 Deal sheet 📄 Offer letter ✓ Due diligence
Listing remarks MLS
DUPLEX LOT IN THE FAST GROWING CITY OF "LEHIGH ACRES" JUST SOUTH OF GRANT BL & NEAR THE SR 82 HWY EXPANSION MAKING COMMUTE TO FORT MYERS, BEACHES, & SHOPPING A BREEZE!!! CANAL BEHIND PROPERTY ADDING TO PRIVACY! Great Time to invest in Land! Secure your lot to build a DUPLEX, LIVE IN ONE AND RENT THE OTHER FOR INCOME, OR BUILD A SINGLE FAMILY HOME ON THIS OVERSIZED LOT APPROX . 29 OF AN ACRE, or simply buy a real asset! WESTERN EXPOSURE ON THIS GEM. SELLER FINANCING IS AVAILABLE on SELECTED LOTS to make ownership easier. NO CREDIT, INCOME OR EMPLOYMENT VERIFICATION. BEST TERMS IN THE MARKET!! LOW MONTHLY PAYMENTS!!. NO PRE-PAYMENT PENALTY A written estimate with all the terms will be provided for the lot you select. Before you buy, give us a chance to earn your business. “GROUP HAS OTHER LOTS AVAILABLE, ¼ ACRE AND ½ ACRE LOTS. Lot List is available upon request. COMPARE PRICES AND TERMS BEFORE YOU BUY! SELLER WILL CONSIDER LOT PACKAGE PURCHASE!
Key facts
- Quartz countertops
- High-end lighting
- New construction
Tags
Property features AI
Finance
- Financial info: Pets allowed
- HOA & community: No association fee; Elevator in community
Exterior
- Parking: Each unit has an attached 1-car garage
- Utilities: Well water; Septic tank; Cable not available
- Home design: Duplex / multi-family with 2 total units; New construction
- Construction: Block, concrete, and stucco construction; Shingle roof
- Exterior features: Room for a pool; Rectangular lot
Interior
- Kitchen: Each unit includes a dishwasher, microwave, range, and refrigerator
- Bedrooms: Two separate three-bedroom units (each unit has 3 bedrooms)
- Flooring: Tile
- Bathrooms: Each unit has two full bathrooms (total of 4 full bathrooms)
- Heating & cooling: Central heating (electric); Central air conditioning (electric)
- Interior features: Single-hung windows; Tile flooring
- Laundry & utility: Laundry in garage for each unit
Neighborhood map
What this means for you Summary
Snapshot
- This is a 6-bed/4.0-bath land listed at $466k.
Deal economics
- At list price, monthly cash flow is $-393 ($-5k/yr) — negative.
- To cash-flow at today's rent, offer at most $396k (14.9% below list).
- To meet the 1% rule (rent ≥ 1% of price), the offer needs to be $297k (36.3% below list).
- Recommended offer: $297k (36.3% below list) — sets the bar for 1% rule.
Location & tenants
- Location reads 59/100 on livability (#826 in FL) — a working-class tenant base; expect higher turnover. Strengths: cost of living A+, housing A+; Watch: crime C-, employment D+, schools D-.
- Lee (suburban): math 47% / reading 50% proficiency, ranked #42 of 73 in FL (top 58%) — families likely to look elsewhere, expect single-tenant / working-renter base with shorter leases.
- Market conditions: Rents falling (-4.7%/yr); 2460 active listings in the ZIP; 3 comparable units currently listed for rent nearby; rentals at typical pace (median 16d on market — plan ~3-4 weeks tenant-placement turnaround); 15,411 units permitted in Lee County in 2024 (4,686 in 5+ unit buildings).
- At $2,970/mo this rent would consume 49% of the median local household income ($72k/yr) (locally 434% of renters already pay >50% of income on rent) — very limited rent-growth headroom before tenants either downsize or default.
Forward outlook
- In year one you build about $50k of equity ($3k loan paydown + $47k appreciation (10.0% local appreciation)).
- Lee County population projected at +44% by 2050 — long-run rental-demand tailwind backs the buy-and-hold thesis.
- By year 2, paydown + projected appreciation supports a ~$80k cash-out refi (75% LTV) — recoverable capital for the next deal without selling this one.
Negotiation context
- It's been on market 88 days — a 6% lower offer ($438k) is reasonable based on typical stale-listing flexibility.
- 4 sale attempts since 5y ago; this cycle's ask has dropped $29k (6%) from the opening price — seller is motivated, your offer sets the floor, not the list.
- Current owner paid $27k; list at $466k implies a 1626% gain — meaningful room to come down on a strong offer.
Risks & watch-outs
- Climate carrying-cost: severe wind risk, 99% chance of damaging wind over 30y; extreme-heat days projected 7→27/yr by 2055 (HVAC capex compounding) — expect insurance premiums to compound above CPI over the hold.
Questions for the listing agent
- What do current leases actually rent for vs. the listed asking? Can we see a recent rent roll and the last 12 months of T-12 income?
- It's been on market 88 days. Have you received any prior offers? Is the seller open to a 36% concession, seller financing, or rate buy-down credit?
- Why hasn't it sold? Are there any deal-killer items the seller is aware of (foundation, flood, title, zoning, code violations)?
- Is there a deadline driving the sale (1031 exchange, divorce, estate, relocation)? That informs how much negotiation room exists.
- Schools are D-rated, which usually means shorter tenancies and higher turnover. Who's the typical renter profile here, and what's been the actual vacancy rate?
- The area grade is low — what's the realistic commute time and amenity access for the typical tenant pool here? Any planned neighborhood developments (good or bad) we should know about?
- What's the average days-on-market for RENTAL listings here right now (not sales)? A rising rental-DOM trend means longer vacancies and softer asking-rent achievability than the comps imply.
- What's the recent tenant-quality profile in this submarket — average credit score on applications, eviction rate, late-payment / NSF rate, and stable-employment percentage? A property-management company in the area should have these aggregated.
- How much new for-sale + rental construction is in the pipeline within 1–3 miles? Heavy new supply typically softens prices + rents 12–24 months out; constrained supply supports both.
Investment metrics
- 1% rule
- 0.64% ✗
- Cap rate
- 5.28%
- Cash-on-cash
- -3.62%
- DSCR
- 0.84
- GRM
- 13.1
CMA / ARV
No comps found within radius.
Projected returns pro-forma
10.0% appreciation · 0.0% rent growth · sell at horizon
- IRR
- 21.0%
- Equity multiple
- 2.68×
- Total profit
- $219,730
- Equity at exit
- $419,720
- IRR
- 18.5%
- Equity multiple
- 5.99×
- Total profit
- $650,693
- Equity at exit
- $905,141
Cash invested: $130,452 (down + closing). Projections, not guarantees.
Landlord ↔ Tenant lean methodology
- Overall (STATE)
- 87 Strongly Landlord-Friendly
- State Florida
- 87 Strongly Landlord-Friendly · R+3
- County
- — inherits STATE
- City
- — inherits STATE
ZIP-level market 33974
- Home prices YoY
- 5.8%
- Rents YoY
- -4.7%
- Active inventory
- 2460
- Price-to-rent
- 13.1×
Monthly cashflow live
- Estimated rent
- $2,970 medium interval (Pro) →
- Mortgage (P&I)
- −$2,443
- Tax from tax record
- −$102 /mo · $1,227/yr
- Insurance
- −$194
- HOA
- −$0
- Vacancy / Maint / Mgmt
- −$624
- Net cashflow
- $-393
Break-even live
UW: 25.0% down · 7.5% · 30yr · 1.5% tax · 5.0% vac · 8.0% maint · 8.0% mgmt
Financing live
Cash to close
- Down payment
- $116,475
- Closing costs
- $13,977
- Reserves months
- —
- Total cash needed
- —
Loan-product check · same deal, 3 products live
Conventional
25% down · 7.5% · 30yr
- Down + closing
- —
- Monthly P&I
- —
- Monthly cashflow
- —
- DSCR
- —
- Eligible?
- —
Personal DTI + credit; lowest rate.
DSCR
20% down · 8.5% · 30yr
- Down + closing
- —
- Monthly P&I
- —
- Monthly cashflow
- —
- DSCR
- —
- Eligible?
- —
No personal income docs; deal must DSCR.
Hard money
10% down · 12.0% · 12mo
- Down + closing
- —
- Monthly P&I
- —
- Monthly cashflow
- —
- DSCR
- —
- Eligible?
- —
Short-term bridge; refi at stabilization.
Rent comps 3 comps
| Address | Beds | Baths | Sqft | Rent | $/sqft | DOM | Units | Dist |
|---|---|---|---|---|---|---|---|---|
| 19972 Green Pasture Rd Lehigh Acres, FL | 5.0 | 2.5 | 2959 | $3,000 | $1.01 | 21d | 1 | 1.00mi |
| 11613 Savanna Lakes Blvd Lehigh Acres, FL | 5.0 | 3.0 | 2451 | $2,700 | $1.10 | 15d | 1 | 1.19mi |
| 11902 Savanna Lakes Blvd Lehigh Acres, FL | 6.0 | 3.0 | 3041 | $2,750 | $0.90 | 15d | 1 | 1.48mi |
Listing history 35 events
-
2026-06-17days on market $465,900 Active 88 DOM
-
2026-06-16days on market $465,900 Active 87 DOM
-
2026-06-15days on market $465,900 Active 86 DOM
-
2026-06-13days on market $465,900 Active 84 DOM
-
2026-06-10days on market $465,900 Active 81 DOM
-
2026-06-09days on market $465,900 Active 80 DOM
-
2026-06-07days on market $465,900 Active 78 DOM
-
2026-06-03days on market $465,900 Active 74 DOM
-
2026-06-02days on market $465,900 Active 73 DOM
-
2026-06-01days on market $465,900 Active 72 DOM
-
2026-06-01days on market $465,900 Active 71 DOM
-
2026-05-17price $465,900
-
2026-05-15price $479,900
-
2026-05-11price $490,000
-
2026-04-27price $494,000
-
2026-03-21$495,000 Active
-
2026-02-26historical
-
2026-02-11price $491,000
-
2026-01-21status Active
-
2026-01-10status Pending
-
2025-11-29price $478,900
-
2025-11-17price $479,000
-
2025-11-07price $489,000
-
2025-10-09price $523,800
-
2025-10-08price $523,900
-
2025-10-02price $524,000
-
2025-10-01price $525,000
-
2025-07-16price $515,000
-
2025-07-12price $525,000
-
2025-07-09$555,000 Active
-
2023-03-03soldstatus $27,000
-
2021-06-14soldstatus $1,750,000
-
2021-06-07soldstatus $17,500 Closed 999-char remark
Show marketing remark (999 chars)
DUPLEX LOT IN THE FAST GROWING CITY OF "LEHIGH ACRES" JUST SOUTH OF GRANT BL & NEAR THE SR 82 HWY EXPANSION MAKING COMMUTE TO FORT MYERS, BEACHES, & SHOPPING A BREEZE!!! CANAL BEHIND PROPERTY ADDING TO PRIVACY! Great Time to invest in Land! Secure your lot to build a DUPLEX, LIVE IN ONE AND RENT THE OTHER FOR INCOME, OR BUILD A SINGLE FAMILY HOME ON THIS OVERSIZED LOT APPROX . 29 OF AN ACRE, or simply buy a real asset! WESTERN EXPOSURE ON THIS GEM. SELLER FINANCING IS AVAILABLE on SELECTED LOTS to make ownership easier. NO CREDIT, INCOME OR EMPLOYMENT VERIFICATION. BEST TERMS IN THE MARKET!! LOW MONTHLY PAYMENTS!!. NO PRE-PAYMENT PENALTY A written estimate with all the terms will be provided for the lot you select. Before you buy, give us a chance to earn your business. “GROUP HAS OTHER LOTS AVAILABLE, ¼ ACRE AND ½ ACRE LOTS. Lot List is available upon request. COMPARE PRICES AND TERMS BEFORE YOU BUY! SELLER WILL CONSIDER LOT PACKAGE PURCHASE!
-
2021-05-04status Pending 999-char remark
Show marketing remark (999 chars)
DUPLEX LOT IN THE FAST GROWING CITY OF "LEHIGH ACRES" JUST SOUTH OF GRANT BL & NEAR THE SR 82 HWY EXPANSION MAKING COMMUTE TO FORT MYERS, BEACHES, & SHOPPING A BREEZE!!! CANAL BEHIND PROPERTY ADDING TO PRIVACY! Great Time to invest in Land! Secure your lot to build a DUPLEX, LIVE IN ONE AND RENT THE OTHER FOR INCOME, OR BUILD A SINGLE FAMILY HOME ON THIS OVERSIZED LOT APPROX . 29 OF AN ACRE, or simply buy a real asset! WESTERN EXPOSURE ON THIS GEM. SELLER FINANCING IS AVAILABLE on SELECTED LOTS to make ownership easier. NO CREDIT, INCOME OR EMPLOYMENT VERIFICATION. BEST TERMS IN THE MARKET!! LOW MONTHLY PAYMENTS!!. NO PRE-PAYMENT PENALTY A written estimate with all the terms will be provided for the lot you select. Before you buy, give us a chance to earn your business. “GROUP HAS OTHER LOTS AVAILABLE, ¼ ACRE AND ½ ACRE LOTS. Lot List is available upon request. COMPARE PRICES AND TERMS BEFORE YOU BUY! SELLER WILL CONSIDER LOT PACKAGE PURCHASE!
-
2021-04-29$17,900 Active 999-char remark
Show marketing remark (999 chars)
DUPLEX LOT IN THE FAST GROWING CITY OF "LEHIGH ACRES" JUST SOUTH OF GRANT BL & NEAR THE SR 82 HWY EXPANSION MAKING COMMUTE TO FORT MYERS, BEACHES, & SHOPPING A BREEZE!!! CANAL BEHIND PROPERTY ADDING TO PRIVACY! Great Time to invest in Land! Secure your lot to build a DUPLEX, LIVE IN ONE AND RENT THE OTHER FOR INCOME, OR BUILD A SINGLE FAMILY HOME ON THIS OVERSIZED LOT APPROX . 29 OF AN ACRE, or simply buy a real asset! WESTERN EXPOSURE ON THIS GEM. SELLER FINANCING IS AVAILABLE on SELECTED LOTS to make ownership easier. NO CREDIT, INCOME OR EMPLOYMENT VERIFICATION. BEST TERMS IN THE MARKET!! LOW MONTHLY PAYMENTS!!. NO PRE-PAYMENT PENALTY A written estimate with all the terms will be provided for the lot you select. Before you buy, give us a chance to earn your business. “GROUP HAS OTHER LOTS AVAILABLE, ¼ ACRE AND ½ ACRE LOTS. Lot List is available upon request. COMPARE PRICES AND TERMS BEFORE YOU BUY! SELLER WILL CONSIDER LOT PACKAGE PURCHASE!
ⓘ Source: listings_history table (triggers on properties + properties_extension) + one-shot
backfill from property_details.listing_events for pre-trigger history.
Tax reassessment forecast FL · Resets to sale price
- Current annual tax
- $1,227 · $102/mo
- Projected year-2 tax
- $3,867 · $322/mo
- Expected delta
- +$2,640/yr (+$220/mo · 215.1%)
ⓘ Screening estimate from a state-policy table — verify with the county assessor before closing.
Climate risk First Street
- Flood 1/10 Low FEMA zone X (unshaded) · 0% chance over 30 yrs
- Wildfire 4/10 Moderate
- Heat 9/10 Extreme 7 d/yr ≥108°F today · 27 d/yr by 30 yrs out
- Wind 10/10 Extreme 99% chance of damaging wind over 30 yrs
- Air quality 2/10 Low 1 unhealthy d/yr today · 2 by 30 yrs out
Nearby sold comps map
Loading sold comps map…
Walkable amenities ~0.75 mi
Loading nearby amenities…
Taxation est. · year 1
- Rental income
- $35,638
- − Mortgage interest
- −$26,098
- − Property taxes
- −$1,227
- − Insurance
- −$2,330
- − Repairs & maintenance
- −$2,851
- − Management
- −$2,851
- − Depreciation
- −$13,553
- Taxable loss
- −$13,272
- Est. tax savings @ 24.0%
- +$3,185
- After-tax cash flow
- $-1,536/yr
For passive investors: Depreciation is non-cash, so a rental often shows a tax loss while cash-flowing — sheltering income. Rental losses are passive: they offset passive income freely, and up to $25,000/yr can offset ordinary (W-2) income if you actively participate and your MAGI is under $100k (phasing out to $0 by $150k); unused losses carry forward. On sale, claimed depreciation is recaptured at up to 25%, and gains may owe capital-gains tax (a 1031 exchange can defer both). Figures are a year-1 estimate at your 24.0% rate — not tax advice; consult a CPA.
Schools (NCES district)
- District
- Lee
- NCES district ID
- 1201080
- Math proficiency
- 47% ▼ -11.00%
- Reading proficiency
- 50% ▼ -4.00%
- Median HH income
- $49,518
- Composite
- 41.49/100
- National rank
- #3458
- State rank
- #42 of 73 in FL
Livability — Lehigh Acres
- Score
- 59/100
- State rank
- #826
- US rank
- #20055
Category grades
Schools grade is shown separately in the Schools card above.
Census & demographics
- Census place
- Lehigh Acres, FL
- County
- Lee County · 788,662 people
- City population
- 130,638
- Metro
- Cape Coral-Fort Myers, FL
- Population (ZIP)
- 19,927
- Household income
- $72,192
- Rent vs Own
- Severe rent burden
- 434.0
Population outlook (Lee County) Hauer SSP2
- Today (2025)
- 871,946 people
- By 2030
- 955,468 · +9.6%
- By 2040
- 1,113,587 · +27.7%
- By 2050
- 1,256,891 · +44.1%
- By 2075
- 1,560,270 · +78.9%
- By 2100
- 1,726,848 · +98.0%
Race, ethnicity, and origin ACS 2023
- Neighborhood character
- Diverse neighborhood (Simpson 0.64)
- Race & ethnicity
- Hispanic / Latino 52% Two or more races 31% White 26% Black 18%
- Hispanic origin (detail)
- Mexican 12% Puerto Rican 7% Cuban 20% Dominican 4%
- Common ancestry
- Hispanic 7% Italian 1% Portuguese 1%
- Foreign-born
- 32% · Canada, Jamaica
- Languages at home
- 48% English-only · Spanish 43% French/Haitian/Cajun 7% Other Indo-European 1%
Political lean MEDSL · Lee
- 2024 margin
- Strong R (+28.4) · D 35.5% · R 63.9%
- 2008→2024 swing
- -18.0pp toward R · 2008: -10.4pp · 2024: -28.4pp
- All cycles
- 2024: R+28.4 2020: R+19.2 2016: R+20.4 2012: R+16.6 2008: R+10.4
Not yet ingested
- Civics
- —
Market trends
- HPI YoY
- ▲ 16.53%
- Current HPI
- 303.3399
- Rent YoY
- ▼ -4.68%
- Metro
- Cape Coral-Fort Myers, FL
- State GDP YoY
- ▲ 3.28%
- F500 in state
- 36
Industry mix (Fortune 500 HQ in FL)
| Industry | F500 HQs | Revenue |
|---|---|---|
| Industrial Technology | 2 | $29B |
|
||
| Insurance | 2 | $17B |
|
||
| Retail | 1 | $60B |
|
||
| Technology Distribution | 1 | $58B |
|
||
| Homebuilding | 1 | $35B |
|
||
| Technology Manufacturing | 1 | $35B |
|
||
Price history
+2502.8% since first listed24 events — show timeline
- 2026-05-17 Price Changed $465,900 FORTMLS
- 2026-05-15 Price Changed $479,900 FORTMLS
- 2026-05-11 Price Changed $490,000 FORTMLS
- 2026-04-27 Price Changed $494,000 FORTMLS
- 2026-03-21 Listed $495,000 FORTMLS
- 2026-02-26 Listing Removed — FORTMLS
- 2026-02-11 Price Changed $491,000 FORTMLS
- 2026-01-21 Relisted — FORTMLS
- 2026-01-10 Pending — FORTMLS
- 2025-11-29 Price Changed $478,900 FORTMLS
- 2025-11-17 Price Changed $479,000 FORTMLS
- 2025-11-07 Price Changed $489,000 FORTMLS
- 2025-10-09 Price Changed $523,800 FORTMLS
- 2025-10-08 Price Changed $523,900 FORTMLS
- 2025-10-02 Price Changed $524,000 FORTMLS
- 2025-10-01 Price Changed $525,000 FORTMLS
- 2025-07-16 Price Changed $515,000 FORTMLS
- 2025-07-12 Price Changed $525,000 FORTMLS
- 2025-07-09 Listed $555,000 FORTMLS
- 2023-03-03 Sold (Public Records) $27,000 Public Records
- 2021-06-14 Sold (Public Records) $1,750,000 Public Records
- 2021-06-07 Sold (MLS) $17,500 FORTMLS
- 2021-05-04 Pending — FORTMLS
- 2021-04-29 Listed $17,900 FORTMLS
Property tax history
+27.5%/yrLatest (2025): $1,227 · +165.3% YoY. Source: county tax records.
Cash-flow waterfall
monthlySold comps — $/sqft
last 12 mo · ≤1 miLoading sold comps…