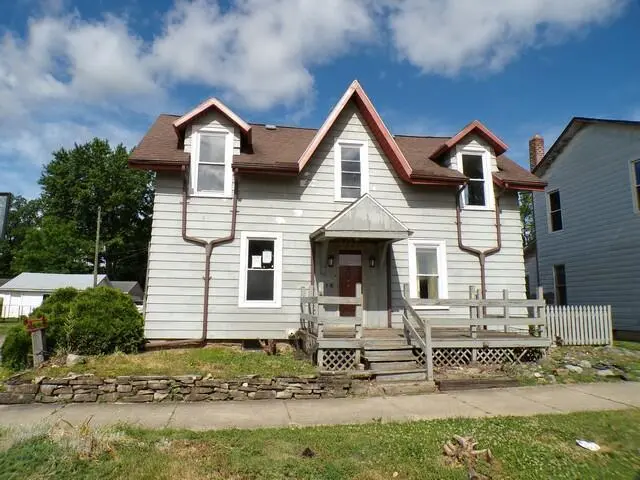
116 N Columbus St · Crestline, OH
Flood risk 1/10 · Minimal
- FEMA flood zone
- X (unshaded)
- Chance of flooding over 30 yrs
- 0.0%
- Est. flood insurance / yr
- $473 – $860
Fire risk 1/10 · Minimal
- Est. fire insurance / yr
- $713 – $1,323
Heat risk 3/10 · Minor
- Hot days now (above 98°F)
- 7 days/yr
- Hot days in 30 yrs
- 17 days/yr
Wind risk 2/10 · Minimal
- Chance of severe wind over 30 yrs
- —
Air-quality risk 2/10 · Minimal
- Unhealthy air days now
- 1 days/yr
- Unhealthy air days in 30 yrs
- 2 days/yr
Risk factors via First Street. Map © Google.
Why this score? — see what drove the B- grade
The composite is a weighted blend of 9 inputs, each scored 0–100. Each bar is that input's sub-score; the figure is the points it added to the 100-point composite (weight × sub-score).
- Cash flow +26.2/30.0
- ARV discount +15.0/15.0
- DSCR +8.9/10.0
- 1% rule +7.0/10.0
- Livability +3.7/5.0
- Schools +3.4/10.0
- Rent growth +2.5/5.0
- Condition / age +2.5/5.0
- Appreciation +0.0/10.0
$119,900
🖨 Deal sheet (PDF) 📄 Offer letter ✓ Due diligence
Listing remarks MLS
Beautiful Well Maintained Home with 5 Bedrooms in Crestline. Meticulous Landscaping with a KOI Fish Pond. Newer Furnace, Water Heater & Fence. Main Floor Master Bedroom! Large Garage & Shed. Lots of Room! 2 Car Det. Garage.
Key facts
- Storage space
- Fenced rear yard
- 7,405 sq ft lot
Tags
Property features AI
Finance
- Other: Property listed as Real Estate Owned
- Financial info: Tax year 2025
Exterior
- Parking: Detached 2-car garage
- Utilities: Public water; Public sewer
- Home design: Single-family residence; Two stories; No shared/common walls
- Construction: Built in 999
- Exterior features: Block foundation; Lot about 0.17 acre
Interior
- Bedrooms: One main-level bedroom
- Bathrooms: Two full bathrooms
- Interior features: Basement
Neighborhood map
What this means for you Summary
Snapshot
- This is a 5-bed/1.5-bath single-family listed at $120k.
Deal economics
- At list price, monthly cash flow is $307 ($4k/yr) — positive.
- The deal already cash-flows at list — no discount required.
- Meets the 1% rule at list price ($1k rent vs $120k).
Location & tenants
- Location reads 73/100 on livability (#328 in OH) — a middle-class / working-renter tenant base. Strengths: crime A+, cost of living A+, housing A+; Watch: employment D+, amenities F, commute F.
- Crestline Exempted Village (rural): math 34% / reading 48% proficiency, ranked #539 of 656 in OH (top 82%) — families likely to look elsewhere, expect single-tenant / working-renter base with shorter leases.
- Market conditions: 21 active listings in the ZIP; 8 units permitted in Crawford County in 2024 (0 in 5+ unit buildings).
- This rent runs 32% of the median local income ($53k/yr) — at the standard rent-burdened threshold; future hikes will face affordability resistance.
Forward outlook
- Local home prices are declining (-3.0%/yr); year-one equity from $829 of loan paydown is wiped out by about $4k of value loss. Plan a longer hold.
- Crawford County population projected at -22% by 2050 — secular population decline; favor cash flow + early exit over multi-decade hold.
- At projected returns (-3.0% appreciation + 3.0% rent growth), your $34k cash investment doubles in ~10 years — after that, you're playing with house money.
Negotiation context
- Only 7 days on market — expect competitive offers; lowballing is unlikely to land.
- 2 sale attempts since 5y ago with the ask held roughly flat each time — persistent listings suggest the price (not the market) is what's stuck; bring a comps-based counter.
Questions for the listing agent
- Is there a deadline driving the sale (1031 exchange, divorce, estate, relocation)? That informs how much negotiation room exists.
- What's the average days-on-market for RENTAL listings here right now (not sales)? A rising rental-DOM trend means longer vacancies and softer asking-rent achievability than the comps imply.
- What's the recent tenant-quality profile in this submarket — average credit score on applications, eviction rate, late-payment / NSF rate, and stable-employment percentage? A property-management company in the area should have these aggregated.
- How much new for-sale + rental construction is in the pipeline within 1–3 miles? Heavy new supply typically softens prices + rents 12–24 months out; constrained supply supports both.
Investment metrics
- 1% rule
- 1.20% ✓
- Cap rate
- 9.36%
- Cash-on-cash
- 10.96%
- DSCR
- 1.49
- GRM
- 7.0
CMA / ARV
- ARV (on-the-fly)
- $175,280
- Comps found
- 3
Show comp detail 3 sales within ~0.75 mi
| Address | Dist | Beds/Ba | Sqft | Sold | Price | $/sf | Match |
|---|---|---|---|---|---|---|---|
| 352 N Wiley St | 0.34mi | 4/2.0 (-1) | 2,134 (-15%) | 3mo | $149,000 | $70 | 50 |
| 332 N Pearl St | 0.25mi | 4/1.5 (-1) | 2,152 (-14%) | 14mo | $188,895 | $88 | 48 |
| 201 N Pearl St | 0.11mi | 4/2.0 (-1) | 2,147 (-14%) | 22mo | $150,000 | $70 | 46 |
Match score weights: distance 35% · size 25% · config 20% · recency 20%. Top-matched comps best support the ARV.
Projected returns pro-forma
-3.0% appreciation · 3.0% rent growth · sell at horizon
- IRR
- 0.1%
- Equity multiple
- 1.00×
- Total profit
- $121
- Equity at exit
- $17,877
- IRR
- 9.8%
- Equity multiple
- 1.75×
- Total profit
- $25,339
- Equity at exit
- $10,367
Cash invested: $33,572 (down + closing). Projections, not guarantees.
Landlord ↔ Tenant lean methodology
- Overall (STATE)
- 73 Landlord-Friendly
- State Ohio
- 73 Landlord-Friendly · R+6
- County
- — inherits STATE
- City
- — inherits STATE
ZIP-level market 44827
- Home prices YoY
- -23.6%
- Active inventory
- 21
- Price-to-rent
- 7.0×
Monthly cashflow live
- Estimated rent
- $1,437 medium interval (Pro) →
- Mortgage (P&I)
- −$629
- Tax from tax record
- −$150 /mo · $1,796/yr
- Insurance
- −$50
- HOA
- −$0
- Vacancy / Maint / Mgmt
- −$302
- Net cashflow
- $307
Break-even live
Sensitivity live
| Price | -10% $374 | -5% $341 | +0% $307 | +5% $273 | +10% $239 |
|---|---|---|---|---|---|
| Rent | -10% $193 | -5% $250 | +0% $307 | +5% $363 | +10% $420 |
| Rate | -1.0pp $367 | -0.5pp $337 | base $307 | +0.5pp $276 | +1.0pp $244 |
UW: 25.0% down · 7.5% · 30yr · 1.5% tax · 5.0% vac · 8.0% maint · 8.0% mgmt
Financing live
Cash to close
- Down payment
- $29,975
- Closing costs
- $3,597
- Reserves months
- —
- Total cash needed
- —
Loan-product check · same deal, 3 products live
Conventional
25% down · 7.5% · 30yr
- Down + closing
- —
- Monthly P&I
- —
- Monthly cashflow
- —
- DSCR
- —
- Eligible?
- —
Personal DTI + credit; lowest rate.
DSCR
20% down · 8.5% · 30yr
- Down + closing
- —
- Monthly P&I
- —
- Monthly cashflow
- —
- DSCR
- —
- Eligible?
- —
No personal income docs; deal must DSCR.
Hard money
10% down · 12.0% · 12mo
- Down + closing
- —
- Monthly P&I
- —
- Monthly cashflow
- —
- DSCR
- —
- Eligible?
- —
Short-term bridge; refi at stabilization.
Listing history 7 events
-
2026-06-19days on market $119,900 Active 7 DOM
-
2026-06-18days on market $119,900 Active 6 DOM
-
2026-06-18remarks 224-char remark
-
2026-06-17days on market $119,900 Active 5 DOM
-
2026-06-16days on market $119,900 Active 4 DOM
-
2026-06-15days on market $119,900 Active 3 DOM
-
2026-06-13$119,900 Active 1 DOM
ⓘ Source: listings_history table (triggers on properties + properties_extension) + one-shot
backfill from property_details.listing_events for pre-trigger history.
Tax reassessment forecast OH · Partial reset (capped growth)
- Current annual tax
- $1,796 · $150/mo
- Projected year-2 tax
- $1,833 · $153/mo
- Expected delta
- +$37/yr (+$3/mo · 2.1%)
ⓘ Screening estimate from a state-policy table — verify with the county assessor before closing.
Climate risk First Street
- Flood 1/10 Low FEMA zone X (unshaded) · 0% chance over 30 yrs
- Wildfire 1/10 Low
- Heat 3/10 Moderate 7 d/yr ≥98°F today · 17 d/yr by 30 yrs out
- Wind 2/10 Low
- Air quality 2/10 Low 1 unhealthy d/yr today · 2 by 30 yrs out
Nearby sold comps map
Loading sold comps map…
Walkable amenities ~0.75 mi
Loading nearby amenities…
Taxation est. · year 1
- Rental income
- $17,240
- − Mortgage interest
- −$6,716
- − Property taxes
- −$1,796
- − Insurance
- −$600
- − Repairs & maintenance
- −$1,379
- − Management
- −$1,379
- − Depreciation
- −$3,488
- Taxable income
- $1,882
- Est. tax owed @ 24.0%
- −$452
- After-tax cash flow
- $3,228/yr
For passive investors: Depreciation is non-cash, so a rental often shows a tax loss while cash-flowing — sheltering income. Rental losses are passive: they offset passive income freely, and up to $25,000/yr can offset ordinary (W-2) income if you actively participate and your MAGI is under $100k (phasing out to $0 by $150k); unused losses carry forward. On sale, claimed depreciation is recaptured at up to 25%, and gains may owe capital-gains tax (a 1031 exchange can defer both). Figures are a year-1 estimate at your 24.0% rate — not tax advice; consult a CPA.
Schools (NCES district)
- District
- Crestline Exempted Village
- NCES district ID
- 3910008
- Math proficiency
- 34% ▼ -12.00%
- Reading proficiency
- 48% ▼ -14.00%
- Median HH income
- $39,422
- Composite
- 34.26/100
- National rank
- #5251
- State rank
- #539 of 656 in OH
Livability — Crestline
- Score
- 73/100
- State rank
- #328
- US rank
- #5382
Category grades
Schools grade is shown separately in the Schools card above.
Census & demographics
- Census place
- Crestline, OH
- County
- Crawford · 26,873 people
- Population (ZIP)
- 7,009
- Household income
- $53,089
- Rent vs Own
- Severe rent burden
- 17.0
Population outlook (Crawford County) Hauer SSP2
- Today (2025)
- 39,421 people
- By 2030
- 37,656 · -4.5%
- By 2040
- 34,043 · -13.6%
- By 2050
- 30,617 · -22.3%
- By 2075
- 23,652 · -40.0%
- By 2100
- 17,786 · -54.9%
Race, ethnicity, and origin ACS 2023
- Neighborhood character
- Predominantly White (93%)
- Race & ethnicity
- White 93% Two or more races 4% Hispanic / Latino 2%
- Common ancestry
- Slovak 2% English 2% Romanian 2%
- Foreign-born
- 2% · China, Vietnam
Political lean MEDSL · Crawford
- 2024 margin
- Solid R (+53.0) · D 23.1% · R 76.1%
- 2008→2024 swing
- -33.9pp toward R · 2008: -19.0pp · 2024: -53.0pp
- All cycles
- 2024: R+53.0 2020: R+50.9 2016: R+46.8 2012: R+22.7 2008: R+19.0
Not yet ingested
- Civics
- —
Market trends
- HPI YoY
- ▼ -82.15%
- Current HPI
- 265.55
- Rent YoY
- —
- Metro
- —
- State GDP YoY
- ▲ 1.98%
- F500 in state
- 48
Industry mix (Fortune 500 HQ in OH)
| Industry | F500 HQs | Revenue |
|---|---|---|
| Insurance | 3 | $145B |
|
||
| Industrial Machinery | 3 | $49B |
|
||
| Financial Services | 3 | $24B |
|
||
| Consumer Goods | 2 | $93B |
|
||
| Aerospace / Defense | 2 | $47B |
|
||
| Utilities | 2 | $33B |
|
||
Price history
+0.8% since first listed4 events — show timeline
- 2026-06-12 Listed $119,900 CBRMLS
- 2022-04-28 Sold (Public Records) $127,250 Public Records
- 2022-04-28 Sold (MLS) $126,000 MARMLS
- 2021-11-08 Listed $119,000 MARMLS
Property tax history
+4.6%/yrLatest (2025): $1,796 · -0.9% YoY. Source: county tax records.
Cash-flow waterfall
monthlySold comps — $/sqft
last 12 mo · ≤1 miLoading sold comps…