 🔨 Auction
15 Garfield Ave · Gallipolis, OH
Flood risk 7/10 · Major
- FEMA flood zone
- X (unshaded)
- Chance of flooding over 30 yrs
- 0.76%
- Est. flood insurance / yr
- $473 – $860
Fire risk 4/10 · Minor
- Est. fire insurance / yr
- $713 – $1,323
Heat risk 4/10 · Minor
- Hot days now (above 101°F)
- 7 days/yr
- Hot days in 30 yrs
- 18 days/yr
Wind risk 2/10 · Minimal
- Chance of severe wind over 30 yrs
- 1.0%
Air-quality risk 1/10 · Minimal
- Unhealthy air days now
- 0 days/yr
- Unhealthy air days in 30 yrs
- 0 days/yr
Risk factors via First Street. Map © Google.
Why this score? — see what drove the F grade
The composite is a weighted blend of 9 inputs, each scored 0–100. Each bar is that input's sub-score; the figure is the points it added to the 100-point composite (weight × sub-score).
- Cash flow +10.2/30.0
- ARV discount +7.5/15.0
- Schools +3.9/10.0
- Livability +3.1/5.0
- 1% rule +3.0/10.0
- DSCR +2.9/10.0
- Rent growth +2.5/5.0
- Condition / age +1.0/5.0
- Appreciation +0.0/10.0
$32,872
🖨 Deal sheet 📄 Offer letter ✓ Due diligence
Listing remarks
Court Ordered Sale by Private Selling Officer. Online Auction ends on June 18, 2026. All information we have on the property is included. We have no additional information, property condition is unknown. NO SHOWINGS, NO trespassing for any reason. Information is thought to be correct but not guaranteed. 10% Buyer Premium added to the high bid, $5,000 deposit is due within 24 hours of bidding end.
Key facts
- 0.71 acre lot
- Built 1900
- Listed 54 days
Property features AI
Exterior
- Home design: Single-family residential; 2 stories
- Construction: Vinyl siding
- Exterior features: Asphalt/shingle roof
Interior
- Bathrooms: 2 full bathrooms
- Heating & cooling: Forced air heating (natural gas); No central cooling
- Interior features: 7 total rooms
Neighborhood map
What this means for you Summary
Snapshot
- This is a 3-bed/2.0-bath single-family listed at $33k. Condition is rated poor.
Deal economics
- At list price, monthly cash flow is $-148 ($-2k/yr) — negative.
- The deal already cash-flows at list — no discount required.
- Meets the 1% rule at list price ($1k rent vs $33k).
- Recommended offer: $32k (3.0% below list) — sets the bar for market timing.
- Cap rate 5.6% vs local median 4.5% in Gallipolis — meaningfully above typical; check what's discounted (condition, days-on-market, listing class) to confirm the premium yield is real.
Location & tenants
- Location reads 62/100 on livability (#910 in OH) — a middle-class / working-renter tenant base. Strengths: cost of living A+, housing B; Watch: employment C-, crime F, amenities F.
- Gallipolis City (rural): math 39% / reading 56% proficiency, ranked #488 of 656 in OH (top 74%) — families likely to look elsewhere, expect single-tenant / working-renter base with shorter leases.
- Market conditions: 68 active listings in the ZIP; 10 units permitted in Gallia County in 2024 (0 in 5+ unit buildings).
Forward outlook
- Local home prices are declining (-3.0%/yr); year-one equity from $1k of loan paydown is wiped out by about $5k of value loss. Plan a longer hold.
- Gallia County population projected at -24% by 2050 — secular population decline; favor cash flow + early exit over multi-decade hold.
Negotiation context
- It's been on market 55 days — a 3% lower offer ($32k) is reasonable based on typical stale-listing flexibility.
Risks & watch-outs
- Watch-outs: property tax is 7.4% of price; flood insurance adds $56/mo; built in 1900 — expect roof / HVAC / electrical / plumbing capex.
- Climate carrying-cost: major flood risk — expect insurance premiums to compound above CPI over the hold.
Questions for the listing agent
- What do current leases actually rent for vs. the listed asking? Can we see a recent rent roll and the last 12 months of T-12 income?
- It's been on market 55 days. Have you received any prior offers? Is the seller open to a 3% concession, seller financing, or rate buy-down credit?
- Have any recent inspections been done? Can we get a copy of the seller's disclosures and any deferred-maintenance estimates?
- Built in 1900 — when were the roof, HVAC, electrical panel, plumbing, and water heater last replaced?
- Property tax is high relative to price — has the assessment been appealed recently, and will the sale trigger a re-assessment?
- What's the actual annual flood-insurance premium (NFIP or private), and is the property in a SFHA with mandatory coverage?
- Is there a deadline driving the sale (1031 exchange, divorce, estate, relocation)? That informs how much negotiation room exists.
- Crime grade is F in this area — have there been break-ins, vandalism, or insurance claims at this property in the last 3 years? What carrier currently insures it and at what premium?
- The area grade is low — what's the realistic commute time and amenity access for the typical tenant pool here? Any planned neighborhood developments (good or bad) we should know about?
- This sits on a lake — are riparian / water-frontage rights deeded with the parcel? Any dock permits, shoreline easements, or HOA water-use restrictions?
- What's the documented flood / surge / shoreline-erosion history here (FEMA AND non-FEMA — e.g., storm surge, creek backup, septic-field saturation)?
- Any water-quality or seasonal algae-bloom issues that affect tenant satisfaction or short-term-rental demand?
- What's the average days-on-market for RENTAL listings here right now (not sales)? A rising rental-DOM trend means longer vacancies and softer asking-rent achievability than the comps imply.
- What's the recent tenant-quality profile in this submarket — average credit score on applications, eviction rate, late-payment / NSF rate, and stable-employment percentage? A property-management company in the area should have these aggregated.
- How much new for-sale + rental construction is in the pipeline within 1–3 miles? Heavy new supply typically softens prices + rents 12–24 months out; constrained supply supports both.
Investment metrics
- 1% rule
- 0.80% ✗
- Cap rate
- 5.61%
- Cash-on-cash
- -2.44%
- DSCR
- 0.89
- GRM
- 10.4
CMA / ARV
- ARV (median comp)
- $162,678
- List price
- $32,872
- Delta
- -79.79%
- Verdict
- UNDERPRICED
- Comps
- 20 within 1.0 mi
Show comp detail 7 sales within ~0.75 mi
| Address | Dist | Beds/Ba | Sqft | Sold | Price | $/sf | Match |
|---|---|---|---|---|---|---|---|
| 16 Edgemont Drive Dr | 0.23mi | 2/1.0 (-1) | 1,507 (+0%) | 22mo | $130,000 | $86 | 61 |
| 17 Belmont Dr | 0.29mi | 3/1.5 | 1,448 (-4%) | 21mo | $179,900 | $124 | 61 |
| 404 Hedgewood Dr | 0.58mi | 4/1.5 (+1) | 1,460 (-3%) | 4mo | $120,000 | $82 | 59 |
| 174 Sanders Dr | 0.67mi | 3/1.5 | 1,501 (+0%) | 14mo | $177,500 | $118 | 55 |
| 279 State Street St | 0.41mi | 2/1.5 (-1) | 1,352 (-10%) | 15mo | $97,500 | $72 | 45 |
| 411 4th Avenue Ave | 0.62mi | 3/2.0 | 1,674 (+12%) | 12mo | $267,800 | $160 | 41 |
| 410 Hedgewood Dr. Dr | 0.61mi | 4/2.0 (+1) | 1,404 (-6%) | 20mo | $133,000 | $95 | 39 |
Match score weights: distance 35% · size 25% · config 20% · recency 20%. Top-matched comps best support the ARV.
Projected returns pro-forma
-3.0% appreciation · 3.0% rent growth · sell at horizon
- IRR
- -22.8%
- Equity multiple
- 0.22×
- Total profit
- $-35,755
- Equity at exit
- $24,256
- IRR
- -17.1%
- Equity multiple
- 0.05×
- Total profit
- $-43,083
- Equity at exit
- $14,065
Cash invested: $45,550 (down + closing). Projections, not guarantees.
Landlord ↔ Tenant lean methodology
- Overall (STATE)
- 73 Landlord-Friendly
- State Ohio
- 73 Landlord-Friendly · R+6
- County
- — inherits STATE
- City
- — inherits STATE
ZIP-level market 45631
- Home prices YoY
- -8.6%
- Active inventory
- 68
- Price-to-rent
- 2.1×
Monthly cashflow live
- Estimated rent
- $1,306 medium interval (Pro) →
- Mortgage (P&I)
- −$853
- Tax est. 1.5%
- −$203 /mo · $2,440/yr
- Insurance
- −$68
- Flood insurance flood zone
- −$56 /mo · $666/yr
- HOA
- −$0
- Vacancy / Maint / Mgmt
- −$274
- Net cashflow
- $-148
Break-even live
UW: 25.0% down · 7.5% · 30yr · 1.5% tax · 5.0% vac · 8.0% maint · 8.0% mgmt
Financing live
Cash to close
- Down payment
- $40,669
- Closing costs
- $4,880
- Reserves months
- —
- Total cash needed
- —
Loan-product check · same deal, 3 products live
Conventional
25% down · 7.5% · 30yr
- Down + closing
- —
- Monthly P&I
- —
- Monthly cashflow
- —
- DSCR
- —
- Eligible?
- —
Personal DTI + credit; lowest rate.
DSCR
20% down · 8.5% · 30yr
- Down + closing
- —
- Monthly P&I
- —
- Monthly cashflow
- —
- DSCR
- —
- Eligible?
- —
No personal income docs; deal must DSCR.
Hard money
10% down · 12.0% · 12mo
- Down + closing
- —
- Monthly P&I
- —
- Monthly cashflow
- —
- DSCR
- —
- Eligible?
- —
Short-term bridge; refi at stabilization.
Listing history 15 events
-
2026-06-18days on market $32,872 Active 55 DOM
-
2026-06-17days on market $32,872 Active 54 DOM
-
2026-06-16days on market $32,872 Active 53 DOM
-
2026-06-15days on market $32,872 Active 52 DOM
-
2026-06-13days on market $32,872 Active 50 DOM
-
2026-06-12days on market $32,872 Active 49 DOM
-
2026-06-09days on market $32,872 Active 46 DOM
-
2026-06-08days on market $32,872 Active 45 DOM
-
2026-06-08days on market $32,872 Active 44 DOM
-
2026-06-07days on market $32,872 Active 43 DOM
-
2026-06-04days on market $32,872 Active 40 DOM
-
2026-06-02days on market $32,872 Active 39 DOM
-
2026-06-01days on market $32,872 Active 38 DOM
-
2026-05-31days on market $32,872 Active 37 DOM
-
2026-04-24$32,872 Active 398-char remark
ⓘ Source: listings_history table (triggers on properties + properties_extension) + one-shot
backfill from property_details.listing_events for pre-trigger history.
Climate risk First Street
- Flood 7/10 Severe FEMA zone X (unshaded) · 76% chance over 30 yrs
- Wildfire 4/10 Moderate
- Heat 4/10 Moderate 7 d/yr ≥101°F today · 18 d/yr by 30 yrs out
- Wind 2/10 Low 100% chance of damaging wind over 30 yrs
- Air quality 1/10 Low 0 unhealthy d/yr today · 0 by 30 yrs out
Nearby sold comps map
Loading sold comps map…
Walkable amenities ~0.75 mi
Loading nearby amenities…
Taxation est. · year 1
- Rental income
- $15,667
- − Mortgage interest
- −$9,112
- − Property taxes
- −$2,440
- − Insurance
- −$1,480
- − Repairs & maintenance
- −$1,253
- − Management
- −$1,253
- − Depreciation
- −$4,732
- Taxable loss
- −$4,605
- Est. tax savings @ 24.0%
- +$1,105
- After-tax cash flow
- $-675/yr
For passive investors: Depreciation is non-cash, so a rental often shows a tax loss while cash-flowing — sheltering income. Rental losses are passive: they offset passive income freely, and up to $25,000/yr can offset ordinary (W-2) income if you actively participate and your MAGI is under $100k (phasing out to $0 by $150k); unused losses carry forward. On sale, claimed depreciation is recaptured at up to 25%, and gains may owe capital-gains tax (a 1031 exchange can defer both). Figures are a year-1 estimate at your 24.0% rate — not tax advice; consult a CPA.
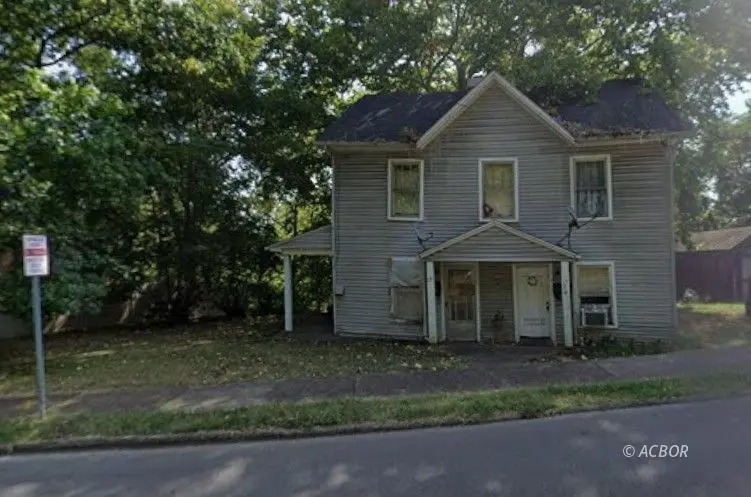
Condition & rehab AI · 7 photos
This property requires extensive repairs and maintenance, including a new roof, siding, and landscaping. Immediate action is needed to improve its condition and value.
Repairs flagged
- Major roof — Missing or damaged shingles, visible wear
- Major siding — Weathered siding
- Major landscaping — Overgrown vegetation, unkempt landscaping
- Major fencing — Damaged or missing
Value-add opportunities
- Both repair and replace roof — A new roof would significantly improve the home's appearance and functionality, attracting buyers and renters alike
- Both repair and replace siding — New siding would improve the home's curb appeal and increase its value
- Both landscaping and fencing — A well-maintained yard and fence would enhance the home's appeal and safety
Renovation cost estimate screening
| Repair item | Severity | Est. cost |
|---|---|---|
| roof · Missing or damaged shingles, visible wear | Major | $15,000–50,000 |
| siding · Weathered siding | Major | $15,000–50,000 |
| landscaping · Overgrown vegetation, unkempt landscaping | Major | $15,000–50,000 |
| fencing · Damaged or missing | Major | $15,000–50,000 |
| Total estimated repair cost · 4 items | $60,000–200,000 |
Value-add ROI direction
- Both repair and replace roof — A new roof would significantly improve the home's appearance and functionality, attracting buyers and renters alike ↑
- Both repair and replace siding — New siding would improve the home's curb appeal and increase its value ↑
- Both landscaping and fencing — A well-maintained yard and fence would enhance the home's appeal and safety ↑
ⓘ Cost ranges are severity-bucket heuristics (US national rule-of-thumb). Get contractor quotes + a written scope before underwriting a rehab budget.
Schools (NCES district)
- District
- Gallipolis City
- NCES district ID
- 3904403
- Math proficiency
- 39% ▼ -22.00%
- Reading proficiency
- 56% ▼ -6.00%
- Median HH income
- $37,983
- Composite
- 39.49/100
- National rank
- #3952
- State rank
- #488 of 656 in OH
Livability — Gallipolis
- Score
- 62/100
- State rank
- #910
- US rank
- #17199
Category grades
Schools grade is shown separately in the Schools card above.
Census & demographics
- Census place
- Gallipolis, OH
- County
- Gallia · 29,277 people
- Population (ZIP)
- 12,669
- Household income
- $54,772
- Rent vs Own
- Severe rent burden
- 9.1
Population outlook (Gallia County) Hauer SSP2
- Today (2025)
- 27,936 people
- By 2030
- 26,605 · -4.8%
- By 2040
- 23,876 · -14.5%
- By 2050
- 21,336 · -23.6%
- By 2075
- 16,414 · -41.2%
- By 2100
- 13,192 · -52.8%
Race, ethnicity, and origin ACS 2023
- Neighborhood character
- Predominantly White (92%)
- Race & ethnicity
- White 92% Two or more races 3% Black 3% Hispanic / Latino 1%
- Common ancestry
- Slovak 3% Lithuanian 3% Italian 1%
- Foreign-born
- 1%
- Languages at home
- 97% English-only · Spanish 1% German/W. Germanic 1%
Political lean MEDSL · Gallia
- 2024 margin
- Solid R (+59.4) · D 19.9% · R 79.3%
- 2008→2024 swing
- -33.3pp toward R · 2008: -26.1pp · 2024: -59.4pp
- All cycles
- 2024: R+59.4 2020: R+55.5 2016: R+55.6 2012: R+26.2 2008: R+26.1
Not yet ingested
- Civics
- —
Market trends
- HPI YoY
- ▼ -19.11%
- Current HPI
- 203.6153
- Rent YoY
- —
- Metro
- —
- State GDP YoY
- ▲ 1.98%
- F500 in state
- 48
Industry mix (Fortune 500 HQ in OH)
| Industry | F500 HQs | Revenue |
|---|---|---|
| Insurance | 3 | $145B |
|
||
| Industrial Machinery | 3 | $49B |
|
||
| Financial Services | 3 | $24B |
|
||
| Consumer Goods | 2 | $93B |
|
||
| Aerospace / Defense | 2 | $47B |
|
||
| Utilities | 2 | $33B |
|
||
Price history
1 event — show timeline
- 2026-04-24 Listed $32,872 ACBOR
Cash-flow waterfall
monthlySold comps — $/sqft
last 12 mo · ≤1 miLoading sold comps…