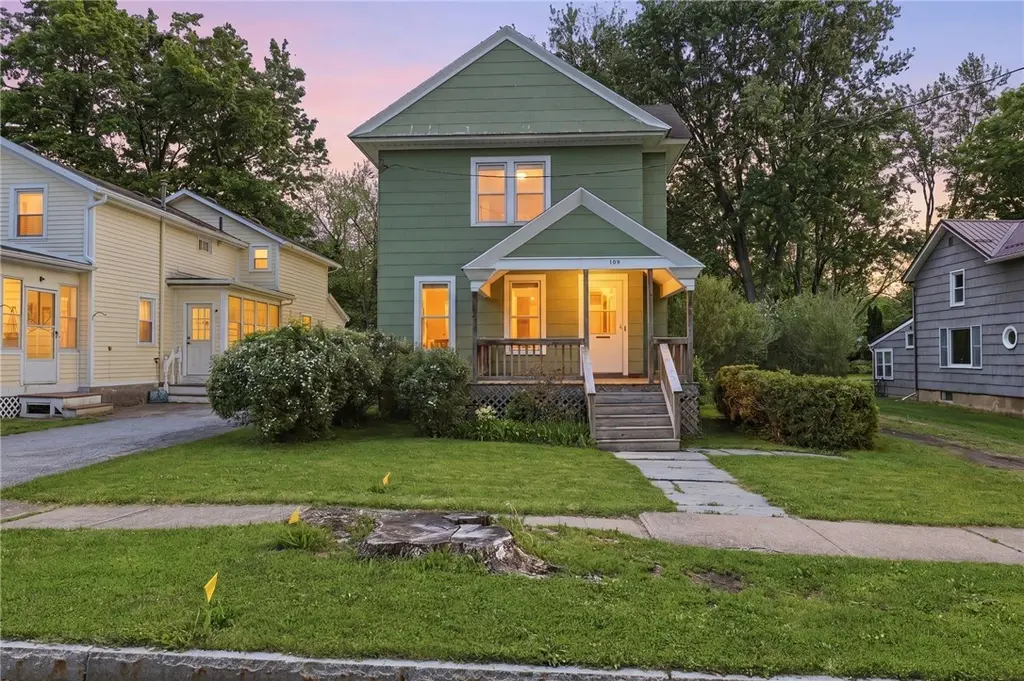
139 Gates St · Palmyra, NY
Flood risk 1/10 · Minimal
- FEMA flood zone
- —
- Chance of flooding over 30 yrs
- 0.0%
- Est. flood insurance / yr
- —
Fire risk 3/10 · Minor
- Est. fire insurance / yr
- $691 – $1,283
Heat risk 2/10 · Minimal
- Hot days now (above 96°F)
- 7 days/yr
- Hot days in 30 yrs
- 16 days/yr
Wind risk 1/10 · Minimal
- Chance of severe wind over 30 yrs
- —
Air-quality risk 2/10 · Minimal
- Unhealthy air days now
- 1 days/yr
- Unhealthy air days in 30 yrs
- 2 days/yr
Risk factors via First Street. Map © Google.
Why this score? — see what drove the C- grade
The composite is a weighted blend of 9 inputs, each scored 0–100. Each bar is that input's sub-score; the figure is the points it added to the 100-point composite (weight × sub-score).
- ARV discount +15.0/15.0
- Cash flow +12.4/30.0
- 1% rule +6.5/10.0
- Schools +4.0/10.0
- DSCR +3.7/10.0
- Livability +3.6/5.0
- Rent growth +2.5/5.0
- Condition / age +2.5/5.0
- Appreciation +0.0/10.0
$139,139
🖨 Deal sheet (PDF) 📄 Offer letter ✓ Due diligence
Listing remarks
Opportunity awaits at 139 Gates Street in the Village of Palmyra! This spacious 3-bedroom, 1-bath home offers over 1,700 square feet of living space and sits on a generous lot with room to reimagine both the interior and exterior. Built in 1900, the property is full of character and potential for the next owner ready to bring their vision and personal touches. Inside, you’ll find large rooms, high ceilings, and a flexible layout with plenty of possibilities. The home needs updates, but the opportunity to build equity is clear. Conveniently located near schools, parks, downtown amenities, and commuter routes. Recent activity in the Palmyra market highlights continued demand for updated
Key facts
- Generous lot
- Flexible layout
- 0.33 acre lot
Tags
Property features AI
Finance
- Other: Rectangular residential lot (~0.33 acre, approx. 60 x 235) with city-street frontage
Exterior
- Parking: No garage
- Utilities: Electricity connected; Public water connected; Sewer connected
- Home design: 2-story house; Existing/resale property; Stone foundation
- Construction: Composite siding; Asphalt roof; Stone foundation; Built (existing)
- Exterior features: Gravel driveway; Shed(s); Exterior storage
Interior
- Kitchen: Gas oven; Gas range; Refrigerator
- Bedrooms: Main level bedrooms (see layout)
- Flooring: Carpet; Laminate; Varied flooring
- Bathrooms: 1 full bathroom; 1 main-level bathroom
- Heating & cooling: Gas forced-air heating
- Interior features: Den; Separate/formal dining room; Eat-in kitchen; Separate/formal living room; Library; Low-threshold shower
- Laundry & utility: Main-level laundry; Washer; Dryer; Gas water heater
Neighborhood map
What this means for you Summary
Snapshot
- This is a 3-bed/1.0-bath single-family listed at $139k.
Deal economics
- At list price, monthly cash flow is $-23 ($-272/yr) — negative.
- To cash-flow at today's rent, offer at most $135k (2.9% below list).
- Meets the 1% rule at list price ($2k rent vs $139k).
- Recommended offer: $135k (2.9% below list) — sets the bar for cash-flow.
Location & tenants
- Location reads 71/100 on livability (#381 in NY) — a middle-class / working-renter tenant base. Strengths: cost of living A+, housing A+, crime A-; Watch: amenities F, commute F, health & safety D-.
- Palmyra-Macedon Central School District (town): math 41% / reading 51% proficiency, ranked #443 of 590 in NY (top 75%) — families likely to look elsewhere, expect single-tenant / working-renter base with shorter leases.
- Market conditions: 37 active listings in the ZIP; 259 units permitted in Wayne County in 2024 (90 in 5+ unit buildings).
Forward outlook
- Local home prices are declining (-3.0%/yr); year-one equity from $962 of loan paydown is wiped out by about $4k of value loss. Plan a longer hold.
- Wayne County population projected at -24% by 2050 — secular population decline; favor cash flow + early exit over multi-decade hold.
Negotiation context
- Only 8 days on market — expect competitive offers; lowballing is unlikely to land.
Risks & watch-outs
- Watch-outs: property tax is 4.3% of price; built in 1900 — expect roof / HVAC / electrical / plumbing capex.
Questions for the listing agent
- What do current leases actually rent for vs. the listed asking? Can we see a recent rent roll and the last 12 months of T-12 income?
- Built in 1900 — when were the roof, HVAC, electrical panel, plumbing, and water heater last replaced?
- Property tax is high relative to price — has the assessment been appealed recently, and will the sale trigger a re-assessment?
- Is there a deadline driving the sale (1031 exchange, divorce, estate, relocation)? That informs how much negotiation room exists.
- What's the average days-on-market for RENTAL listings here right now (not sales)? A rising rental-DOM trend means longer vacancies and softer asking-rent achievability than the comps imply.
- What's the recent tenant-quality profile in this submarket — average credit score on applications, eviction rate, late-payment / NSF rate, and stable-employment percentage? A property-management company in the area should have these aggregated.
- How much new for-sale + rental construction is in the pipeline within 1–3 miles? Heavy new supply typically softens prices + rents 12–24 months out; constrained supply supports both.
Investment metrics
- 1% rule
- 1.15% ✓
- Cap rate
- 6.10%
- Cash-on-cash
- -0.70%
- DSCR
- 0.97
- GRM
- 7.3
CMA / ARV
- ARV (on-the-fly)
- $241,120
- Comps found
- 12
Show comp detail 12 sales within ~0.75 mi
| Address | Dist | Beds/Ba | Sqft | Sold | Price | $/sf | Match |
|---|---|---|---|---|---|---|---|
| 222 W Main St | 0.12mi | 3/1.5 | 1,958 (+11%) | 1mo | $230,000 | $117 | 73 |
| 401 W Jackson St | 0.19mi | 4/2.5 (+1) | 1,816 (+3%) | 3mo | $265,000 | $146 | 72 |
| 138 Tremont St | 0.06mi | 3/1.5 | 1,588 (-10%) | 13mo | $255,000 | $161 | 68 |
| 233 Stafford St | 0.31mi | 3/1.5 | 1,852 (+5%) | 9mo | $200,000 | $108 | 68 |
| 159 Washington St | 0.13mi | 4/1.5 (+1) | 1,810 (+3%) | 22mo | $175,000 | $97 | 64 |
| 229 Hansen St | 0.21mi | 3/2.0 | 1,645 (-6%) | 16mo | $225,000 | $137 | 61 |
| 342 W Main St | 0.12mi | 3/1.0 | 1,528 (-13%) | 14mo | $220,000 | $144 | 61 |
| 116 Mill St | 0.66mi | 4/2.0 (+1) | 1,768 (+0%) | 2mo | $205,000 | $116 | 57 |
| 165 Burnham | 0.45mi | 4/3.0 (+1) | 1,887 (+7%) | 2mo | $401,000 | $213 | 52 |
| 361 Birdsall Pkwy | 0.32mi | 4/2.0 (+1) | 1,653 (-6%) | 23mo | $230,000 | $139 | 47 |
| 226 Fayette St | 0.49mi | 3/2.0 | 1,976 (+12%) | 10mo | $250,000 | $127 | 44 |
| 329 Hathaway Pl | 0.44mi | 4/1.5 (+1) | 1,584 (-10%) | 23mo | $213,000 | $134 | 36 |
Match score weights: distance 35% · size 25% · config 20% · recency 20%. Top-matched comps best support the ARV.
Projected returns pro-forma
-3.0% appreciation · 3.0% rent growth · sell at horizon
- IRR
- -17.2%
- Equity multiple
- 0.39×
- Total profit
- $-23,769
- Equity at exit
- $20,746
- IRR
- -8.9%
- Equity multiple
- 0.44×
- Total profit
- $-21,653
- Equity at exit
- $12,030
Cash invested: $38,959 (down + closing). Projections, not guarantees.
Landlord ↔ Tenant lean methodology
- Overall (STATE)
- 15 Strongly Tenant-Friendly
- State New York
- 15 Strongly Tenant-Friendly · D+10
- County
- — inherits STATE
- City
- — inherits STATE
ZIP-level market 14522
- Home prices YoY
- -26.9%
- Active inventory
- 37
- Price-to-rent
- 7.3×
Monthly cashflow live
- Estimated rent
- $1,598 medium interval (Pro) →
- Mortgage (P&I)
- −$730
- Tax from tax record
- −$498 /mo · $5,971/yr
- Insurance
- −$58
- HOA
- −$0
- Vacancy / Maint / Mgmt
- −$336
- Net cashflow
- $-23
Break-even live
Sensitivity live
| Price | -10% $56 | -5% $17 | +0% $-23 | +5% $-62 | +10% $-101 |
|---|---|---|---|---|---|
| Rent | -10% $-149 | -5% $-86 | +0% $-23 | +5% $40 | +10% $104 |
| Rate | -1.0pp $47 | -0.5pp $13 | base $-23 | +0.5pp $-59 | +1.0pp $-95 |
UW: 25.0% down · 7.5% · 30yr · 1.5% tax · 5.0% vac · 8.0% maint · 8.0% mgmt
Financing live
Cash to close
- Down payment
- $34,785
- Closing costs
- $4,174
- Reserves months
- —
- Total cash needed
- —
Loan-product check · same deal, 3 products live
Conventional
25% down · 7.5% · 30yr
- Down + closing
- —
- Monthly P&I
- —
- Monthly cashflow
- —
- DSCR
- —
- Eligible?
- —
Personal DTI + credit; lowest rate.
DSCR
20% down · 8.5% · 30yr
- Down + closing
- —
- Monthly P&I
- —
- Monthly cashflow
- —
- DSCR
- —
- Eligible?
- —
No personal income docs; deal must DSCR.
Hard money
10% down · 12.0% · 12mo
- Down + closing
- —
- Monthly P&I
- —
- Monthly cashflow
- —
- DSCR
- —
- Eligible?
- —
Short-term bridge; refi at stabilization.
Listing history 7 events
-
2026-06-07statusdays on market $139,139 Pending 8 DOM
-
2026-06-05days on market $139,139 Active 7 DOM
-
2026-06-03days on market $139,139 Active 6 DOM
-
2026-06-03days on market $139,139 Active 5 DOM
-
2026-06-01days on market $139,139 Active 4 DOM
-
2026-05-31days on market $139,139 Active 3 DOM
-
2026-05-28$139,139 Active
ⓘ Source: listings_history table (triggers on properties + properties_extension) + one-shot
backfill from property_details.listing_events for pre-trigger history.
Tax reassessment forecast NY · Partial reset (capped growth)
- Current annual tax
- $5,971 · $498/mo
- Projected year-2 tax
- $5,971 · $498/mo
- Expected delta
- $0/yr ($0/mo · 0.0%)
ⓘ Screening estimate from a state-policy table — verify with the county assessor before closing.
Climate risk First Street
- Flood 1/10 Low 0% chance over 30 yrs
- Wildfire 3/10 Moderate
- Heat 2/10 Low 7 d/yr ≥96°F today · 16 d/yr by 30 yrs out
- Wind 1/10 Low
- Air quality 2/10 Low 1 unhealthy d/yr today · 2 by 30 yrs out
Nearby sold comps map
Loading sold comps map…
Walkable amenities ~0.75 mi
Loading nearby amenities…
Taxation est. · year 1
- Rental income
- $19,177
- − Mortgage interest
- −$7,794
- − Property taxes
- −$5,971
- − Insurance
- −$696
- − Repairs & maintenance
- −$1,534
- − Management
- −$1,534
- − Depreciation
- −$4,048
- Taxable loss
- −$2,399
- Est. tax savings @ 24.0%
- +$576
- After-tax cash flow
- $303/yr
For passive investors: Depreciation is non-cash, so a rental often shows a tax loss while cash-flowing — sheltering income. Rental losses are passive: they offset passive income freely, and up to $25,000/yr can offset ordinary (W-2) income if you actively participate and your MAGI is under $100k (phasing out to $0 by $150k); unused losses carry forward. On sale, claimed depreciation is recaptured at up to 25%, and gains may owe capital-gains tax (a 1031 exchange can defer both). Figures are a year-1 estimate at your 24.0% rate — not tax advice; consult a CPA.
Schools (NCES district)
- District
- Palmyra-Macedon Central School District
- NCES district ID
- 3622380
- Math proficiency
- 41% ▼ -5.00%
- Reading proficiency
- 51% ▲ 10.00%
- Median HH income
- $52,190
- Composite
- 39.65/100
- National rank
- #3915
- State rank
- #443 of 590 in NY
Livability — Palmyra
- Score
- 71/100
- State rank
- #381
- US rank
- #6555
Category grades
Schools grade is shown separately in the Schools card above.
Census & demographics
- Census place
- Palmyra, NY
- City population
- 9,230
- Population (ZIP)
- 9,230
Population outlook (Wayne County) Hauer SSP2
- Today (2025)
- 85,662 people
- By 2030
- 81,945 · -4.3%
- By 2040
- 73,735 · -13.9%
- By 2050
- 65,029 · -24.1%
- By 2075
- 47,451 · -44.6%
- By 2100
- 31,574 · -63.1%
Race, ethnicity, and origin ACS 2023
- Neighborhood character
- Predominantly White (94%)
- Race & ethnicity
- White 94% Two or more races 3% Asian 1% Hispanic / Latino 1%
- Common ancestry
- Iranian 8% Romanian 3% Slovak 2%
- Foreign-born
- 1% · China
- Languages at home
- 98% English-only · Chinese 1% Spanish 1%
Political lean MEDSL · Wayne
- 2024 margin
- Strong R (+23.1) · D 38.5% · R 61.5%
- 2008→2024 swing
- -13.2pp toward R · 2008: -9.9pp · 2024: -23.1pp
- All cycles
- 2024: R+23.1 2020: R+19.6 2016: R+26.1 2012: R+9.3 2008: R+9.9
Not yet ingested
- Civics
- —
Market trends
- HPI YoY
- ▼ -80.23%
- Current HPI
- 217.7254
- Rent YoY
- —
- Metro
- —
- State GDP YoY
- ▲ 2.60%
- F500 in state
- 92
Industry mix (Fortune 500 HQ in NY)
| Industry | F500 HQs | Revenue |
|---|---|---|
| Financial Services | 10 | $950B |
|
||
| Consumer Goods | 9 | $162B |
|
||
| Insurance | 4 | $225B |
|
||
| Telecommunications | 2 | $144B |
|
||
| Pharmaceuticals | 2 | $112B |
|
||
| Media / Entertainment | 2 | $69B |
|
||
Price history
1 event — show timeline
- 2026-05-28 Listed $139,139 UNYREIS
Property tax history
+7.9%/yrLatest (2025): $5,971 · +4.4% YoY. Source: county tax records.
Cash-flow waterfall
monthlySold comps — $/sqft
last 12 mo · ≤1 miLoading sold comps…