 Multi-family
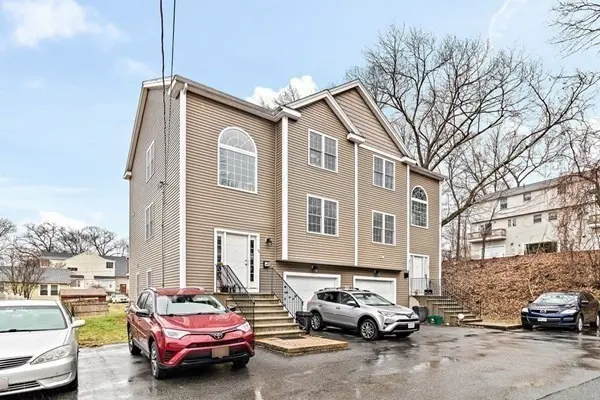
44 Dominion Rd · Worcester, MA
Flood risk 1/10 · Minimal
- FEMA flood zone
- X (unshaded)
- Chance of flooding over 30 yrs
- 0.0%
- Est. flood insurance / yr
- $473 – $860
Fire risk 1/10 · Minimal
- Est. fire insurance / yr
- $915 – $1,699
Heat risk 4/10 · Minor
- Hot days now (above 94°F)
- 7 days/yr
- Hot days in 30 yrs
- 16 days/yr
Wind risk 6/10 · Moderate
- Chance of severe wind over 30 yrs
- 27.0%
Air-quality risk 2/10 · Minimal
- Unhealthy air days now
- 1 days/yr
- Unhealthy air days in 30 yrs
- 2 days/yr
Risk factors via First Street. Map © Google.
Why this score? — see what drove the B- grade
The composite is a weighted blend of 9 inputs, each scored 0–100. Each bar is that input's sub-score; the figure is the points it added to the 100-point composite (weight × sub-score).
- Cash flow +30.0/30.0
- DSCR +10.0/10.0
- 1% rule +9.8/10.0
- ARV discount +7.5/15.0
- Livability +4.4/5.0
- Rent growth +3.7/5.0
- Condition / age +2.5/5.0
- Schools +2.0/10.0
- Appreciation +0.0/10.0
$540,000
🖨 Deal sheet (PDF) 📄 Offer letter ✓ Due diligence
Multi-family units
County records classify this as Multi-Family (2-4 Unit). Listing-text estimate: 1 unit. estimate disagrees with records
Listing remarks MLS
**New Construction - Single Family Attached*** Tri-level Bright & Airy open floor plan. Stainless appliances, kitchen island, deck off living room, 1st floor laundry, cathedral master w/ full bath and walk in closet, hardwood floors throughout, central air, lower level bonus room with 1/2 bath can be a 4th bedroom/home office/family/sitting room w/ sliding doors leading out to private patio. Road to be paved and maintained by town this year. Off Lake Ave. across the street from Lake Quinsigamond Park and next to Umass Hospital/Medical facilities. Easy access to routes 9, 20, 290, 495 and mass pike, public transportation, schools, shopping and restaurants. Not a Condo -- No Condo fees
Key facts
- Hardwood floor
- Open floor plan
- Vaulted ceiling
Tags
Property features AI
Finance
- HOA & community: Community features include public transportation, shopping, parks, medical facility access, highway access, and nearby university
Exterior
- Parking: Attached garage with garage door opener (1 garage space); One covered parking space; Three open/off-street parking spaces; Paved driveway
- Utilities: Public water; Public sewer
- Home design: Single family residence; Attached; Shingle roof; Concrete perimeter foundation; Built (year per public records)
- Construction: Frame construction
- Exterior features: Wood deck; Deck off living area; Lake/pond nearby with public beach access
Interior
- Kitchen: Stainless steel appliances; Range; Microwave; Refrigerator; Hardwood flooring; Open to adjacent living/dining areas
- Bedrooms: Primary bedroom with vaulted ceiling, ceiling fan, walk-in closet, and hardwood flooring; Additional bedrooms with closets, hardwood flooring, and overhead lighting
- Flooring: Hardwood flooring in main living areas and bedrooms; Stone/ceramic tile in bathrooms and laundry
- Bathrooms: Four full bathrooms; Master bathroom (full)
- Heating & cooling: Forced air heating (natural gas); Central air conditioning
- Interior features: Open floorplan; Recessed lighting; Overhead lighting
- Laundry & utility: Washer and dryer; Gas water heater; Laundry area with tile flooring
Neighborhood map
What this means for you Summary
Snapshot
- This is a 3-bed/3.0-bath multifamily listed at $540k.
Deal economics
- At list price, monthly cash flow is $3k ($33k/yr) — positive.
- The deal already cash-flows at list — no discount required.
- Meets the 1% rule at list price ($8k rent vs $540k).
- Recommended offer: $532k (1.5% below list) — sets the bar for market timing.
- Cap rate 12.4% vs local median 4.1% in Worcester — top-decile yield for the area; either an underpriced asset or a hidden risk that comps aren't pricing in. Stress-test before assuming the spread holds.
Location & tenants
- Location reads 87/100 on livability (#9 in MA, #312 nationally) — a professional / high-income tenant draw. Strengths: crime A+, amenities A+, commute A+; Watch: cost of living D.
- Worcester (urban): math 17% / reading 30% proficiency, ranked #280 of 302 in MA (top 93%) — low school quality limits family demand, transient renter base, plan for 1-2y turnover; 66% free/reduced lunch — lower-income household profile, screen leases tightly.
- Zoned schools: Chandler Magnet (math 12% / reading 17%, grade F, #873 of 938 statewide, top 94%, 402 students, 0% FRL); Worcester East Middle (math 9% / reading 14%, grade F, #286 of 305 statewide, top 95%, 740 students, 0% FRL); North High (math 10% / reading 28%, grade F, #313 of 343 statewide, top 92%, 1,377 students, 0% FRL) — zoned schools average 0% FRL vs 66% district-wide (66 pts lower); this property's tenant base skews higher-income than the district average.
- Market conditions: Rents rising fast (+4.8%/yr); 36 active listings in the ZIP; 29 comparable units currently listed for rent nearby; rentals at typical pace (median 25d on market — plan ~3-4 weeks tenant-placement turnaround); 2,293 units permitted in Worcester County in 2024 (1,205 in 5+ unit buildings).
- At $7,995/mo this rent would consume 176% of the median local household income ($55k/yr) (locally 1991% of renters already pay >50% of income on rent) — very limited rent-growth headroom before tenants either downsize or default.
Forward outlook
- Local home prices are declining (-3.0%/yr); year-one equity from $4k of loan paydown is wiped out by about $16k of value loss. Plan a longer hold.
- At projected returns (-3.0% appreciation + 4.8% rent growth), your $151k cash investment doubles in ~6 years — after that, you're playing with house money.
Negotiation context
- It's been on market 17 days — a 2% lower offer ($532k) is reasonable based on typical stale-listing flexibility.
- 3 sale attempts since 12y ago with the ask held roughly flat each time — persistent listings suggest the price (not the market) is what's stuck; bring a comps-based counter.
- Current owner paid $260k; list at $540k implies a 108% gain — meaningful room to come down on a strong offer.
Risks & watch-outs
- Climate carrying-cost: major wind risk, 27% chance of damaging wind over 30y — expect insurance premiums to compound above CPI over the hold.
Questions for the listing agent
- Is there a deadline driving the sale (1031 exchange, divorce, estate, relocation)? That informs how much negotiation room exists.
- What's the average days-on-market for RENTAL listings here right now (not sales)? A rising rental-DOM trend means longer vacancies and softer asking-rent achievability than the comps imply.
- What's the recent tenant-quality profile in this submarket — average credit score on applications, eviction rate, late-payment / NSF rate, and stable-employment percentage? A property-management company in the area should have these aggregated.
- How much new apartment / multifamily construction is in the pipeline within 1–3 miles? Heavy new supply (>2% of stock underway) typically softens rents 12–24 months out; light construction supports rent growth.
Investment metrics
- 1% rule
- 1.48% ✓
- Cap rate
- 12.44%
- Cash-on-cash
- 21.96%
- DSCR
- 1.98
- GRM
- 5.6
CMA / ARV
No comps found within radius.
Projected returns pro-forma
-3.0% appreciation · 4.77% rent growth · sell at horizon
- IRR
- 16.6%
- Equity multiple
- 1.68×
- Total profit
- $103,256
- Equity at exit
- $80,516
- IRR
- 26.4%
- Equity multiple
- 3.50×
- Total profit
- $378,557
- Equity at exit
- $46,689
Cash invested: $151,200 (down + closing). Projections, not guarantees.
Landlord ↔ Tenant lean methodology
- Overall (STATE)
- 20 Strongly Tenant-Friendly
- State Massachusetts
- 20 Strongly Tenant-Friendly · D+15
- County
- — inherits STATE
- City
- — inherits STATE
ZIP-level market 01605
- Home prices YoY
- -21.4%
- Rents YoY
- 4.8%
- Active inventory
- 36
- Price-to-rent
- 20.2×
Monthly cashflow live
- Estimated rent
- $7,995 medium interval (Pro) →
- Mortgage (P&I)
- −$2,832
- Tax from tax record
- −$492 /mo · $5,901/yr
- Insurance
- −$225
- HOA
- −$0
- Vacancy / Maint / Mgmt
- −$1,679
- Net cashflow
- $2,767
Break-even live
Sensitivity live
| Price | -10% $3,073 | -5% $2,920 | +0% $2,767 | +5% $2,615 | +10% $2,462 |
|---|---|---|---|---|---|
| Rent | -10% $2,136 | -5% $2,452 | +0% $2,767 | +5% $3,083 | +10% $3,399 |
| Rate | -1.0pp $3,039 | -0.5pp $2,905 | base $2,767 | +0.5pp $2,628 | +1.0pp $2,485 |
4-unit breakdown (identical units grouped — click to expand)
| Units | Beds | Baths | Est. rent |
|---|---|---|---|
| 2× units | 3 | 2 | $4,454 |
| #1 | 3 | 2 | $2,227 |
| #2 | 3 | 2 | $2,227 |
| 2× units | 1 | 1 | $3,542 |
| #3 | 1 | 1 | $1,771 |
| #4 | 1 | 1 | $1,771 |
| Total (4 units) | $7,995 | ||
UW: 25.0% down · 7.5% · 30yr · 1.5% tax · 5.0% vac · 8.0% maint · 8.0% mgmt
Financing live
Cash to close
- Down payment
- $135,000
- Closing costs
- $16,200
- Reserves months
- —
- Total cash needed
- —
Loan-product check · same deal, 3 products live
Conventional
25% down · 7.5% · 30yr
- Down + closing
- —
- Monthly P&I
- —
- Monthly cashflow
- —
- DSCR
- —
- Eligible?
- —
Personal DTI + credit; lowest rate.
DSCR
20% down · 8.5% · 30yr
- Down + closing
- —
- Monthly P&I
- —
- Monthly cashflow
- —
- DSCR
- —
- Eligible?
- —
No personal income docs; deal must DSCR.
Hard money
10% down · 12.0% · 12mo
- Down + closing
- —
- Monthly P&I
- —
- Monthly cashflow
- —
- DSCR
- —
- Eligible?
- —
Short-term bridge; refi at stabilization.
Rent comps 29 comps
| Address | Beds | Baths | Sqft | Rent | $/sqft | DOM | Units | Dist |
|---|---|---|---|---|---|---|---|---|
| 20 Winneconnett Rd Unit 20 Worcester, MA | 2.0 | 1.0 | 1080 | $2,500 | $2.31 | 45d | 1 | 0.05mi |
| 67 N Quinsigamond Ave #9 Shrewsbury, MA | 3.0 | 2.5 | 1620 | $3,500 | $2.16 | 45d | 1 | 0.30mi |
| 511 Plantation St Worcester, MA | 1.0–2.0 | 1.0–2.0 | 947 | $2,587 | $2.73 | 16d | 40 | 0.53mi |
| 59 Olympia Ave Unit 4A Shrewsbury, MA | 3.0 | 2.5 | 1823 | $4,000 | $2.19 | 16d | 1 | 0.63mi |
| 92 Odonnell Ave #92 Shrewsbury, MA | 2.0 | 2.5 | 2115 | $3,700 | $1.75 | 45d | 1 | 0.69mi |
| 83 Coburn Ave Unit 83 Worcester, MA | 3.0 | 1.5 | 1365 | $3,000 | $2.20 | 45d | 1 | 0.73mi |
| 35 Harrington Ave Shrewsbury, MA | 2.0 | 1.0–2.0 | 907 | $3,560 | $3.93 | 16d | 18 | 0.78mi |
| 147 Lake Ave Unit 147 Worcester, MA | 3.0 | 2.5 | 1408 | $3,200 | $2.27 | 16d | 1 | 0.86mi |
| 132 Coburn Ave Unit 1 Worcester, MA | 3.0 | 1.0 | 1436 | $2,100 | $1.46 | 45d | 1 | 0.87mi |
| 52 Northboro St Unit 1 Worcester, MA | 2.0 | 1.0 | 1200 | $1,600 | $1.33 | 45d | 1 | 0.92mi |
| 308 Plantation St Apt 3 Worcester, MA | 3.0 | 1.0 | 1600 | $2,000 | $1.25 | 25d | 1 | 0.98mi |
| 51 Oriol Dr Worcester, MA | 3.0 | 1.0–2.0 | 936 | $4,360 | $4.66 | 16d | 151 | 1.05mi |
| 27 Granby Rd Apt 2 Worcester, MA | 3.0 | 1.0 | 1240 | $2,300 | $1.85 | 16d | 1 | 1.06mi |
| 383 Shrewsbury St Worcester, MA | 1.0–2.0 | 1.0–2.0 | 895 | $2,895 | $3.23 | 16d | 3 | 1.10mi |
| 285 Plantation St Worcester, MA | 2.0 | 1.0–1.5 | 987 | $2,189 | $2.22 | 16d | 15 | 1.13mi |
| 8 Ellsmere St Unit a Worcester, MA | 3.0 | 2.0 | 1600 | $2,400 | $1.50 | 45d | 1 | 1.19mi |
| 21 Creston St Unit A Worcester, MA | 3.0 | 1.5 | 2030 | $2,800 | $1.38 | 16d | 1 | 1.28mi |
| 92 Stanton St Unit 3 Worcester, MA | 4.0 | 2.0 | 1400 | $2,600 | $1.86 | 25d | 1 | 1.32mi |
| 90 Stanton St Unit 2nd Worcester, MA | 3.0 | 1.0 | 1300 | $2,200 | $1.69 | 16d | 1 | 1.32mi |
| 91 Stanton St Unit 3 Worcester, MA | 2.0 | 1.0 | 1067 | $2,000 | $1.87 | 16d | 1 | 1.34mi |
| 10 Marshall St Unit 2 Worcester, MA | 3.0 | 1.0 | 1300 | $2,275 | $1.75 | 25d | 1 | 1.36mi |
| 15 Ancona Rd Unit 1 Worcester, MA | 3.0 | 1.0 | 1538 | $2,999 | $1.95 | 45d | 1 | 1.39mi |
| 119 Rodney St Unit 2 Worcester, MA | 3.0 | 1.0 | 1100 | $2,200 | $2.00 | 45d | 1 | 1.39mi |
| 112 Rodney St Unit 1 Worcester, MA | 3.0 | 1.0 | 1280 | $2,000 | $1.56 | 25d | 1 | 1.42mi |
| 586 Franklin St Unit 1 Worcester, MA | 2.0 | 1.0 | 1116 | $1,965 | $1.76 | 45d | 1 | 1.42mi |
| 22 Wakefield St Unit 2 Worcester, MA | 2.0 | 1.0 | 1280 | $2,300 | $1.80 | 16d | 1 | 1.43mi |
| 30 Denmark St Worcester, MA | 4.0 | 2.0 | 1600 | $3,300 | $2.06 | 25d | 1 | 1.47mi |
| 4 Linda Cir Unit 1 Shrewsbury, MA | 2.0 | 1.0 | 1300 | $2,200 | $1.69 | 45d | 1 | 1.47mi |
| 9 Brookdale St Unit 2 Worcester, MA | 3.0 | 1.0 | 1210 | $2,200 | $1.82 | 23d | 1 | 1.47mi |
Listing history 12 events
-
2026-06-22days on market $540,000 Active 17 DOM
-
2026-06-18days on market $540,000 Active 14 DOM
-
2026-06-17days on market $540,000 Active 13 DOM
-
2026-06-16days on market $540,000 Active 12 DOM
-
2026-06-15days on market $540,000 Active 11 DOM
-
2026-06-14days on market $540,000 Active 9 DOM
-
2026-06-10days on market $540,000 Active 6 DOM
-
2026-06-09days on market $540,000 Active 5 DOM
-
2026-06-08statusdays on market $540,000 Active 4 DOM
-
2026-06-07days on market $540,000 New 3 DOM
-
2026-06-05remarks 699-char remark
-
2026-06-05$540,000 New 1 DOM
ⓘ Source: listings_history table (triggers on properties + properties_extension) + one-shot
backfill from property_details.listing_events for pre-trigger history.
Tax reassessment forecast MA · Partial reset (capped growth)
- Current annual tax
- $5,901 · $492/mo
- Projected year-2 tax
- $6,272 · $523/mo
- Expected delta
- +$370/yr (+$31/mo · 6.3%)
ⓘ Screening estimate from a state-policy table — verify with the county assessor before closing.
Climate risk First Street
- Flood 1/10 Low FEMA zone X (unshaded) · 0% chance over 30 yrs
- Wildfire 1/10 Low
- Heat 4/10 Moderate 7 d/yr ≥94°F today · 16 d/yr by 30 yrs out
- Wind 6/10 Major 27% chance of damaging wind over 30 yrs
- Air quality 2/10 Low 1 unhealthy d/yr today · 2 by 30 yrs out
Nearby sold comps map
Loading sold comps map…
Walkable amenities ~0.75 mi
Loading nearby amenities…
Taxation est. · year 1
- Rental income
- $95,940
- − Mortgage interest
- −$30,248
- − Property taxes
- −$5,901
- − Insurance
- −$2,700
- − Repairs & maintenance
- −$7,675
- − Management
- −$7,675
- − Depreciation
- −$15,709
- Taxable income
- $26,031
- Est. tax owed @ 24.0%
- −$6,247
- After-tax cash flow
- $26,962/yr
For passive investors: Depreciation is non-cash, so a rental often shows a tax loss while cash-flowing — sheltering income. Rental losses are passive: they offset passive income freely, and up to $25,000/yr can offset ordinary (W-2) income if you actively participate and your MAGI is under $100k (phasing out to $0 by $150k); unused losses carry forward. On sale, claimed depreciation is recaptured at up to 25%, and gains may owe capital-gains tax (a 1031 exchange can defer both). Figures are a year-1 estimate at your 24.0% rate — not tax advice; consult a CPA.
Schools (NCES district)
- District
- Worcester
- NCES district ID
- 2513230
- Math proficiency
- 17% ▼ -15.00%
- Reading proficiency
- 30% ▼ -8.00%
- Median HH income
- $45,063
- Composite
- 20.3/100
- National rank
- #8615
- State rank
- #280 of 302 in MA
Livability — Worcester
- Score
- 87/100
- State rank
- #9
- US rank
- #312
Category grades
Schools grade is shown separately in the Schools card above.
Census & demographics
- Census place
- Worcester, MA
- County
- Worcester County · 487,911 people
- City population
- 207,324
- Metro
- Worcester, MA-CT
- Population (ZIP)
- 30,579
- Household income
- $54,642
- Rent vs Own
- Severe rent burden
- 1991.0
Population outlook (Worcester County) Hauer SSP2
- Today (2025)
- 850,858 people
- By 2030
- 860,403 · +1.1%
- By 2040
- 869,902 · +2.2%
- By 2050
- 869,110 · +2.1%
- By 2075
- 870,120 · +2.3%
- By 2100
- 829,703 · -2.5%
Race, ethnicity, and origin ACS 2023
- Neighborhood character
- Diverse neighborhood (Simpson 0.68)
- Race & ethnicity
- White 44% Hispanic / Latino 34% Two or more races 19% Black 13% Asian 5%
- Hispanic origin (detail)
- Puerto Rican 24% Dominican 5%
- Common ancestry
- Lithuanian 4% Estonian 2% Romanian 2%
- Foreign-born
- 23% · Canada, Vietnam, China
- Languages at home
- 54% English-only · Spanish 27% Other Indo-European 5% Arabic 3%
Political lean MEDSL · Worcester
- 2024 margin
- D (+10.0) · D 53.9% · R 43.9% · Other 2.2%
- 2008→2024 swing
- -3.8pp toward R · 2008: 13.8pp · 2024: 10.0pp
- All cycles
- 2024: D+10.0 2020: D+17.8 2016: D+10.5 2012: D+9.2 2008: D+13.8
Not yet ingested
- Civics
- —
Market trends
- HPI YoY
- ▼ -85.79%
- Current HPI
- 314.391
- Rent YoY
- ▲ 4.77%
- Metro
- Worcester, MA-CT
- State GDP YoY
- ▲ 2.28%
- F500 in state
- 38
Industry mix (Fortune 500 HQ in MA)
| Industry | F500 HQs | Revenue |
|---|---|---|
| Technology | 3 | $17B |
|
||
| Insurance | 2 | $84B |
|
||
| Retail | 2 | $76B |
|
||
| Life Sciences | 1 | $43B |
|
||
| Energy Technology | 1 | $31B |
|
||
| Aerospace / Defense | 1 | $18B |
|
||
Price history
+93.5% since first listed10 events — show timeline
- 2026-06-04 Listed $540,000 MLS PIN
- 2025-08-03 Rental Removed $4,500 MLSPIN
- 2025-06-20 Listed for Rent $4,500 MLSPIN
- 2014-10-09 Sold (MLS) $260,000 MLS PIN
- 2014-07-21 Contingent — MLS PIN
- 2014-07-11 Price Changed $269,450 MLS PIN
- 2014-06-30 Price Changed $269,500 MLS PIN
- 2014-06-10 Price Changed $269,899 MLS PIN
- 2014-06-05 Price Changed $269,900 MLS PIN
- 2014-05-29 Listed $279,000 MLS PIN
Property tax history
+2.0%/yrLatest (2023): $5,901 · +10.1% YoY. Source: county tax records.
Cash-flow waterfall
monthlySold comps — $/sqft
last 12 mo · ≤1 miLoading sold comps…