 🏗️ New Construction
Accolade Plan · Manchester, NY
Flood risk 1/10 · Minimal
- FEMA flood zone
- X
- Chance of flooding over 30 yrs
- 0.0%
- Est. flood insurance / yr
- $473 – $860
Fire risk 2/10 · Minimal
- Est. fire insurance / yr
- $691 – $1,283
Heat risk 2/10 · Minimal
- Hot days now (above 96°F)
- 7 days/yr
- Hot days in 30 yrs
- 16 days/yr
Wind risk 1/10 · Minimal
- Chance of severe wind over 30 yrs
- —
Air-quality risk 2/10 · Minimal
- Unhealthy air days now
- 1 days/yr
- Unhealthy air days in 30 yrs
- 1 days/yr
Risk factors via First Street. Map © Google.
Why this score? — see what drove the B grade
The composite is a weighted blend of 9 inputs, each scored 0–100. Each bar is that input's sub-score; the figure is the points it added to the 100-point composite (weight × sub-score).
- Cash flow +29.5/30.0
- DSCR +10.0/10.0
- 1% rule +8.3/10.0
- ARV discount +7.5/15.0
- Condition / age +5.0/5.0
- Schools +4.5/10.0
- Livability +3.4/5.0
- Rent growth +2.5/5.0
- Appreciation +1.9/10.0
$79,900
🖨 Deal sheet (PDF) 📄 Offer letter ✓ Due diligence
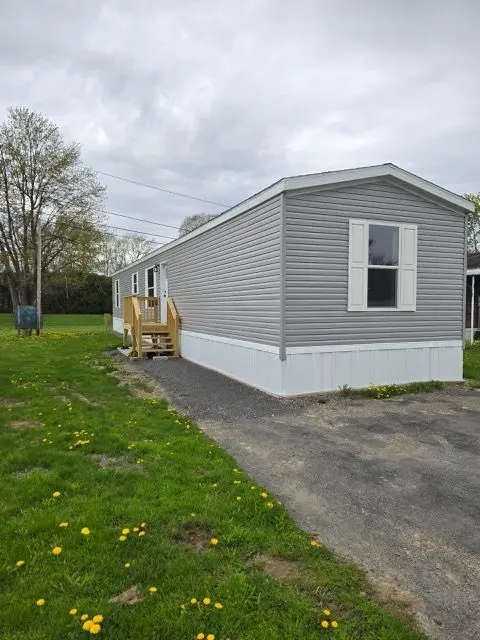
Listing remarks
Brand new and move-in ready, this three-bedroom home offers an open floor plan designed for real living, whether that's Sunday mornings with the family or quiet evenings with a view of the fields stretching out behind you. A full appliance package is already in place, so you can settle in without the hassle.
Key facts
- Listed 17 days
Property features AI
Finance
- Other: Living area of 980 (unit omitted as requested)
- Financial info: List price $79,900
Exterior
- Utilities: Propane heating (utility)
- Home design: Single-family plan (Accolade)
- Construction: New construction (2026 listing)
- Exterior features: Asphalt roof
Interior
- Bedrooms: 3 bedrooms
- Bathrooms: 2 full bathrooms
- Heating & cooling: Propane heating
- Interior features: Plan named Accolade (new construction plan)
Neighborhood map
What this means for you Summary
Snapshot
- This is a 3-bed/2.0-bath manufactured listed at $80k. Condition is rated excellent.
Deal economics
- At list price, monthly cash flow is $415 ($5k/yr) — positive.
- The deal already cash-flows at list — no discount required.
- Meets the 1% rule at list price ($2k rent vs $80k).
- Recommended offer: $79k (1.5% below list) — sets the bar for market timing.
Location & tenants
- Location reads 68/100 on livability (#562 in NY) — a middle-class / working-renter tenant base. Strengths: cost of living A+, housing A+, health & safety A; Watch: schools D, employment D, amenities F.
- Manchester-Shortsville Central School District (Red Jacket) (rural): math 49% / reading 54% proficiency, ranked #343 of 590 in NY (top 58%) — acceptable for families but not a draw, mixed tenant base, ~2y average lease.
- Market conditions: 11 active listings in the ZIP; 284 units permitted in Ontario County in 2024 (69 in 5+ unit buildings).
Forward outlook
- Local home prices are declining (-3.0%/yr); year-one equity from $800 of loan paydown is wiped out by about $3k of value loss. Plan a longer hold.
- Ontario County population projected to shrink 6% by 2050 — rents likely to lag national; underwrite the cash flow, not the appreciation.
- At projected returns (-3.0% appreciation + 3.0% rent growth), your $32k cash investment doubles in ~8 years — after that, you're playing with house money.
Negotiation context
- It's been on market 17 days — a 2% lower offer ($79k) is reasonable based on typical stale-listing flexibility.
Questions for the listing agent
- Is there a deadline driving the sale (1031 exchange, divorce, estate, relocation)? That informs how much negotiation room exists.
- Schools are D-rated, which usually means shorter tenancies and higher turnover. Who's the typical renter profile here, and what's been the actual vacancy rate?
- What's the average days-on-market for RENTAL listings here right now (not sales)? A rising rental-DOM trend means longer vacancies and softer asking-rent achievability than the comps imply.
- What's the recent tenant-quality profile in this submarket — average credit score on applications, eviction rate, late-payment / NSF rate, and stable-employment percentage? A property-management company in the area should have these aggregated.
- How much new for-sale + rental construction is in the pipeline within 1–3 miles? Heavy new supply typically softens prices + rents 12–24 months out; constrained supply supports both.
Investment metrics
- 1% rule
- 1.33% ✓
- Cap rate
- 10.60%
- Cash-on-cash
- 15.37%
- DSCR
- 1.68
- GRM
- 6.3
CMA / ARV
- ARV (on-the-fly)
- $115,640
- Comps found
- 2
Show comp detail 2 sales within ~0.75 mi
| Address | Dist | Beds/Ba | Sqft | Sold | Price | $/sf | Match |
|---|---|---|---|---|---|---|---|
| 3872 Outlet Rd #21 | 0.67mi | 3/1.0 | 980 (0%) | 17mo | $18,500 | $19 | 51 |
| 3538 Route 96 | 0.60mi | 3/2.0 | 1,104 (+13%) | 3mo | $130,000 | $118 | 49 |
Match score weights: distance 35% · size 25% · config 20% · recency 20%. Top-matched comps best support the ARV.
Projected returns pro-forma
-3.0% appreciation · 3.0% rent growth · sell at horizon
- IRR
- 6.1%
- Equity multiple
- 1.24×
- Total profit
- $7,700
- Equity at exit
- $17,242
- IRR
- 15.5%
- Equity multiple
- 2.26×
- Total profit
- $40,813
- Equity at exit
- $9,998
Cash invested: $32,379 (down + closing). Projections, not guarantees.
Landlord ↔ Tenant lean methodology
- Overall (STATE)
- 15 Strongly Tenant-Friendly
- State New York
- 15 Strongly Tenant-Friendly · D+10
- County
- — inherits STATE
- City
- — inherits STATE
ZIP-level market 14548
- Home prices YoY
- -2.2%
- Active inventory
- 11
- Price-to-rent
- 4.3×
Monthly cashflow live
- Estimated rent
- $1,537 medium interval (Pro) →
- Mortgage (P&I)
- −$606
- Tax est. 1.5%
- −$145 /mo · $1,735/yr
- Insurance
- −$48
- HOA
- −$0
- Vacancy / Maint / Mgmt
- −$323
- Net cashflow
- $415
Break-even live
Sensitivity live
| Price | -10% $495 | -5% $455 | +0% $415 | +5% $375 | +10% $335 |
|---|---|---|---|---|---|
| Rent | -10% $293 | -5% $354 | +0% $415 | +5% $475 | +10% $536 |
| Rate | -1.0pp $473 | -0.5pp $444 | base $415 | +0.5pp $385 | +1.0pp $354 |
UW: 25.0% down · 7.5% · 30yr · 1.5% tax · 5.0% vac · 8.0% maint · 8.0% mgmt
Financing live
Cash to close
- Down payment
- $28,910
- Closing costs
- $3,469
- Reserves months
- —
- Total cash needed
- —
Loan-product check · same deal, 3 products live
Conventional
25% down · 7.5% · 30yr
- Down + closing
- —
- Monthly P&I
- —
- Monthly cashflow
- —
- DSCR
- —
- Eligible?
- —
Personal DTI + credit; lowest rate.
DSCR
20% down · 8.5% · 30yr
- Down + closing
- —
- Monthly P&I
- —
- Monthly cashflow
- —
- DSCR
- —
- Eligible?
- —
No personal income docs; deal must DSCR.
Hard money
10% down · 12.0% · 12mo
- Down + closing
- —
- Monthly P&I
- —
- Monthly cashflow
- —
- DSCR
- —
- Eligible?
- —
Short-term bridge; refi at stabilization.
Listing history 14 events
-
2026-06-18days on market $79,900 Active 17 DOM
-
2026-06-17days on market $79,900 Active 16 DOM
-
2026-06-16days on market $79,900 Active 15 DOM
-
2026-06-15days on market $79,900 Active 14 DOM
-
2026-06-13days on market $79,900 Active 12 DOM
-
2026-06-13days on market $79,900 Active 11 DOM
-
2026-06-10days on market $79,900 Active 9 DOM
-
2026-06-09days on market $79,900 Active 8 DOM
-
2026-06-09days on market $79,900 Active 7 DOM
-
2026-06-07days on market $79,900 Active 6 DOM
-
2026-06-05days on market $79,900 Active 3 DOM
-
2026-06-03days on market $79,900 Active 2 DOM
-
2026-06-02remarks 309-char remark
-
2026-06-02$79,900 Active 1 DOM
ⓘ Source: listings_history table (triggers on properties + properties_extension) + one-shot
backfill from property_details.listing_events for pre-trigger history.
Climate risk First Street
- Flood 1/10 Low FEMA zone X · 0% chance over 30 yrs
- Wildfire 2/10 Low
- Heat 2/10 Low 7 d/yr ≥96°F today · 16 d/yr by 30 yrs out
- Wind 1/10 Low
- Air quality 2/10 Low 1 unhealthy d/yr today · 1 by 30 yrs out
Nearby sold comps map
Loading sold comps map…
Walkable amenities ~0.75 mi
Loading nearby amenities…
Taxation est. · year 1
- Rental income
- $18,439
- − Mortgage interest
- −$6,478
- − Property taxes
- −$1,735
- − Insurance
- −$578
- − Repairs & maintenance
- −$1,475
- − Management
- −$1,475
- − Depreciation
- −$3,364
- Taxable income
- $3,334
- Est. tax owed @ 24.0%
- −$800
- After-tax cash flow
- $4,177/yr
For passive investors: Depreciation is non-cash, so a rental often shows a tax loss while cash-flowing — sheltering income. Rental losses are passive: they offset passive income freely, and up to $25,000/yr can offset ordinary (W-2) income if you actively participate and your MAGI is under $100k (phasing out to $0 by $150k); unused losses carry forward. On sale, claimed depreciation is recaptured at up to 25%, and gains may owe capital-gains tax (a 1031 exchange can defer both). Figures are a year-1 estimate at your 24.0% rate — not tax advice; consult a CPA.
Condition & rehab AI · 12 photos
This move-in ready manufactured home is in excellent condition with new appliances, flooring, and fixtures. It offers a good investment opportunity with minimal maintenance required.
Value-add opportunities
- Both Landscaping and curb appeal improvements — Enhances curb appeal and can increase both resale and rental value.
Renovation cost estimate screening
Value-add ROI direction
- Both Landscaping and curb appeal improvements — Enhances curb appeal and can increase both resale and rental value. ↑
ⓘ Cost ranges are severity-bucket heuristics (US national rule-of-thumb). Get contractor quotes + a written scope before underwriting a rehab budget.
Schools (NCES district)
- District
- Manchester-Shortsville Central School District (Red Jacket)
- NCES district ID
- 3624270
- Math proficiency
- 49% ▼ -6.00%
- Reading proficiency
- 54% ▲ 11.00%
- Median HH income
- $56,758
- Composite
- 44.66/100
- National rank
- #2768
- State rank
- #343 of 590 in NY
Livability — Manchester
- Score
- 68/100
- State rank
- #562
- US rank
- #10095
Category grades
Schools grade is shown separately in the Schools card above.
Census & demographics
- City population
- 1,655
- Population (ZIP)
- 3,695
Population outlook (Ontario County) Hauer SSP2
- Today (2025)
- 111,230 people
- By 2030
- 111,401 · +0.2%
- By 2040
- 109,535 · -1.5%
- By 2050
- 104,895 · -5.7%
- By 2075
- 92,999 · -16.4%
- By 2100
- 73,723 · -33.7%
Race, ethnicity, and origin ACS 2023
- Neighborhood character
- Predominantly White (90%)
- Race & ethnicity
- White 90% Hispanic / Latino 3% Two or more races 2%
- Common ancestry
- Romanian 4% Iranian 4% Italian 3%
- Foreign-born
- 3% · Canada
- Languages at home
- 94% English-only · Spanish 4% Other Indo-European 1%
Political lean MEDSL · Ontario
- 2024 margin
- Toss-up / Even · D 49.4% · R 50.6%
- 2008→2024 swing
- -1.0pp toward R · 2008: -0.1pp · 2024: -1.2pp
- All cycles
- 2024: R+1.2 2020: R+0.0 2016: R+8.6 2012: R+1.6 2008: R+0.1
Not yet ingested
- Civics
- —
Market trends
- HPI YoY
- ▼ -6.14%
- Current HPI
- 269.6522
- Rent YoY
- —
- Metro
- —
- State GDP YoY
- ▲ 2.60%
- F500 in state
- 92
Industry mix (Fortune 500 HQ in NY)
| Industry | F500 HQs | Revenue |
|---|---|---|
| Financial Services | 10 | $950B |
|
||
| Consumer Goods | 9 | $162B |
|
||
| Insurance | 4 | $225B |
|
||
| Telecommunications | 2 | $144B |
|
||
| Pharmaceuticals | 2 | $112B |
|
||
| Media / Entertainment | 2 | $69B |
|
||
Cash-flow waterfall
monthlySold comps — $/sqft
last 12 mo · ≤1 miLoading sold comps…