6218 Silver Maple Way · Wylie, TX
Flood risk 1/10 · Minimal
- FEMA flood zone
- X (unshaded)
- Chance of flooding over 30 yrs
- 0.0%
- Est. flood insurance / yr
- $507 – $1,088
Fire risk 3/10 · Minor
- Est. fire insurance / yr
- $1,222 – $2,270
Heat risk 7/10 · Major
- Hot days now (above 110°F)
- 7 days/yr
- Hot days in 30 yrs
- 23 days/yr
Wind risk 6/10 · Moderate
- Chance of severe wind over 30 yrs
- 27.0%
Air-quality risk 3/10 · Minor
- Unhealthy air days now
- 3 days/yr
- Unhealthy air days in 30 yrs
- 3 days/yr
Risk factors via First Street. Map © Google.
Why this score? — see what drove the D- grade
The composite is a weighted blend of 9 inputs, each scored 0–100. Each bar is that input's sub-score; the figure is the points it added to the 100-point composite (weight × sub-score).
- Cash flow +11.6/30.0
- ARV discount +8.2/15.0
- Schools +4.2/10.0
- 1% rule +3.6/10.0
- Livability +3.5/5.0
- DSCR +3.4/10.0
- Rent growth +2.2/5.0
- Condition / age +1.0/5.0
- Appreciation +0.0/10.0
$221,990
🖨 Deal sheet (PDF) 📄 Offer letter ✓ Due diligence
Listing remarks
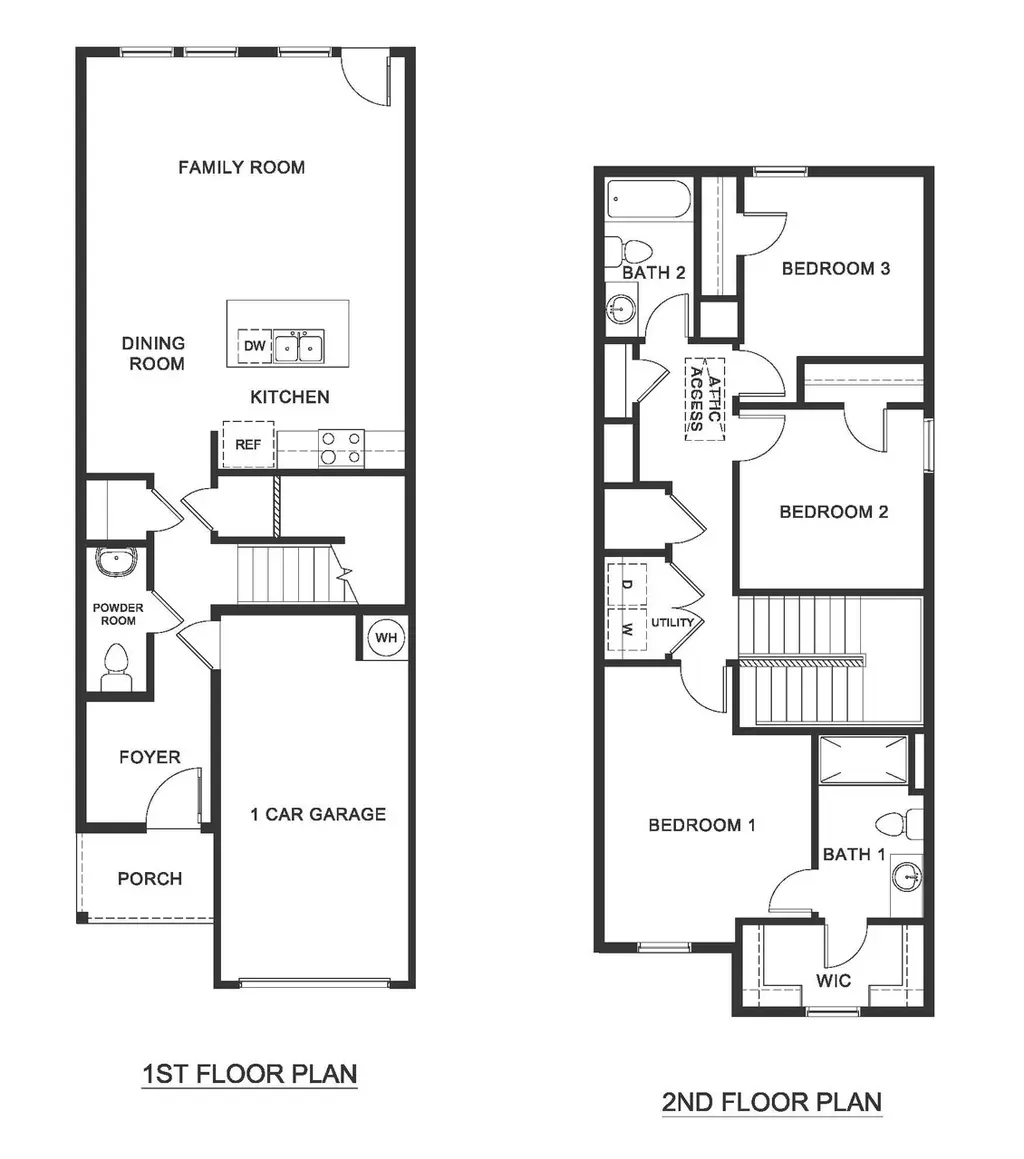
Step into the Linnet, one of our floorplans featuring a seamless blend of modern design and functionality at our new home community Arbor Trails in Princeton, TX. This two story offers 3 bedrooms, 2.5 bath, 1 car garage floorplan with 9' Ceilings. The first level showcases the kitchen and family room. On the second floor are three spacious bedrooms as well as 2 baths. The kitchen features quality cabinets with hidden hinges and crown molding, hard surface countertops, kitchen island and stainless steel range and dishwasher, which are sure to make meal prep easy. In every bedroom you'll have carpeted floors and a closet in each room. Call today to make Arbor Trails your home! Photos shown he
Key facts
- 3,572 sq ft lot
- Garage
- Built 2026
Property features AI
Finance
- Other: Address: 6218 Silver Maple Way, Princeton, TX 75407; Listing status: Active; Last modified: 2026-06-09
- Financial info: List price $221,990
Exterior
- Parking: 1 garage space (1 total parking space)
- Home design: Single-family property; Spec home
- Exterior features: Living area approximately 1,419
Interior
- Bedrooms: 3 bedrooms
- Bathrooms: 2 full bathrooms and 1 half bathroom (2.5 total)
- Interior features: Spec-built Linnet plan
Neighborhood map
What this means for you Summary
Snapshot
- This is a 3-bed/2.5-bath single-family listed at $222k. Condition is rated poor.
Deal economics
- At list price, monthly cash flow is $-69 ($-831/yr) — negative.
- To cash-flow at today's rent, offer at most $212k (4.5% below list).
- To meet the 1% rule (rent ≥ 1% of price), the offer needs to be $191k (14.1% below list).
- Recommended offer: $191k (14.1% below list) — sets the bar for 1% rule.
- Cap rate 5.9% vs local median 4.0% in Wylie — top-decile yield for the area; either an underpriced asset or a hidden risk that comps aren't pricing in. Stress-test before assuming the spread holds.
Location & tenants
- Location reads 69/100 on livability (#419 in TX) — a middle-class / working-renter tenant base. Strengths: crime A+, employment A+, housing A+; Watch: amenities F, commute F, health & safety F.
- Princeton ISD (suburban): math 51% / reading 47% proficiency, ranked #188 of 826 in TX (top 23%) — families likely to look elsewhere, expect single-tenant / working-renter base with shorter leases.
- Zoned schools: Harper El (math 50% / reading 41%, grade D-, #1,112 of 4,322 statewide, top 26%, 436 students, 56% FRL); Clark Middle (math 53% / reading 42%, grade C-, #408 of 1,662 statewide, top 25%, 707 students, 66% FRL); Princeton H S (math 52% / reading 54%, grade C-, #437 of 1,632 statewide, top 27%, 1,521 students, 57% FRL) — zoned schools at 60% FRL track the district average.
- Market conditions: Rents soft (-1.0%/yr); 1410 active listings in the ZIP; 40 comparable units currently listed for rent nearby; rentals at typical pace (median 24d on market — plan ~3-4 weeks tenant-placement turnaround); solid renter incomes; 19,194 units permitted in Collin County in 2024 (3,988 in 5+ unit buildings).
Forward outlook
- Local home prices are declining (-3.0%/yr); year-one equity from $2k of loan paydown is wiped out by about $7k of value loss. Plan a longer hold.
- Collin County population projected at +60% by 2050 — long-run rental-demand tailwind backs the buy-and-hold thesis.
Negotiation context
- Only 11 days on market — expect competitive offers; lowballing is unlikely to land.
Risks & watch-outs
- Climate carrying-cost: major wind risk, 27% chance of damaging wind over 30y; extreme-heat days projected 7→23/yr by 2055 (HVAC capex compounding) — expect insurance premiums to compound above CPI over the hold.
Questions for the listing agent
- What do current leases actually rent for vs. the listed asking? Can we see a recent rent roll and the last 12 months of T-12 income?
- Have any recent inspections been done? Can we get a copy of the seller's disclosures and any deferred-maintenance estimates?
- What does the HOA fee cover, when was the last increase, and are there any pending special assessments or reserve-fund shortfalls?
- Is there a deadline driving the sale (1031 exchange, divorce, estate, relocation)? That informs how much negotiation room exists.
- Schools are B-rated — typically a magnet for longer-tenancy family renters. What's the average tenant stay here, and is there a school-zone premium baked into asking?
- The area grade is low — what's the realistic commute time and amenity access for the typical tenant pool here? Any planned neighborhood developments (good or bad) we should know about?
- What's the average days-on-market for RENTAL listings here right now (not sales)? A rising rental-DOM trend means longer vacancies and softer asking-rent achievability than the comps imply.
- What's the recent tenant-quality profile in this submarket — average credit score on applications, eviction rate, late-payment / NSF rate, and stable-employment percentage? A property-management company in the area should have these aggregated.
- How much new for-sale + rental construction is in the pipeline within 1–3 miles? Heavy new supply typically softens prices + rents 12–24 months out; constrained supply supports both.
Investment metrics
- 1% rule
- 0.86% ✗
- Cap rate
- 5.92%
- Cash-on-cash
- -1.34%
- DSCR
- 0.94
- GRM
- 9.7
CMA / ARV
- ARV (on-the-fly)
- $225,621
- Comps found
- 12
Show comp detail 12 sales within ~0.75 mi
| Address | Dist | Beds/Ba | Sqft | Sold | Price | $/sf | Match |
|---|---|---|---|---|---|---|---|
| 6110 Pinion Trl | 0.23mi | 3/2.5 | 1,419 (0%) | 1mo | $229,990 | $162 | 88 |
| 416 Sandhill Crane Ln | 0.22mi | 3/2.0 | 1,402 (-1%) | 0mo | $221,999 | $158 | 86 |
| 6412 Longspur Ln | 0.22mi | 3/2.0 | 1,402 (-1%) | 0mo | $222,999 | $159 | 86 |
| 6413 Longspur Ln | 0.23mi | 3/2.0 | 1,411 (-1%) | 1mo | $215,000 | $152 | 85 |
| 6308 Sandpiper Ln | 0.18mi | 3/2.5 | 1,360 (-4%) | 1mo | $217,999 | $160 | 84 |
| 6414 Willet Rd | 0.25mi | 3/2.0 | 1,402 (-1%) | 1mo | $252,999 | $180 | 83 |
| 6508 Glade St | 0.30mi | 3/2.0 | 1,402 (-1%) | 1mo | $222,999 | $159 | 81 |
| 403 Shearwater Ave | 0.32mi | 3/2.0 | 1,402 (-1%) | 2mo | $253,674 | $181 | 80 |
| 6314 Sandpiper Ln | 0.19mi | 4/2.5 (+1) | 1,535 (+8%) | 1mo | $207,999 | $136 | 72 |
| 721 Wagtail Dr | 0.22mi | 4/2.5 (+1) | 1,535 (+8%) | 2mo | $209,999 | $137 | 70 |
| 6100 Pinion Trl | 0.23mi | 4/2.5 (+1) | 1,549 (+9%) | 1mo | $237,490 | $153 | 68 |
| 6728 Teal Cir | 0.55mi | 3/2.0 | 1,268 (-11%) | 0mo | $239,999 | $189 | 54 |
Match score weights: distance 35% · size 25% · config 20% · recency 20%. Top-matched comps best support the ARV.
Projected returns pro-forma
-3.0% appreciation · 0.0% rent growth · sell at horizon
- IRR
- -22.0%
- Equity multiple
- 0.26×
- Total profit
- $-45,919
- Equity at exit
- $33,099
- IRR
- -26.0%
- Equity multiple
- -0.08×
- Total profit
- $-67,047
- Equity at exit
- $19,194
Cash invested: $62,157 (down + closing). Projections, not guarantees.
Landlord ↔ Tenant lean methodology
- Overall (STATE)
- 87 Strongly Landlord-Friendly
- State Texas
- 87 Strongly Landlord-Friendly · R+5
- County
- — inherits STATE
- City
- — inherits STATE
ZIP-level market 75407
- Home prices YoY
- -30.3%
- Rents YoY
- -1.0%
- Active inventory
- 1410
- Price-to-rent
- 9.7×
Monthly cashflow live
- Estimated rent
- $1,907 high interval (Pro) →
- Mortgage (P&I)
- −$1,164
- Tax est. 1.5%
- −$277 /mo · $3,330/yr
- Insurance
- −$92
- HOA
- −$42
- Vacancy / Maint / Mgmt
- −$401
- Net cashflow
- $-69
Break-even live
Sensitivity live
| Price | -10% $84 | -5% $7 | +0% $-69 | +5% $-146 | +10% $-223 |
|---|---|---|---|---|---|
| Rent | -10% $-220 | -5% $-145 | +0% $-69 | +5% $6 | +10% $81 |
| Rate | -1.0pp $43 | -0.5pp $-13 | base $-69 | +0.5pp $-127 | +1.0pp $-185 |
UW: 25.0% down · 7.5% · 30yr · 1.5% tax · 5.0% vac · 8.0% maint · 8.0% mgmt
Financing live
Cash to close
- Down payment
- $55,498
- Closing costs
- $6,660
- Reserves months
- —
- Total cash needed
- —
Loan-product check · same deal, 3 products live
Conventional
25% down · 7.5% · 30yr
- Down + closing
- —
- Monthly P&I
- —
- Monthly cashflow
- —
- DSCR
- —
- Eligible?
- —
Personal DTI + credit; lowest rate.
DSCR
20% down · 8.5% · 30yr
- Down + closing
- —
- Monthly P&I
- —
- Monthly cashflow
- —
- DSCR
- —
- Eligible?
- —
No personal income docs; deal must DSCR.
Hard money
10% down · 12.0% · 12mo
- Down + closing
- —
- Monthly P&I
- —
- Monthly cashflow
- —
- DSCR
- —
- Eligible?
- —
Short-term bridge; refi at stabilization.
Rent comps 40 comps
| Address | Beds | Baths | Sqft | Rent | $/sqft | DOM | Units | Dist |
|---|---|---|---|---|---|---|---|---|
| 623 Linden Rd Princeton, TX | 3.0 | 2.5 | 1419 | $1,650 | $1.16 | 45d | 1 | 0.14mi |
| 6222 Sandpiper Ln Unit NA Princeton, TX | 3.0 | 2.5 | 1400 | $1,750 | $1.25 | 9d | 1 | 0.14mi |
| 600 Sandhill Crane Ln Princeton, TX | 3.0 | 2.0 | 1402 | $2,100 | $1.50 | 14d | 1 | 0.15mi |
| 6310 Sandpiper Ln Princeton, TX | 4.0 | 2.5 | 1549 | $2,030 | $1.31 | 13d | 1 | 0.18mi |
| 6311 Whimbrel Way Princeton, TX | 4.0 | 2.5 | 1535 | $1,775 | $1.16 | 0d | 1 | 0.20mi |
| 6018 Primrose Rd , TX | 3.0–4.0 | 2.5 | 1484 | $1,800 | $1.21 | 4d | 5 | 0.21mi |
| 724 Wagtail Dr Princeton, TX | 3.0 | 2.5 | 1360 | $1,650 | $1.21 | 0d | 1 | 0.21mi |
| 724 Wagtail Dr Princeton, TX | 3.0 | 2.5 | 1360 | $1,675 | $1.23 | 4d | 1 | 0.21mi |
| 721 Wagtail Dr Princeton, TX | 4.0 | 2.5 | 1535 | $1,600 | $1.04 | 26d | 1 | 0.21mi |
| 6102 Pinion Trl , TX | 3.0 | 2.5 | 1419 | $1,600 | $1.13 | 45d | 1 | 0.22mi |
| 732 Sandhill Crane Ln Princeton, TX | 4.0 | 2.5 | 1570 | $1,875 | $1.19 | 13d | 1 | 0.23mi |
| 6015 Pinion Trl , TX | 4.0 | 2.5 | 1615 | $1,950 | $1.21 | 45d | 1 | 0.23mi |
| 801 Wagtail Dr , TX | 4.0 | 2.5 | 1535 | $1,975 | $1.29 | 9d | 1 | 0.27mi |
| 803 Wagtail Dr , TX | 3.0 | 2.5 | 1360 | $1,605 | $1.18 | 23d | 1 | 0.27mi |
| 812 Sandhill Crane Ln Princeton, TX | 3.0 | 2.5 | 1309 | $1,850 | $1.41 | 45d | 1 | 0.28mi |
| 6505 Glade St Princeton, TX | 4.0 | 2.0 | 1600 | $1,800 | $1.12 | 45d | 1 | 0.30mi |
| 6225 Kingfisher Way Princeton, TX | 3.0 | 2.5 | 1290 | $1,625 | $1.26 | 6d | 1 | 0.30mi |
| 241 Boxberry Way Princeton, TX | 3.0 | 2.0 | 1411 | $1,725 | $1.22 | 45d | 1 | 0.31mi |
| 6313 Kingfisher Way Princeton, TX | 3.0 | 3.0 | 1360 | $1,650 | $1.21 | 45d | 1 | 0.33mi |
| 910 Wood Stork Way Princeton, TX | 2.0 | 2.5 | 1022 | $1,700 | $1.66 | 20d | 1 | 0.34mi |
| 905 Blue Heron Dr Princeton, TX | 4.0 | 2.5 | 1535 | $1,775 | $1.16 | 26d | 1 | 0.35mi |
| 905 Blue Heron Dr Princeton, TX | 4.0 | 2.5 | 1535 | $1,775 | $1.16 | 23d | 1 | 0.35mi |
| 904 Sandhill Crane Ln Princeton, TX | 4.0 | 2.5 | 1600 | $1,750 | $1.09 | 45d | 1 | 0.35mi |
| 427 Bower DR Princeton, TX | 4.0 | 2.0 | 1600 | $1,850 | $1.16 | 26d | 1 | 0.35mi |
| 914 Sandhill Crane Ln Princeton, TX | 3.0 | 2.5 | 1189 | $1,775 | $1.49 | 9d | 1 | 0.36mi |
| 911 Sandhill Crane Ln Princeton, TX | 3.0 | 2.5 | 1360 | $1,575 | $1.16 | 46d | 1 | 0.36mi |
| 416 Finch CIR Princeton, TX | 3.0 | 2.0 | 1266 | $1,350 | $1.07 | 45d | 1 | 0.38mi |
| 935 Sandhill Crane Ln Princeton, TX | 3.0 | 2.5 | 1189 | $1,999 | $1.68 | 20d | 1 | 0.38mi |
| 919 Blue Heron Dr Princeton, TX | 4.0 | 2.5 | 1535 | $1,775 | $1.16 | 45d | 1 | 0.39mi |
| 919 Blue Heron Dr Princeton, TX | 4.0 | 2.5 | 1535 | $1,700 | $1.11 | 19d | 1 | 0.39mi |
| 926 Wood Stork Way Princeton, TX | 3.0 | 2.5 | 1285 | $1,700 | $1.32 | 26d | 1 | 0.39mi |
| 402 Harvest St Princeton, TX | 3.0 | 2.0 | 1433 | $1,665 | $1.16 | 14d | 1 | 0.39mi |
| 6448 County Road 437 Princeton, TX | 2.0 | 3.0 | 1621 | $3,950 | $2.44 | 0d | 1 | 0.42mi |
| 5847 Rock Maple Dr Princeton, TX | 3.0 | 2.0 | 1481 | $1,785 | $1.21 | 9d | 1 | 0.43mi |
| 5847 Rock Maple Dr Princeton, TX | 3.0 | 2.0 | 1481 | $1,785 | $1.21 | 18d | 1 | 0.43mi |
| 6234 Sanderling St Princeton, TX | 4.0 | 2.5 | 1535 | $1,725 | $1.12 | 45d | 1 | 0.43mi |
| 613 Holleman Dr , TX | 3.0 | 2.0 | 1260 | $1,800 | $1.43 | 0d | 1 | 0.44mi |
| 545 Holleman Dr Princeton, TX | 3.0 | 2.0 | 1474 | $1,750 | $1.19 | 45d | 1 | 0.44mi |
| 5836 Crystal Water Way Princeton, TX | 3.0 | 2.0 | 1481 | $1,799 | $1.21 | 7d | 1 | 0.46mi |
| 214 Wheatgrass Ln Princeton, TX | 3.0 | 2.0 | 1407 | $1,699 | $1.21 | 45d | 1 | 0.47mi |
HOA detail
- Monthly dues
- $42 · $504/yr
Listing history 9 events
-
2026-06-21days on market $221,990 Active 11 DOM
-
2026-06-18days on market $221,990 Active 8 DOM
-
2026-06-17days on market $221,990 Active 7 DOM
-
2026-06-16days on market $221,990 Active 6 DOM
-
2026-06-15days on market $221,990 Active 5 DOM
-
2026-06-13days on market $221,990 Active 3 DOM
-
2026-06-13days on market $221,990 Active 2 DOM
-
2026-06-10remarks 699-char remark
-
2026-06-10$221,990 Active 1 DOM
ⓘ Source: listings_history table (triggers on properties + properties_extension) + one-shot
backfill from property_details.listing_events for pre-trigger history.
Climate risk First Street
- Flood 1/10 Low FEMA zone X (unshaded) · 0% chance over 30 yrs
- Wildfire 3/10 Moderate
- Heat 7/10 Severe 7 d/yr ≥110°F today · 23 d/yr by 30 yrs out
- Wind 6/10 Major 27% chance of damaging wind over 30 yrs
- Air quality 3/10 Moderate 3 unhealthy d/yr today · 3 by 30 yrs out
Nearby sold comps map
Loading sold comps map…
Walkable amenities ~0.75 mi
Loading nearby amenities…
Taxation est. · year 1
- Rental income
- $22,889
- − Mortgage interest
- −$12,435
- − Property taxes
- −$3,330
- − Insurance
- −$1,110
- − Repairs & maintenance
- −$1,831
- − Management
- −$1,831
- − HOA
- −$504
- − Depreciation
- −$6,458
- Taxable loss
- −$4,610
- Est. tax savings @ 24.0%
- +$1,106
- After-tax cash flow
- $275/yr
For passive investors: Depreciation is non-cash, so a rental often shows a tax loss while cash-flowing — sheltering income. Rental losses are passive: they offset passive income freely, and up to $25,000/yr can offset ordinary (W-2) income if you actively participate and your MAGI is under $100k (phasing out to $0 by $150k); unused losses carry forward. On sale, claimed depreciation is recaptured at up to 25%, and gains may owe capital-gains tax (a 1031 exchange can defer both). Figures are a year-1 estimate at your 24.0% rate — not tax advice; consult a CPA.
Condition & rehab AI · 1 photo
This property requires extensive renovations across all systems and areas, with major repairs and updates needed to bring it up to a livable condition. Significant investment is required to increase its value.
Repairs flagged
- Major Kitchen cabinets — No photos of the kitchen
- Major Bathroom fixtures — No photos of the bathrooms
- Major Roof — No photos of the roof
- Major Exterior siding — No photos of the exterior
- Major Flooring — No photos of the flooring
- Major Interior walls/paint — No photos of the interior walls/paint
- Major Windows — No photos of the windows
- Major Foundation/structure — No photos of the foundation/structure
- Major HVAC/mechanicals — No photos of the HVAC/mechanicals
- Major Landscaping — No photos of the landscaping/curb appeal
Value-add opportunities
- Both Kitchen renovation — Modernizing the kitchen can significantly increase both resale and rental value.
- Both Bathroom renovation — Updating bathrooms is crucial for both resale and rental appeal.
- Both Exterior painting and landscaping — A fresh coat of paint and well-maintained landscaping can enhance curb appeal and attract more buyers/renters.
- Both Roof replacement — A new roof is essential for both safety and aesthetic appeal, impacting both resale and rental value.
- Both HVAC system upgrade — A modern, energy-efficient HVAC system improves comfort and can be a selling point for both buyers and renters.
- Both Interior painting and updates — Fresh paint and updated decor can make the interior more inviting and appealing to potential buyers/renters.
Renovation cost estimate screening
| Repair item | Severity | Est. cost |
|---|---|---|
| Kitchen cabinets · No photos of the kitchen | Major | $15,000–50,000 |
| Bathroom fixtures · No photos of the bathrooms | Major | $15,000–50,000 |
| Roof · No photos of the roof | Major | $15,000–50,000 |
| Exterior siding · No photos of the exterior | Major | $15,000–50,000 |
| Flooring · No photos of the flooring | Major | $15,000–50,000 |
| Interior walls/paint · No photos of the interior walls/paint | Major | $15,000–50,000 |
| Windows · No photos of the windows | Major | $15,000–50,000 |
| Foundation/structure · No photos of the foundation/structure | Major | $15,000–50,000 |
| HVAC/mechanicals · No photos of the HVAC/mechanicals | Major | $15,000–50,000 |
| Landscaping · No photos of the landscaping/curb appeal | Major | $15,000–50,000 |
| Total estimated repair cost · 10 items | $150,000–500,000 |
Value-add ROI direction
- Both Kitchen renovation — Modernizing the kitchen can significantly increase both resale and rental value. ↑
- Both Bathroom renovation — Updating bathrooms is crucial for both resale and rental appeal. ↑
- Both Exterior painting and landscaping — A fresh coat of paint and well-maintained landscaping can enhance curb appeal and attract more buyers/renters. ↑
- Both Roof replacement — A new roof is essential for both safety and aesthetic appeal, impacting both resale and rental value. ↑
- Both HVAC system upgrade — A modern, energy-efficient HVAC system improves comfort and can be a selling point for both buyers and renters. ↑
- Both Interior painting and updates — Fresh paint and updated decor can make the interior more inviting and appealing to potential buyers/renters. ↑
ⓘ Cost ranges are severity-bucket heuristics (US national rule-of-thumb). Get contractor quotes + a written scope before underwriting a rehab budget.
Schools (NCES district)
- District
- Princeton ISD
- NCES district ID
- 4835850
- Math proficiency
- 51% ▼ -8.00%
- Reading proficiency
- 47% ▬ 0.00%
- Median HH income
- $54,827
- Composite
- 42.44/100
- National rank
- #3226
- State rank
- #188 of 826 in TX
Livability — Wylie
- Score
- 69/100
- State rank
- #419
- US rank
- #8623
Category grades
Schools grade is shown separately in the Schools card above.
Census & demographics
- County
- Collin County · 1,159,394 people
- City population
- 69,325
- Metro
- Dallas-Fort Worth-Arlington, TX
- Population (ZIP)
- 34,171
- Household income
- $100,037
- Rent vs Own
- Severe rent burden
- 368.0
Population outlook (Collin County) Hauer SSP2
- Today (2025)
- 1,210,074 people
- By 2030
- 1,358,201 · +12.2%
- By 2040
- 1,654,061 · +36.7%
- By 2050
- 1,937,359 · +60.1%
- By 2075
- 2,567,039 · +112.1%
- By 2100
- 2,952,048 · +144.0%
Race, ethnicity, and origin ACS 2023
- Neighborhood character
- Diverse neighborhood (Simpson 0.66)
- Race & ethnicity
- White 47% Hispanic / Latino 30% Black 17% Two or more races 10% Asian 4% Native American 1%
- Hispanic origin (detail)
- Mexican 26%
- Common ancestry
- Lithuanian 2% Romanian 1% Russian 1%
- Foreign-born
- 15% · Canada, China, Mexico
- Languages at home
- 70% English-only · Spanish 22% Other Indo-European 2% Other Asian/Pacific 1%
Political lean MEDSL · Collin
- 2024 margin
- R (+11.1) · D 43.1% · R 54.3% · Other 2.6%
- 2008→2024 swing
- +14.4pp toward D · 2008: -25.6pp · 2024: -11.1pp
- All cycles
- 2024: R+11.1 2020: R+4.3 2016: R+17.0 2012: R+31.6 2008: R+25.6
Not yet ingested
- Civics
- —
Market trends
- HPI YoY
- ▼ -103.99%
- Current HPI
- 238.9373
- Rent YoY
- ▼ -1.02%
- Metro
- Dallas-Fort Worth-Arlington, TX
- State GDP YoY
- ▲ 3.95%
- F500 in state
- 110
Industry mix (Fortune 500 HQ in TX)
| Industry | F500 HQs | Revenue |
|---|---|---|
| Energy | 16 | $1,198B |
|
||
| Technology | 5 | $198B |
|
||
| Engineering / Construction | 4 | $72B |
|
||
| Energy Services | 3 | $60B |
|
||
| Utilities | 3 | $41B |
|
||
| Healthcare | 2 | $330B |
|
||
Cash-flow waterfall
monthlySold comps — $/sqft
last 12 mo · ≤1 miLoading sold comps…