 Fourplex
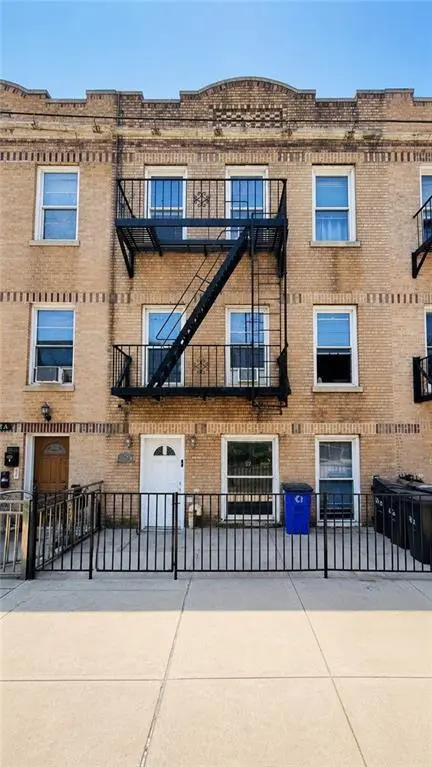
2630 Harway Ave · New York, NY
Flood risk 7/10 · Major
- FEMA flood zone
- X (shaded)
- Chance of flooding over 30 yrs
- 0.78%
- Est. flood insurance / yr
- $507 – $1,088
Fire risk 1/10 · Minimal
- Est. fire insurance / yr
- $691 – $1,283
Heat risk 7/10 · Major
- Hot days now (above 97°F)
- 7 days/yr
- Hot days in 30 yrs
- 16 days/yr
Wind risk 6/10 · Moderate
- Chance of severe wind over 30 yrs
- 68.0%
Air-quality risk 4/10 · Minor
- Unhealthy air days now
- 5 days/yr
- Unhealthy air days in 30 yrs
- 7 days/yr
Risk factors via First Street. Map © Google.
Why this score? — see what drove the D+ grade
The composite is a weighted blend of 9 inputs, each scored 0–100. Each bar is that input's sub-score; the figure is the points it added to the 100-point composite (weight × sub-score).
- Cash flow +20.6/30.0
- DSCR +6.6/10.0
- Schools +5.0/10.0
- 1% rule +4.4/10.0
- Rent growth +4.0/5.0
- Livability +3.8/5.0
- Condition / age +2.5/5.0
- ARV discount +0.0/15.0
- Appreciation +0.0/10.0
$1,750,000
🖨 Deal sheet (PDF) 📄 Offer letter ✓ Due diligence
Multi-family units
County records classify this as Multi-Family (2-4 Unit). Listing-text estimate: 4 units. confirmed
Listing remarks
Hot hot solid brick 4 family house located in Bath Beach. It is 21x56 with lot size of 21x118 and R5 zoning with possibilities of extending another 20ft!! 3 stories. 1st floor - 3 bedrooms, living room, dining area, eat in kitchen, full bathroom. 2nd floor - 3 bedrooms, living room, dining area, eat in kitchen, full bathroom. 3rd floor front / rear are 2 x 1 bedrooms, living room, eat in kitchen full, bathroom.
Key facts
- Solid brick
- R5 zoning
- 2,100 sq ft lot
Tags
Property features AI
Finance
- Other: Estimated total square footage: 3500; Lot number 31
- Financial info: Financing options: exchange considered, assumption, bank mortgage, or cash
Exterior
- Parking: Street parking
- Utilities: 220V electric; Gas hot water; Gas heating; Hot water heat delivery
- Home design: Residential property; Flat roof; Block foundation
- Construction: Brick construction; Flat roof; Block foundation; Building footprint approximately 1,176; Building dimensions approximately 56.00 x 21.00
- Exterior features: Back yard; Attached building; Brick exterior
Interior
- Bedrooms: 2 bedrooms on level 1; 3 bedrooms on level 2; 2 bedrooms on level 3
- Flooring: Hardwood floors
- Bathrooms: 1 full bath on level 1; 1 full bath on level 2; 2 full baths on level 3; 4 full baths total
- Heating & cooling: Hot water heat (gas-fired); 220V electric service; 4 AC units
- Interior features: Hardwood floors; 4 AC units
Neighborhood map
What this means for you Summary
Snapshot
- This is a 2×3bd/1ba + 2×2bd/1ba units multifamily listed at $1.75M.
Deal economics
- At list price, monthly cash flow is $2k ($27k/yr) — positive. Per door: $571/mo.
- The deal already cash-flows at list — no discount required.
- To meet the 1% rule (rent ≥ 1% of price), the offer needs to be $1.65M (5.6% below list).
- Recommended offer: $1.65M (5.6% below list) — sets the bar for 1% rule.
- Cap rate 7.9% vs local median 2.6% in New York — top-decile yield for the area; either an underpriced asset or a hidden risk that comps aren't pricing in. Stress-test before assuming the spread holds.
Location & tenants
- Location reads 75/100 on livability (#268 in NY, #4,188 nationally) — a middle-class / working-renter tenant base. Strengths: amenities A+, commute A+, health & safety A; Watch: crime F, cost of living F.
- Market conditions: Rents rising fast (+5.9%/yr); 334 active listings in the ZIP; 1 comparable units currently listed for rent nearby; 10,063 units permitted in Kings County in 2024 (9,789 in 5+ unit buildings).
- At $16,527/mo this rent would consume 301% of the median local household income ($66k/yr) (locally 6028% of renters already pay >50% of income on rent) — very limited rent-growth headroom before tenants either downsize or default.
Forward outlook
- Local home prices are declining (-3.0%/yr); year-one equity from $12k of loan paydown is wiped out by about $52k of value loss. Plan a longer hold.
- Kings County population projected at +13% by 2050 — modest demand growth; plan on rents tracking national, not racing it.
Negotiation context
- It's been on market 25 days — a 2% lower offer ($1.72M) is reasonable based on typical stale-listing flexibility.
- Current owner paid $750k; list at $1.75M implies a 133% gain — meaningful room to come down on a strong offer.
Risks & watch-outs
- Watch-outs: flood insurance adds $66/mo; built in 1931 — expect roof / HVAC / electrical / plumbing capex.
- Climate carrying-cost: major flood risk; major wind risk, 68% chance of damaging wind over 30y; extreme-heat days projected 7→16/yr by 2055 (HVAC capex compounding) — expect insurance premiums to compound above CPI over the hold.
Questions for the listing agent
- Can we see the unit-by-unit rent roll, current vacancy, and any below-market leases? What's the average tenancy length?
- What capital expenditures (roof, boiler, parking lot, exteriors) have been made in the last 5 years, and what's planned in the next 2?
- Built in 1931 — when were the roof, HVAC, electrical panel, plumbing, and water heater last replaced?
- What's the actual annual flood-insurance premium (NFIP or private), and is the property in a SFHA with mandatory coverage?
- Is there a deadline driving the sale (1031 exchange, divorce, estate, relocation)? That informs how much negotiation room exists.
- Schools are B-rated — typically a magnet for longer-tenancy family renters. What's the average tenant stay here, and is there a school-zone premium baked into asking?
- Crime grade is F in this area — have there been break-ins, vandalism, or insurance claims at this property in the last 3 years? What carrier currently insures it and at what premium?
- The area grade is low — what's the realistic commute time and amenity access for the typical tenant pool here? Any planned neighborhood developments (good or bad) we should know about?
- What's the average days-on-market for RENTAL listings here right now (not sales)? A rising rental-DOM trend means longer vacancies and softer asking-rent achievability than the comps imply.
- What's the recent tenant-quality profile in this submarket — average credit score on applications, eviction rate, late-payment / NSF rate, and stable-employment percentage? A property-management company in the area should have these aggregated.
- How much new apartment / multifamily construction is in the pipeline within 1–3 miles? Heavy new supply (>2% of stock underway) typically softens rents 12–24 months out; light construction supports rent growth.
Investment metrics
- 1% rule
- 0.94% ✗
- Cap rate
- 7.90%
- Cash-on-cash
- 5.76%
- DSCR
- 1.26
- GRM
- 8.8
CMA / ARV
- ARV (on-the-fly)
- $1,484,112
- Comps found
- 12
Show comp detail 12 sales within ~0.75 mi
| Address | Dist | Beds/Ba | Sqft | Sold | Price | $/sf | Match |
|---|---|---|---|---|---|---|---|
| 109 Bay 38th St | 0.37mi | 6/3.0 | 2,256 (-4%) | 2mo | $1,400,000 | $621 | 54 |
| 2045 W 11th St | 0.59mi | 6/4.0 | 2,280 (-3%) | 1mo | $1,799,000 | $789 | 47 |
| 32 Bay 34th St | 0.62mi | 5/4.0 | 2,320 (-1%) | 5mo | $1,290,000 | $556 | 44 |
| 2535 Bath Ave | 0.22mi | 4/2.5 | 2,012 (-14%) | 5mo | $1,270,000 | $631 | 42 |
| 8666 24th Ave | 0.52mi | 8/3.0 | 2,268 (-4%) | 10mo | $1,880,000 | $829 | 41 |
| 2301 W 7th St | 0.64mi | 6/3.0 | 2,271 (-3%) | 4mo | $950,000 | $418 | 41 |
| 1962 W 10th St | 0.71mi | 7/4.0 | 2,340 (-0%) | 11mo | $1,638,000 | $700 | 37 |
| 58 Bay 41 St | 0.39mi | 5/4.0 | 2,646 (+12%) | 6mo | $1,580,000 | $597 | 36 |
| 2165 Cropsey Ave | 0.70mi | 7/3.0 | 2,362 (+0%) | 14mo | $1,390,000 | $588 | 35 |
| 1933 W 12th St | 0.69mi | 6/2.0 | 2,200 (-6%) | 4mo | $1,600,000 | $727 | 34 |
| 70 Bay 34th St | 0.59mi | 8/4.0 | 2,490 (+6%) | 11mo | $1,570,000 | $631 | 34 |
| 60 Lake Pl | 0.59mi | 4/3.0 | 2,142 (-9%) | 7mo | $990,000 | $462 | 32 |
Match score weights: distance 35% · size 25% · config 20% · recency 20%. Top-matched comps best support the ARV.
Projected returns pro-forma
-3.0% appreciation · 5.87% rent growth · sell at horizon
- IRR
- -4.8%
- Equity multiple
- 0.82×
- Total profit
- $-89,562
- Equity at exit
- $260,931
- IRR
- 7.7%
- Equity multiple
- 1.65×
- Total profit
- $320,741
- Equity at exit
- $151,308
Cash invested: $490,000 (down + closing). Projections, not guarantees.
Landlord ↔ Tenant lean methodology
- Overall (CITY)
- 0 Strongly Tenant-Friendly
- State New York
- 15 Strongly Tenant-Friendly · D+10
- County
- — inherits STATE
- City New York
- 0 Strongly Tenant-Friendly · D+34
ZIP-level market 11214
- Rents YoY
- 5.9%
- Active inventory
- 334
- Price-to-rent
- 32.3×
Monthly cashflow live
- Estimated rent
- $16,527 medium interval (Pro) →
- Mortgage (P&I)
- −$9,177
- Tax from tax record
- −$799 /mo · $9,592/yr
- Insurance
- −$729
- Flood insurance flood zone
- −$66 /mo · $798/yr
- HOA
- −$0
- Vacancy / Maint / Mgmt
- −$3,471
- Net cashflow
- $2,284
Break-even live
Sensitivity live
| Price | -10% $3,275 | -5% $2,780 | +0% $2,284 | +5% $1,789 | +10% $1,294 |
|---|---|---|---|---|---|
| Rent | -10% $979 | -5% $1,631 | +0% $2,284 | +5% $2,937 | +10% $3,590 |
| Rate | -1.0pp $3,166 | -0.5pp $2,729 | base $2,284 | +0.5pp $1,831 | +1.0pp $1,369 |
4-unit breakdown (identical units grouped — click to expand)
| Units | Beds | Baths | Est. rent |
|---|---|---|---|
| 2× units | 3 | 1 | $9,042 |
| #1 | 3 | 1 | $4,521 |
| #2 | 3 | 1 | $4,521 |
| 2× units | 2 | 1 | $7,486 |
| #3 | 2 | 1 | $3,743 |
| #4 | 2 | 1 | $3,743 |
| Total (4 units) | $16,527 | ||
UW: 25.0% down · 7.5% · 30yr · 1.5% tax · 5.0% vac · 8.0% maint · 8.0% mgmt
Financing live
Cash to close
- Down payment
- $437,500
- Closing costs
- $52,500
- Reserves months
- —
- Total cash needed
- —
Loan-product check · same deal, 3 products live
Conventional
25% down · 7.5% · 30yr
- Down + closing
- —
- Monthly P&I
- —
- Monthly cashflow
- —
- DSCR
- —
- Eligible?
- —
Personal DTI + credit; lowest rate.
DSCR
20% down · 8.5% · 30yr
- Down + closing
- —
- Monthly P&I
- —
- Monthly cashflow
- —
- DSCR
- —
- Eligible?
- —
No personal income docs; deal must DSCR.
Hard money
10% down · 12.0% · 12mo
- Down + closing
- —
- Monthly P&I
- —
- Monthly cashflow
- —
- DSCR
- —
- Eligible?
- —
Short-term bridge; refi at stabilization.
Rent comps 1 comps
| Address | Beds | Baths | Sqft | Rent | $/sqft | DOM | Units | Dist |
|---|---|---|---|---|---|---|---|---|
| 187 Bay 31st St #1 Brooklyn, NY | 3.0 | 3.0 | 1800 | $5,200 | $2.89 | 20d | 1 | 0.58mi |
Listing history 17 events
-
2026-06-21days on market $1,750,000 Active 25 DOM
-
2026-06-18days on market $1,750,000 Active 22 DOM
-
2026-06-17days on market $1,750,000 Active 21 DOM
-
2026-06-16days on market $1,750,000 Active 20 DOM
-
2026-06-15days on market $1,750,000 Active 19 DOM
-
2026-06-13days on market $1,750,000 Active 17 DOM
-
2026-06-10days on market $1,750,000 Active 13 DOM
-
2026-06-08days on market $1,750,000 Active 12 DOM
-
2026-06-08days on market $1,750,000 Active 11 DOM
-
2026-06-04days on market $1,750,000 Active 8 DOM
-
2026-06-03days on market $1,750,000 Active 7 DOM
-
2026-06-02days on market $1,750,000 Active 6 DOM
-
2026-06-01days on market $1,750,000 Active 5 DOM
-
2026-05-31days on market $1,750,000 Active 4 DOM
-
2026-05-27$1,750,000 Active
-
2005-11-01soldstatus $750,000
-
2004-09-13soldstatus $499,000
ⓘ Source: listings_history table (triggers on properties + properties_extension) + one-shot
backfill from property_details.listing_events for pre-trigger history.
Tax reassessment forecast NY · Partial reset (capped growth)
- Current annual tax
- $9,592 · $799/mo
- Projected year-2 tax
- $19,583 · $1,632/mo
- Expected delta
- +$9,992/yr (+$833/mo · 104.2%)
ⓘ Screening estimate from a state-policy table — verify with the county assessor before closing.
Climate risk First Street
- Flood 7/10 Severe FEMA zone X (shaded) · 78% chance over 30 yrs
- Wildfire 1/10 Low
- Heat 7/10 Severe 7 d/yr ≥97°F today · 16 d/yr by 30 yrs out
- Wind 6/10 Major 68% chance of damaging wind over 30 yrs
- Air quality 4/10 Moderate 5 unhealthy d/yr today · 7 by 30 yrs out
Nearby sold comps map
Loading sold comps map…
Walkable amenities ~0.75 mi
Loading nearby amenities…
Taxation est. · year 1
- Rental income
- $198,324
- − Mortgage interest
- −$98,027
- − Property taxes
- −$9,592
- − Insurance
- −$9,548
- − Repairs & maintenance
- −$15,866
- − Management
- −$15,866
- − Depreciation
- −$50,909
- Taxable loss
- −$1,483
- Est. tax savings @ 24.0%
- +$356
- After-tax cash flow
- $27,766/yr
For passive investors: Depreciation is non-cash, so a rental often shows a tax loss while cash-flowing — sheltering income. Rental losses are passive: they offset passive income freely, and up to $25,000/yr can offset ordinary (W-2) income if you actively participate and your MAGI is under $100k (phasing out to $0 by $150k); unused losses carry forward. On sale, claimed depreciation is recaptured at up to 25%, and gains may owe capital-gains tax (a 1031 exchange can defer both). Figures are a year-1 estimate at your 24.0% rate — not tax advice; consult a CPA.
Schools (NCES district)
No district data.
Livability — New York
- Score
- 75/100
- State rank
- #268
- US rank
- #4188
Category grades
Schools grade is shown separately in the Schools card above.
Census & demographics
- Census place
- New York, NY
- County
- Kings County · 2,614,986 people
- City population
- 7,731,280
- Metro
- New York-Newark-Jersey City, NY-NJ-PA
- Population (ZIP)
- 89,397
- Household income
- $65,895
- Rent vs Own
- Severe rent burden
- 6028.0
Population outlook (Kings County) Hauer SSP2
- Today (2025)
- 2,847,441 people
- By 2030
- 2,937,006 · +3.1%
- By 2040
- 3,095,491 · +8.7%
- By 2050
- 3,228,968 · +13.4%
- By 2075
- 3,321,723 · +16.7%
- By 2100
- 3,111,387 · +9.3%
Race, ethnicity, and origin ACS 2023
- Neighborhood character
- Diverse neighborhood (Simpson 0.67)
- Race & ethnicity
- White 40% Asian 38% Hispanic / Latino 17% Two or more races 6% Black 2%
- Hispanic origin (detail)
- Mexican 5% Puerto Rican 3% Dominican 2%
- Common ancestry
- Scotch-Irish 4% Subsaharan African 3% Romanian 2%
- Foreign-born
- 56% · China, Canada, Vietnam
- Languages at home
- 26% English-only · Chinese 28% Russian/Polish/Slavic 15% Spanish 13%
Political lean MEDSL · Kings
- 2024 margin
- Solid D (+44.0) · D 72.0% · R 28.0%
- 2008→2024 swing
- -15.5pp toward R · 2008: 59.4pp · 2024: 44.0pp
- All cycles
- 2024: D+44.0 2020: D+54.8 2016: D+61.8 2012: D+63.9 2008: D+59.4
Not yet ingested
- Civics
- —
Market trends
- HPI YoY
- ▼ -184.55%
- Current HPI
- 276.0804
- Rent YoY
- ▲ 5.87%
- Metro
- New York-Newark-Jersey City, NY-NJ-PA
- State GDP YoY
- ▲ 2.60%
- F500 in state
- 92
Industry mix (Fortune 500 HQ in NY)
| Industry | F500 HQs | Revenue |
|---|---|---|
| Financial Services | 10 | $950B |
|
||
| Consumer Goods | 9 | $162B |
|
||
| Insurance | 4 | $225B |
|
||
| Telecommunications | 2 | $144B |
|
||
| Pharmaceuticals | 2 | $112B |
|
||
| Media / Entertainment | 2 | $69B |
|
||
Price history
+250.7% since first listed3 events — show timeline
- 2026-05-27 Listed $1,750,000 BNYMLS
- 2005-11-01 Sold (Public Records) $750,000 Public Records
- 2004-09-13 Sold (Public Records) $499,000 Public Records
Property tax history
+5.1%/yrLatest (2025): $9,592 · +2.2% YoY. Source: county tax records.
Cash-flow waterfall
monthlySold comps — $/sqft
last 12 mo · ≤1 miLoading sold comps…