24247 Redwood Dr #247 · Chelsea, MI
Flood risk 8/10 · Major
- FEMA flood zone
- A
- Chance of flooding over 30 yrs
- 0.99%
- Est. flood insurance / yr
- $946 – $6,584
Fire risk 2/10 · Minimal
- Est. fire insurance / yr
- $784 – $1,456
Heat risk 3/10 · Minor
- Hot days now (above 98°F)
- 7 days/yr
- Hot days in 30 yrs
- 16 days/yr
Wind risk 2/10 · Minimal
- Chance of severe wind over 30 yrs
- —
Air-quality risk 2/10 · Minimal
- Unhealthy air days now
- 1 days/yr
- Unhealthy air days in 30 yrs
- 2 days/yr
Risk factors via First Street. Map © Google.
Why this score? — see what drove the B grade
The composite is a weighted blend of 9 inputs, each scored 0–100. Each bar is that input's sub-score; the figure is the points it added to the 100-point composite (weight × sub-score).
- Cash flow +30.0/30.0
- 1% rule +10.0/10.0
- DSCR +10.0/10.0
- ARV discount +7.5/15.0
- Schools +4.9/10.0
- Condition / age +4.0/5.0
- Livability +3.8/5.0
- Rent growth +2.5/5.0
- Appreciation +0.0/10.0
$123,995
🖨 Deal sheet 📄 Offer letter ✓ Due diligence
Listing remarks MLS
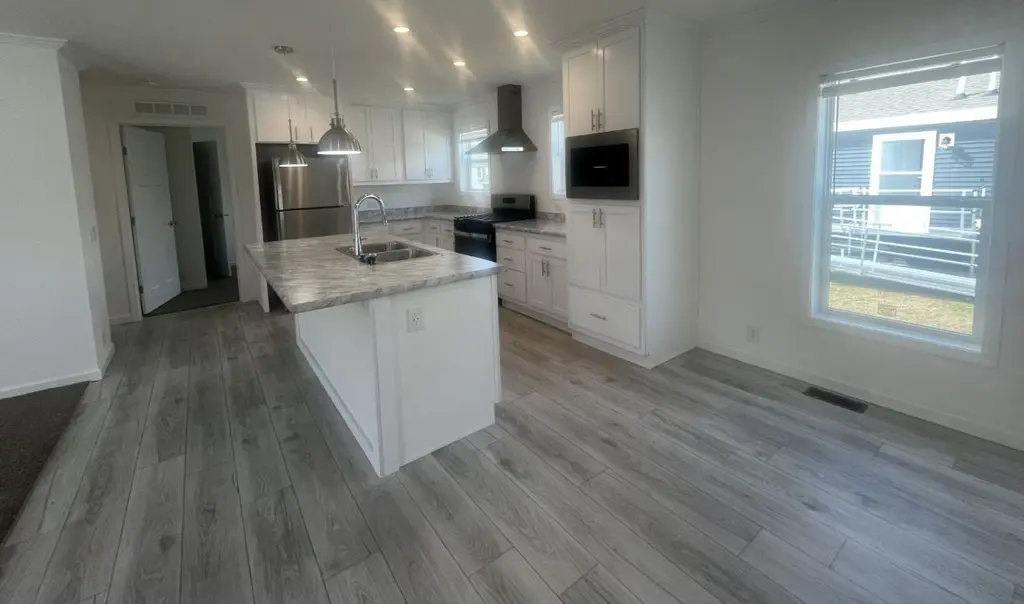
Marvelous 3-Bedroom, 2-Bath Home with Stunning Open Floor Plan Step into this bright and inviting home, featuring a spacious layout perfect for modern living. The large living room is filled with natural light from ample windows and seamlessly flows into a spectacular kitchen designed to impress. The chef s kitchen boasts a massive island, sleek white cabinetry, stainless steel appliances, a gas range, and abundant counter space ideal for cooking and entertaining. The expansive primary suite offers a private retreat with a luxurious ensuite bathroom, complete with dual porcelain sinks, a walk-in shower, and a generous linen closet. With thoughtful design throughout and plenty of space to live and entertain, this home is a must-see. Don t miss your chance to make it yours!
Key facts
- Massive island
- Open floor plan
- Natural light
Tags
Neighborhood map
What this means for you Summary
Snapshot
- This is a 3-bed/2.0-bath manufactured listed at $124k. Condition is rated good.
Deal economics
- At list price, monthly cash flow is $517 ($6k/yr) — positive.
- The deal already cash-flows at list — no discount required.
- Meets the 1% rule at list price ($2k rent vs $124k).
- Recommended offer: $109k (12.0% below list) — sets the bar for market timing.
- Cap rate 14.3% vs local median 3.2% in Chelsea — top-decile yield for the area; either an underpriced asset or a hidden risk that comps aren't pricing in. Stress-test before assuming the spread holds.
Location & tenants
- Location reads 76/100 on livability (#135 in MI, #3,301 nationally) — a middle-class / working-renter tenant base. Strengths: crime A+, housing A+, health & safety A+; Watch: amenities F, commute F.
- Chelsea School District (town): math 53% / reading 57% proficiency, ranked #59 of 540 in MI (top 11%) — acceptable for families but not a draw, mixed tenant base, ~2y average lease; only 10% free/reduced lunch — higher-income household profile.
- Market conditions: 77 active listings in the ZIP; 996 units permitted in Washtenaw County in 2024 (492 in 5+ unit buildings).
Forward outlook
- Local home prices are declining (-3.0%/yr); year-one equity from $857 of loan paydown is wiped out by about $4k of value loss. Plan a longer hold.
- Washtenaw County population projected at +25% by 2050 — long-run rental-demand tailwind backs the buy-and-hold thesis.
- At projected returns (-3.0% appreciation + 3.0% rent growth), your $35k cash investment doubles in ~7 years — after that, you're playing with house money.
Negotiation context
- It's been on market 242 days — a 12% lower offer ($109k) is reasonable based on typical stale-listing flexibility.
Risks & watch-outs
- Watch-outs: flood insurance adds $314/mo.
- Climate carrying-cost: in FEMA flood zone A (mandatory federal flood insurance) — expect insurance premiums to compound above CPI over the hold.
Questions for the listing agent
- It's been on market 242 days. Have you received any prior offers? Is the seller open to a 12% concession, seller financing, or rate buy-down credit?
- What's the actual annual flood-insurance premium (NFIP or private), and is the property in a SFHA with mandatory coverage?
- Why hasn't it sold? Are there any deal-killer items the seller is aware of (foundation, flood, title, zoning, code violations)?
- Is there a deadline driving the sale (1031 exchange, divorce, estate, relocation)? That informs how much negotiation room exists.
- Schools are A-rated — typically a magnet for longer-tenancy family renters. What's the average tenant stay here, and is there a school-zone premium baked into asking?
- What's the average days-on-market for RENTAL listings here right now (not sales)? A rising rental-DOM trend means longer vacancies and softer asking-rent achievability than the comps imply.
- What's the recent tenant-quality profile in this submarket — average credit score on applications, eviction rate, late-payment / NSF rate, and stable-employment percentage? A property-management company in the area should have these aggregated.
- How much new for-sale + rental construction is in the pipeline within 1–3 miles? Heavy new supply typically softens prices + rents 12–24 months out; constrained supply supports both.
Investment metrics
- 1% rule
- 1.72% ✓
- Cap rate
- 14.33%
- Cash-on-cash
- 28.72%
- DSCR
- 2.28
- GRM
- 4.8
CMA / ARV
No comps found within radius.
Projected returns pro-forma
-3.0% appreciation · 3.0% rent growth · sell at horizon
- IRR
- 9.5%
- Equity multiple
- 1.38×
- Total profit
- $13,067
- Equity at exit
- $18,488
- IRR
- 18.8%
- Equity multiple
- 2.58×
- Total profit
- $54,701
- Equity at exit
- $10,721
Cash invested: $34,719 (down + closing). Projections, not guarantees.
Landlord ↔ Tenant lean methodology
- Overall (STATE)
- 62 Landlord-Friendly
- State Michigan
- 62 Landlord-Friendly · EVEN
- County
- — inherits STATE
- City
- — inherits STATE
ZIP-level market 48118
- Active inventory
- 77
- Price-to-rent
- 4.8×
Monthly cashflow live
- Estimated rent
- $2,136 medium interval (Pro) →
- Mortgage (P&I)
- −$650
- Tax est. 1.5%
- −$155 /mo · $1,860/yr
- Insurance
- −$52
- Flood insurance flood zone
- −$314 /mo · $3,765/yr
- HOA
- −$0
- Vacancy / Maint / Mgmt
- −$449
- Net cashflow
- $517
Break-even live
UW: 25.0% down · 7.5% · 30yr · 1.5% tax · 5.0% vac · 8.0% maint · 8.0% mgmt
Financing live
Cash to close
- Down payment
- $30,999
- Closing costs
- $3,720
- Reserves months
- —
- Total cash needed
- —
Loan-product check · same deal, 3 products live
Conventional
25% down · 7.5% · 30yr
- Down + closing
- —
- Monthly P&I
- —
- Monthly cashflow
- —
- DSCR
- —
- Eligible?
- —
Personal DTI + credit; lowest rate.
DSCR
20% down · 8.5% · 30yr
- Down + closing
- —
- Monthly P&I
- —
- Monthly cashflow
- —
- DSCR
- —
- Eligible?
- —
No personal income docs; deal must DSCR.
Hard money
10% down · 12.0% · 12mo
- Down + closing
- —
- Monthly P&I
- —
- Monthly cashflow
- —
- DSCR
- —
- Eligible?
- —
Short-term bridge; refi at stabilization.
Listing history 2 events
-
2026-04-03price $123,995 783-char remark
Show marketing remark (783 chars)
Marvelous 3-Bedroom, 2-Bath Home with Stunning Open Floor Plan Step into this bright and inviting home, featuring a spacious layout perfect for modern living. The large living room is filled with natural light from ample windows and seamlessly flows into a spectacular kitchen designed to impress. The chef s kitchen boasts a massive island, sleek white cabinetry, stainless steel appliances, a gas range, and abundant counter space ideal for cooking and entertaining. The expansive primary suite offers a private retreat with a luxurious ensuite bathroom, complete with dual porcelain sinks, a walk-in shower, and a generous linen closet. With thoughtful design throughout and plenty of space to live and entertain, this home is a must-see. Don t miss your chance to make it yours!
-
2025-09-27$135,995 Active 783-char remark
Show marketing remark (783 chars)
Marvelous 3-Bedroom, 2-Bath Home with Stunning Open Floor Plan Step into this bright and inviting home, featuring a spacious layout perfect for modern living. The large living room is filled with natural light from ample windows and seamlessly flows into a spectacular kitchen designed to impress. The chef s kitchen boasts a massive island, sleek white cabinetry, stainless steel appliances, a gas range, and abundant counter space ideal for cooking and entertaining. The expansive primary suite offers a private retreat with a luxurious ensuite bathroom, complete with dual porcelain sinks, a walk-in shower, and a generous linen closet. With thoughtful design throughout and plenty of space to live and entertain, this home is a must-see. Don t miss your chance to make it yours!
ⓘ Source: listings_history table (triggers on properties + properties_extension) + one-shot
backfill from property_details.listing_events for pre-trigger history.
Climate risk First Street
- Flood 8/10 Severe FEMA zone A · 99% chance over 30 yrs
- Wildfire 2/10 Low
- Heat 3/10 Moderate 7 d/yr ≥98°F today · 16 d/yr by 30 yrs out
- Wind 2/10 Low
- Air quality 2/10 Low 1 unhealthy d/yr today · 2 by 30 yrs out
Nearby sold comps map
Loading sold comps map…
Walkable amenities ~0.75 mi
Loading nearby amenities…
Taxation est. · year 1
- Rental income
- $25,637
- − Mortgage interest
- −$6,946
- − Property taxes
- −$1,860
- − Insurance
- −$4,385
- − Repairs & maintenance
- −$2,051
- − Management
- −$2,051
- − Depreciation
- −$3,607
- Taxable income
- $4,737
- Est. tax owed @ 24.0%
- −$1,137
- After-tax cash flow
- $5,068/yr
For passive investors: Depreciation is non-cash, so a rental often shows a tax loss while cash-flowing — sheltering income. Rental losses are passive: they offset passive income freely, and up to $25,000/yr can offset ordinary (W-2) income if you actively participate and your MAGI is under $100k (phasing out to $0 by $150k); unused losses carry forward. On sale, claimed depreciation is recaptured at up to 25%, and gains may owe capital-gains tax (a 1031 exchange can defer both). Figures are a year-1 estimate at your 24.0% rate — not tax advice; consult a CPA.
Condition & rehab AI · 12 photos
This move-in-ready home features a spacious open floor plan with modern kitchen and bathrooms, and a well-maintained exterior. Minor updates to the exterior and interior could further enhance its value.
Value-add opportunities
- Both Painting exterior siding — Enhances curb appeal and value
- Both Replace carpet in bedrooms — Improves comfort and appearance
- Both Install smart home devices — Enhances convenience and marketability
Renovation cost estimate screening
Value-add ROI direction
- Both Painting exterior siding — Enhances curb appeal and value ↑
- Both Replace carpet in bedrooms — Improves comfort and appearance ↑
- Both Install smart home devices — Enhances convenience and marketability ↑
ⓘ Cost ranges are severity-bucket heuristics (US national rule-of-thumb). Get contractor quotes + a written scope before underwriting a rehab budget.
Schools (NCES district)
- District
- Chelsea School District
- NCES district ID
- 2608940
- Math proficiency
- 53% ▼ -13.00%
- Reading proficiency
- 57% ▼ -6.00%
- Median HH income
- $75,362
- Composite
- 49.34/100
- National rank
- #2018
- State rank
- #59 of 540 in MI
Livability — Chelsea
- Score
- 76/100
- State rank
- #135
- US rank
- #3301
Category grades
Schools grade is shown separately in the Schools card above.
Census & demographics
- City population
- 13,088
- Population (ZIP)
- 13,088
Population outlook (Washtenaw County) Hauer SSP2
- Today (2025)
- 402,878 people
- By 2030
- 424,104 · +5.3%
- By 2040
- 464,633 · +15.3%
- By 2050
- 504,728 · +25.3%
- By 2075
- 614,463 · +52.5%
- By 2100
- 676,181 · +67.8%
Race, ethnicity, and origin ACS 2023
- Neighborhood character
- Predominantly White (93%)
- Race & ethnicity
- White 93% Two or more races 4% Hispanic / Latino 2% Black 1%
- Common ancestry
- Romanian 8% Slovak 4% Lithuanian 3%
- Foreign-born
- 2% · Canada
- Languages at home
- 97% English-only · Spanish 1% French/Haitian/Cajun 1%
Political lean MEDSL · Washtenaw
- 2024 margin
- Solid D (+44.4) · D 71.0% · R 26.6% · Other 2.4%
- 2008→2024 swing
- +3.5pp toward D · 2008: 41.0pp · 2024: 44.4pp
- All cycles
- 2024: D+44.4 2020: D+46.6 2016: D+41.5 2012: D+36.0 2008: D+41.0
Not yet ingested
- Civics
- —
Market trends
- HPI YoY
- ▼ -204.35%
- Current HPI
- 174.8761
- Rent YoY
- —
- Metro
- —
- State GDP YoY
- ▲ 1.37%
- F500 in state
- 28
Industry mix (Fortune 500 HQ in MI)
| Industry | F500 HQs | Revenue |
|---|---|---|
| Automotive Parts | 3 | $48B |
|
||
| Automotive | 2 | $372B |
|
||
| Chemicals | 1 | $45B |
|
||
| Automotive Retail | 1 | $29B |
|
||
| Healthcare / Medical Devices | 1 | $23B |
|
||
| Automotive Technology | 1 | $20B |
|
||
Price history
-8.8% since first listed2 events — show timeline
- 2026-04-03 Price Changed $123,995 Zillow
- 2025-09-27 Listed $135,995 Zillow
Cash-flow waterfall
monthlySold comps — $/sqft
last 12 mo · ≤1 miLoading sold comps…