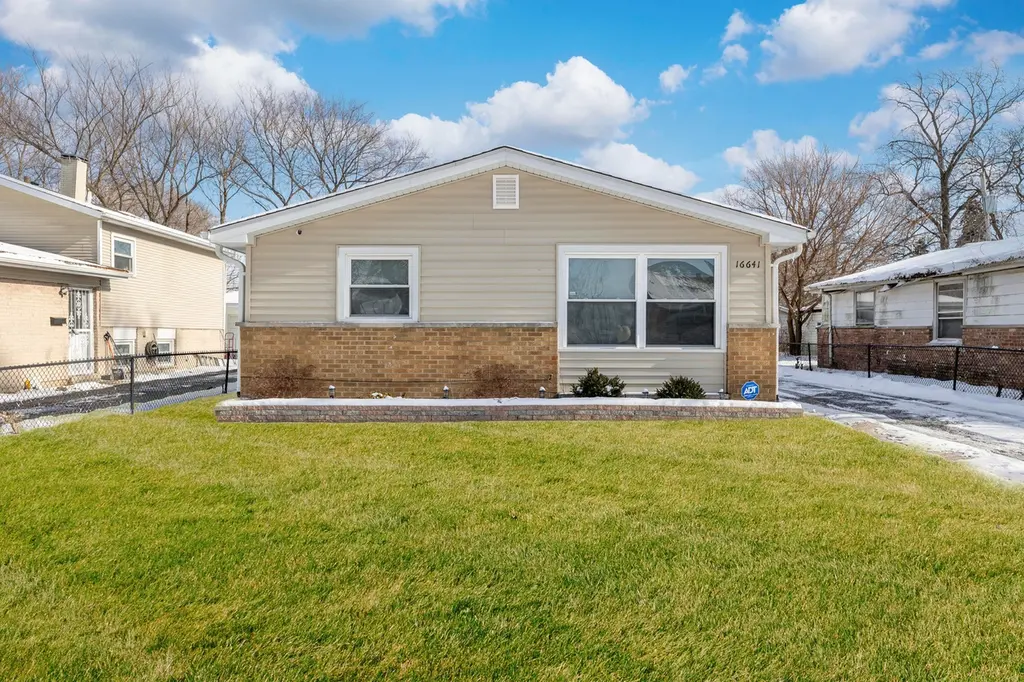
16641 Paulina St · Markham, IL
Flood risk 4/10 · Minor
- FEMA flood zone
- X (unshaded)
- Chance of flooding over 30 yrs
- 0.22%
- Est. flood insurance / yr
- $473 – $860
Fire risk 1/10 · Minimal
- Est. fire insurance / yr
- $804 – $1,492
Heat risk 3/10 · Minor
- Hot days now (above 102°F)
- 7 days/yr
- Hot days in 30 yrs
- 15 days/yr
Wind risk 2/10 · Minimal
- Chance of severe wind over 30 yrs
- —
Air-quality risk 3/10 · Minor
- Unhealthy air days now
- 4 days/yr
- Unhealthy air days in 30 yrs
- 4 days/yr
Risk factors via First Street. Map © Google.
Why this score? — see what drove the C+ grade
The composite is a weighted blend of 9 inputs, each scored 0–100. Each bar is that input's sub-score; the figure is the points it added to the 100-point composite (weight × sub-score).
- Cash flow +27.7/30.0
- Appreciation +10.0/10.0
- DSCR +9.8/10.0
- 1% rule +6.8/10.0
- Livability +3.8/5.0
- Rent growth +2.5/5.0
- Condition / age +2.5/5.0
- Schools +0.7/10.0
- ARV discount +0.0/15.0
$194,000
🖨 Deal sheet 📄 Offer letter ✓ Due diligence
Listing remarks
Don't miss your opportunity to own this well-maintained 3-bedroom home! This move-in ready property offers comfort, care, and convenience-nothing to do but move right in. The home features a nicely sized yard and a 2-car garage. Whether you're purchasing for your own family or as an investment, you can't go wrong with this one. Home is in great condition, however seller prefers to sell As Is. .
Key facts
- 5,941 sq ft lot
- 2 garage spots
- Built 1960
Property features AI
Finance
- Other: Fee simple ownership; Not currently leased; Possession at closing or immediate
- HOA & community: No master association fee required
Exterior
- Parking: Detached garage owned (2 garage spaces, 2 total parking spaces)
- Utilities: Public water; Public sewer
- Home design: Detached single-family home; One-story
- Construction: Brick and frame construction; Built 61–70 years ago; Rehab completed in 2014; Property built before 1978
- Exterior features: Lot less than 0.25 acre; Lot dimensions: 6600
Interior
- Kitchen: Kitchen on main level (approx. 12 x 20) with ceramic tile; Range; Refrigerator; Stainless steel appliances
- Bedrooms: Master bedroom on main level (approx. 13 x 13) with hardwood floors; Bedroom on main level (approx. 13 x 12) with hardwood floors; Bedroom on main level (approx. 12 x 12) with hardwood floors
- Flooring: Hardwood flooring in living areas and bedrooms; Ceramic tile in kitchen
- Bathrooms: 1 full bathroom
- Heating & cooling: Natural gas heating; Central air conditioning
- Interior features: 5 total rooms; Crawl space basement
- Laundry & utility: Main-level laundry room (approx. 10 x 8)
Neighborhood map
What this means for you Summary
Snapshot
- This is a 3-bed/1.0-bath single-family listed at $194k.
Deal economics
- At list price, monthly cash flow is $586 ($7k/yr) — positive.
- The deal already cash-flows at list — no discount required.
- Meets the 1% rule at list price ($2k rent vs $194k).
Location & tenants
- Location reads 76/100 on livability (#186 in IL, #3,539 nationally) — a middle-class / working-renter tenant base. Strengths: commute A+, cost of living A+, housing A+; Watch: crime D, amenities D, employment D.
- Thornton Twp Hsd 205 (suburban): math 7% / reading 8% proficiency, ranked #594 of 620 in IL (top 96%) — low school quality limits family demand, transient renter base, plan for 1-2y turnover.
- Market conditions: 65 active listings in the ZIP; 4 comparable units currently listed for rent nearby; rentals leasing fast (median 1d on market — plan ~1-2 weeks tenant-placement turnaround); 6,272 units permitted in Cook County in 2024 (4,658 in 5+ unit buildings).
Forward outlook
- In year one you build about $21k of equity ($1k loan paydown + $19k appreciation (10.0% local appreciation)).
- At projected returns (10.0% appreciation + 3.0% rent growth), your $54k cash investment doubles in ~2 years — after that, you're playing with house money.
- By year 2, paydown + projected appreciation supports a ~$33k cash-out refi (75% LTV) — recoverable capital for the next deal without selling this one.
Negotiation context
- Only 3 days on market — expect competitive offers; lowballing is unlikely to land.
- 8 sale attempts since 13y ago with the ask held roughly flat each time — persistent listings suggest the price (not the market) is what's stuck; bring a comps-based counter.
Questions for the listing agent
- Built in 1960 — when were the roof, HVAC, electrical panel, plumbing, and water heater last replaced?
- Is there a deadline driving the sale (1031 exchange, divorce, estate, relocation)? That informs how much negotiation room exists.
- Schools are F-rated, which usually means shorter tenancies and higher turnover. Who's the typical renter profile here, and what's been the actual vacancy rate?
- Crime grade is D in this area — have there been break-ins, vandalism, or insurance claims at this property in the last 3 years? What carrier currently insures it and at what premium?
- What's the average days-on-market for RENTAL listings here right now (not sales)? A rising rental-DOM trend means longer vacancies and softer asking-rent achievability than the comps imply.
- What's the recent tenant-quality profile in this submarket — average credit score on applications, eviction rate, late-payment / NSF rate, and stable-employment percentage? A property-management company in the area should have these aggregated.
- How much new for-sale + rental construction is in the pipeline within 1–3 miles? Heavy new supply typically softens prices + rents 12–24 months out; constrained supply supports both.
Investment metrics
- 1% rule
- 1.18% ✓
- Cap rate
- 9.92%
- Cash-on-cash
- 12.94%
- DSCR
- 1.58
- GRM
- 7.0
CMA / ARV
- ARV (on-the-fly)
- $138,027
- Comps found
- 12
Show comp detail 12 sales within ~0.75 mi
| Address | Dist | Beds/Ba | Sqft | Sold | Price | $/sf | Match |
|---|---|---|---|---|---|---|---|
| 16807 Wood St | 0.22mi | 3/1.0 | 985 (-1%) | 0mo | $90,000 | $91 | 88 |
| 16735 Dixie Hwy | 0.40mi | 2/1.0 (-1) | 965 (-3%) | 1mo | $153,000 | $159 | 71 |
| 16300 Winchester Ave | 0.55mi | 3/1.0 | 1,012 (+2%) | 2mo | $97,500 | $96 | 70 |
| 16784 Trapet Ave | 0.61mi | 3/1.0 | 970 (-2%) | 1mo | $96,000 | $99 | 67 |
| 16444 Wolcott Ave | 0.37mi | 3/1.5 | 1,080 (+9%) | 3mo | $112,500 | $104 | 64 |
| 16221 Hermitage Ave | 0.54mi | 3/1.5 | 1,044 (+5%) | 1mo | $192,000 | $184 | 64 |
| 16768 Bulger Ave | 0.55mi | 2/1.0 (-1) | 954 (-4%) | 4mo | $125,000 | $131 | 60 |
| 1924 169th St | 0.44mi | 2/1.0 (-1) | 1,086 (+9%) | 3mo | $189,900 | $175 | 56 |
| 16628 Winchester Ave | 0.35mi | 2/1.0 (-1) | 1,134 (+14%) | 1mo | $84,000 | $74 | 54 |
| 16738 Crane Ave | 0.72mi | 3/1.0 | 1,059 (+7%) | 2mo | $147,000 | $139 | 54 |
| 16784 Crane Ave | 0.74mi | 3/1.0 | 1,059 (+7%) | 2mo | $155,000 | $146 | 53 |
| 16207 Justine St | 0.59mi | 4/2.0 (+1) | 1,100 (+11%) | 3mo | $215,000 | $195 | 43 |
Match score weights: distance 35% · size 25% · config 20% · recency 20%. Top-matched comps best support the ARV.
Projected returns pro-forma
10.0% appreciation · 3.0% rent growth · sell at horizon
- IRR
- 33.8%
- Equity multiple
- 3.63×
- Total profit
- $142,937
- Equity at exit
- $174,771
- IRR
- 29.1%
- Equity multiple
- 8.21×
- Total profit
- $391,514
- Equity at exit
- $376,899
Cash invested: $54,320 (down + closing). Projections, not guarantees.
Landlord ↔ Tenant lean methodology
- Overall (STATE)
- 43 Moderately Tenant-Leaning
- State Illinois
- 43 Moderately Tenant-Leaning · D+7
- County
- — inherits STATE
- City
- — inherits STATE
ZIP-level market 60428
- Home prices YoY
- 8.5%
- Active inventory
- 65
- Price-to-rent
- 7.0×
Monthly cashflow live
- Estimated rent
- $2,296 medium interval (Pro) →
- Mortgage (P&I)
- −$1,017
- Tax from tax record
- −$130 /mo · $1,560/yr
- Insurance
- −$81
- HOA
- −$0
- Vacancy / Maint / Mgmt
- −$482
- Net cashflow
- $586
Break-even live
UW: 25.0% down · 7.5% · 30yr · 1.5% tax · 5.0% vac · 8.0% maint · 8.0% mgmt
Financing live
Cash to close
- Down payment
- $48,500
- Closing costs
- $5,820
- Reserves months
- —
- Total cash needed
- —
Loan-product check · same deal, 3 products live
Conventional
25% down · 7.5% · 30yr
- Down + closing
- —
- Monthly P&I
- —
- Monthly cashflow
- —
- DSCR
- —
- Eligible?
- —
Personal DTI + credit; lowest rate.
DSCR
20% down · 8.5% · 30yr
- Down + closing
- —
- Monthly P&I
- —
- Monthly cashflow
- —
- DSCR
- —
- Eligible?
- —
No personal income docs; deal must DSCR.
Hard money
10% down · 12.0% · 12mo
- Down + closing
- —
- Monthly P&I
- —
- Monthly cashflow
- —
- DSCR
- —
- Eligible?
- —
Short-term bridge; refi at stabilization.
Rent comps 4 comps
| Address | Beds | Baths | Sqft | Rent | $/sqft | DOM | Units | Dist |
|---|---|---|---|---|---|---|---|---|
| 16125 Marshfield Ave Markham, IL | 3.0 | 1.0 | 1043 | $2,400 | $2.30 | 1d | 1 | 0.66mi |
| 2308 170th St Hazel Crest, IL | 3.0 | 2.0 | 1020 | $2,400 | $2.35 | 1d | 1 | 0.89mi |
| 16752 Artesian Ave Hazel Crest, IL | 3.0 | 1.0 | 867 | $2,500 | $2.88 | 1d | 1 | 0.97mi |
| 16048 Halsted St Unit 2 Harvey, IL | 3.0 | 1.0 | 1091 | $1,650 | $1.51 | 24d | 1 | 1.31mi |
Listing history 35 events
-
2026-05-23$194,000 Active
-
2026-05-13historical Contingent - Continue to Show
-
2026-05-12historical
-
2026-04-24Active
-
2026-03-18historical Contingent - Continue to Show
-
2026-03-17historical
-
2026-03-03Active
-
2026-03-03historical
-
2025-02-03historical
-
2025-01-30Active
-
2023-12-15soldstatus $175,000
-
2023-12-04soldstatus $175,000 Closed
-
2023-10-18status Pending
-
2023-10-05$174,900 Active
-
2022-01-27status Pending
-
2022-01-24historical
-
2022-01-04Active
-
2014-11-21soldstatus $73,500
-
2014-11-13soldstatus $73,500 Closed Sale
-
2014-09-22historical Contingent
-
2014-09-10price $72,500 Price Change
-
2014-08-22price $73,500 Price Change
-
2014-08-13price $75,000 Price Change
-
2014-07-30price $72,250 Price Change
-
2014-07-24price $75,000 Price Change
-
2014-07-18price $76,500 Price Change
-
2014-06-28price $77,900 Price Change
-
2014-06-05price $79,999 Price Change
-
2014-05-30price $82,500 Price Change
-
2014-05-17price $84,900
-
2014-05-16price $85,900 Price Change
-
2014-05-01$89,500 New
-
2014-02-26soldstatus $12,500 Closed Sale
-
2014-01-03status Pending
-
2013-10-18$14,420 New
ⓘ Source: listings_history table (triggers on properties + properties_extension) + one-shot
backfill from property_details.listing_events for pre-trigger history.
Tax reassessment forecast IL · Partial reset (capped growth)
- Current annual tax
- $1,560 · $130/mo
- Projected year-2 tax
- $2,982 · $248/mo
- Expected delta
- +$1,422/yr (+$118/mo · 91.1%)
ⓘ Screening estimate from a state-policy table — verify with the county assessor before closing.
Climate risk First Street
- Flood 4/10 Moderate FEMA zone X (unshaded) · 22% chance over 30 yrs
- Wildfire 1/10 Low
- Heat 3/10 Moderate 7 d/yr ≥102°F today · 15 d/yr by 30 yrs out
- Wind 2/10 Low
- Air quality 3/10 Moderate 4 unhealthy d/yr today · 4 by 30 yrs out
Nearby sold comps map
Loading sold comps map…
Walkable amenities ~0.75 mi
Loading nearby amenities…
Taxation est. · year 1
- Rental income
- $27,555
- − Mortgage interest
- −$10,867
- − Property taxes
- −$1,560
- − Insurance
- −$970
- − Repairs & maintenance
- −$2,204
- − Management
- −$2,204
- − Depreciation
- −$5,644
- Taxable income
- $4,106
- Est. tax owed @ 24.0%
- −$985
- After-tax cash flow
- $6,045/yr
For passive investors: Depreciation is non-cash, so a rental often shows a tax loss while cash-flowing — sheltering income. Rental losses are passive: they offset passive income freely, and up to $25,000/yr can offset ordinary (W-2) income if you actively participate and your MAGI is under $100k (phasing out to $0 by $150k); unused losses carry forward. On sale, claimed depreciation is recaptured at up to 25%, and gains may owe capital-gains tax (a 1031 exchange can defer both). Figures are a year-1 estimate at your 24.0% rate — not tax advice; consult a CPA.
Schools (NCES district)
- District
- Thornton Twp Hsd 205
- NCES district ID
- 1738970
- Math proficiency
- 7% ▬ 0.00%
- Reading proficiency
- 8% ▼ -2.00%
- Median HH income
- $43,392
- Composite
- 6.92/100
- National rank
- #9976
- State rank
- #594 of 620 in IL
Livability — Markham
- Score
- 76/100
- State rank
- #186
- US rank
- #3539
Category grades
Schools grade is shown separately in the Schools card above.
Census & demographics
- Census place
- Markham, IL
- City population
- 10,980
- Population (ZIP)
- 10,980
Population outlook (Cook County) Hauer SSP2
- Today (2025)
- 5,347,519 people
- By 2030
- 5,357,703 · +0.2%
- By 2040
- 5,324,924 · -0.4%
- By 2050
- 5,230,762 · -2.2%
- By 2075
- 4,785,735 · -10.5%
- By 2100
- 4,188,836 · -21.7%
Race, ethnicity, and origin ACS 2023
- Neighborhood character
- Predominantly Black (69%)
- Race & ethnicity
- Black 69% Hispanic / Latino 17% White 11% Two or more races 4%
- Hispanic origin (detail)
- Mexican 16%
- Common ancestry
- Romanian 1% Lithuanian 1% Iranian 1%
- Foreign-born
- 8% · Canada
- Languages at home
- 86% English-only · Spanish 14%
Political lean MEDSL · Cook
- 2024 margin
- Solid D (+42.0) · D 70.4% · R 28.4% · Other 1.2%
- 2008→2024 swing
- -11.4pp toward R · 2008: 53.4pp · 2024: 42.0pp
- All cycles
- 2024: D+42.0 2020: D+50.3 2016: D+53.0 2012: D+49.4 2008: D+53.4
Not yet ingested
- Civics
- —
Market trends
- HPI YoY
- ▲ 23.63%
- Current HPI
- 302.333
- Rent YoY
- —
- Metro
- —
- State GDP YoY
- ▲ 1.59%
- F500 in state
- 60
Industry mix (Fortune 500 HQ in IL)
| Industry | F500 HQs | Revenue |
|---|---|---|
| Insurance | 4 | $201B |
|
||
| Consumer Goods | 4 | $87B |
|
||
| Industrial Machinery | 3 | $64B |
|
||
| Healthcare | 2 | $55B |
|
||
| Retail / Pharmacy | 1 | $148B |
|
||
| Agriculture / Food | 1 | $86B |
|
||
Price history
+1245.4% since first listed35 events — show timeline
- 2026-05-23 Listed $194,000 MRED as Distributed by MLS Grid
- 2026-05-13 Contingent — MRED as Distributed by MLS Grid
- 2026-05-12 Listing Removed — MRED as Distributed by MLS Grid
- 2026-04-24 Listed — MRED as Distributed by MLS Grid
- 2026-03-18 Contingent — MRED as Distributed by MLS Grid
- 2026-03-17 Listing Removed — MRED as Distributed by MLS Grid
- 2026-03-03 Listing Removed — MRED as Distributed by MLS Grid
- 2026-03-03 Listed — MRED as Distributed by MLS Grid
- 2025-02-03 Listing Removed — MRED as Distributed by MLS Grid
- 2025-01-30 Listed — MRED as Distributed by MLS Grid
- 2023-12-15 Sold (Public Records) $175,000 Public Records
- 2023-12-04 Sold (MLS) $175,000 MRED as Distributed by MLS Grid
- 2023-10-18 Pending — MRED as Distributed by MLS Grid
- 2023-10-05 Listed $174,900 MRED as Distributed by MLS Grid
- 2022-01-27 Pending — MRED as Distributed by MLS Grid
- 2022-01-24 Listing Removed — MRED as Distributed by MLS Grid
- 2022-01-04 Listed — MRED as Distributed by MLS Grid
- 2014-11-21 Sold (Public Records) $73,500 Public Records
- 2014-11-13 Sold (MLS) $73,500 MRED as Distributed by MLS Grid
- 2014-09-22 Contingent — MRED as Distributed by MLS Grid
- 2014-09-10 Price Changed $72,500 MRED as Distributed by MLS Grid
- 2014-08-22 Price Changed $73,500 MRED as Distributed by MLS Grid
- 2014-08-13 Price Changed $75,000 MRED as Distributed by MLS Grid
- 2014-07-30 Price Changed $72,250 MRED as Distributed by MLS Grid
- 2014-07-24 Price Changed $75,000 MRED as Distributed by MLS Grid
- 2014-07-18 Price Changed $76,500 MRED as Distributed by MLS Grid
- 2014-06-28 Price Changed $77,900 MRED as Distributed by MLS Grid
- 2014-06-05 Price Changed $79,999 MRED as Distributed by MLS Grid
- 2014-05-30 Price Changed $82,500 MRED as Distributed by MLS Grid
- 2014-05-17 Price Changed $84,900 MRED as Distributed by MLS Grid
- 2014-05-16 Price Changed $85,900 MRED as Distributed by MLS Grid
- 2014-05-01 Listed $89,500 MRED as Distributed by MLS Grid
- 2014-02-26 Sold (MLS) $12,500 MRED as Distributed by MLS Grid
- 2014-01-03 Pending — MRED as Distributed by MLS Grid
- 2013-10-18 Listed $14,420 MRED as Distributed by MLS Grid
Property tax history
-4.1%/yrLatest (2023): $1,560 · +88.1% YoY. Source: county tax records.
Cash-flow waterfall
monthlySold comps — $/sqft
last 12 mo · ≤1 miLoading sold comps…