 Fourplex
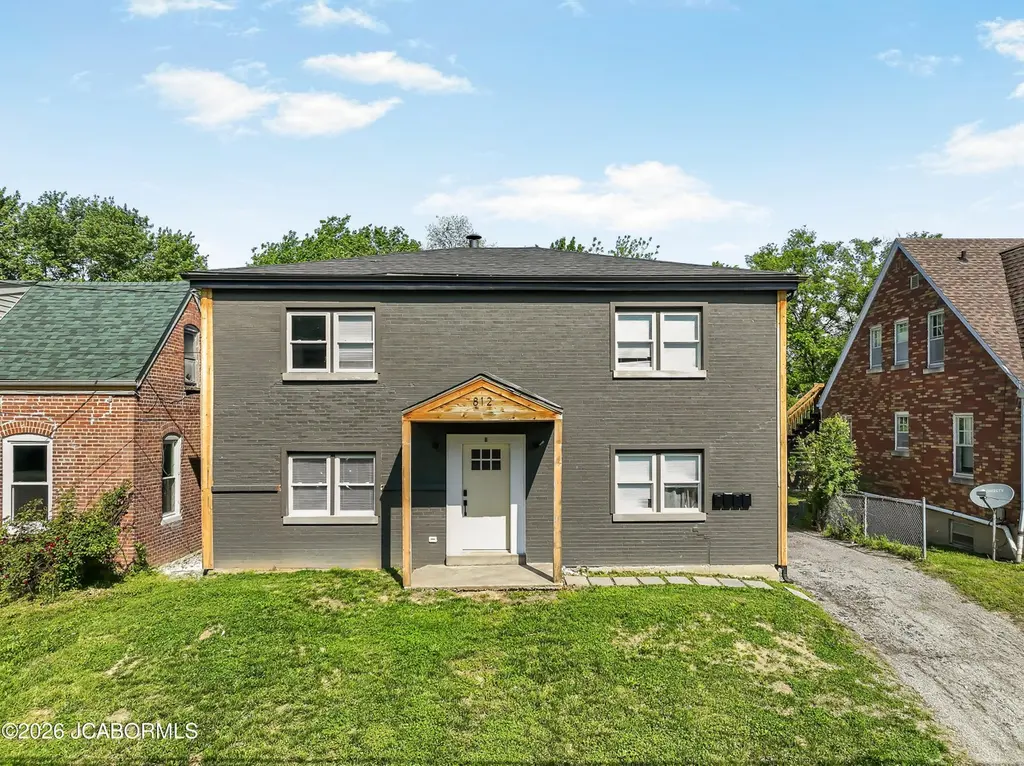
812 Broadway St · Jefferson City, MO
Flood risk 1/10 · Minimal
- FEMA flood zone
- X (unshaded)
- Chance of flooding over 30 yrs
- 0.0%
- Est. flood insurance / yr
- $473 – $860
Fire risk 1/10 · Minimal
- Est. fire insurance / yr
- $1,054 – $1,958
Heat risk 4/10 · Minor
- Hot days now (above 106°F)
- 7 days/yr
- Hot days in 30 yrs
- 19 days/yr
Wind risk 2/10 · Minimal
- Chance of severe wind over 30 yrs
- —
Air-quality risk 2/10 · Minimal
- Unhealthy air days now
- 0 days/yr
- Unhealthy air days in 30 yrs
- 1 days/yr
Risk factors via First Street. Map © Google.
Why this score? — see what drove the F grade
The composite is a weighted blend of 9 inputs, each scored 0–100. Each bar is that input's sub-score; the figure is the points it added to the 100-point composite (weight × sub-score).
- Cash flow +8.1/30.0
- ARV discount +7.5/15.0
- Livability +4.2/5.0
- Schools +3.5/10.0
- 1% rule +2.5/10.0
- Rent growth +2.5/5.0
- Condition / age +2.5/5.0
- DSCR +2.1/10.0
- Appreciation +0.0/10.0
$280,000
🖨 Deal sheet 📄 Offer letter ✓ Due diligence
Multi-family units
County records classify this as Multi-Family (2-4 Unit). Listing-text estimate: 4 units. confirmed
Listing remarks MLS
Investor / or Flippers OPPORTUNITY ! ! ! 4 Plex building gutted and ready for your finishing touch ! ! set up for 4 1 bedroom 1 bath units .
Key facts
- Fully remodeled
- Modern finishes
- Local amenities
Tags
Property features AI
Finance
- Financial info: Multiple rental units with reported actual rents: units rent around $875–$900 each
Exterior
- Parking: Off-street parking
- Utilities: Public water; Public sewer
- Home design: Residential income property; Updated / Remodeled condition
- Construction: Brick and vinyl siding exterior; Approximately 2,200 sq ft above grade and 2,200 sq ft below grade; Builder listed as Unknown
- Exterior features: Deck; Patio
Interior
- Bedrooms: Eight 1-bedroom units
- Bathrooms: Four full bathrooms (total)
- Heating & cooling: Heat pump; Baseboard heating; Electric heating; Central air conditioning; Some units or areas may have no cooling
- Interior features: No fireplace noted
- Laundry & utility: No laundry features noted
Neighborhood map
What this means for you Summary
Snapshot
- This is a 4 × 1-bed/1.0-bath units multifamily listed at $280k.
Deal economics
- At list price, monthly cash flow is $-276 ($-3k/yr) — negative. Per door: $-69/mo.
- To cash-flow at today's rent, offer at most $240k (14.3% below list).
- To meet the 1% rule (rent ≥ 1% of price), the offer needs to be $210k (25.0% below list).
- Recommended offer: $210k (25.0% below list) — sets the bar for 1% rule.
- Cap rate 5.1% vs local median 3.7% in Jefferson City — top-decile yield for the area; either an underpriced asset or a hidden risk that comps aren't pricing in. Stress-test before assuming the spread holds.
Location & tenants
- Location reads 83/100 on livability (#7 in MO, #838 nationally) — a professional / high-income tenant draw. Strengths: cost of living A+, housing A+, health & safety A+; Watch: crime C-.
- Jefferson City (urban): math 34% / reading 48% proficiency, ranked #121 of 324 in MO (top 37%) — families likely to look elsewhere, expect single-tenant / working-renter base with shorter leases.
- Market conditions: 189 active listings in the ZIP; 173 units permitted in Cole County in 2024 (0 in 5+ unit buildings).
Forward outlook
- Local home prices are declining (-3.0%/yr); year-one equity from $2k of loan paydown is wiped out by about $8k of value loss. Plan a longer hold.
- Cole County population projected to shrink 5% by 2050 — rents likely to lag national; underwrite the cash flow, not the appreciation.
Negotiation context
- Only 6 days on market — expect competitive offers; lowballing is unlikely to land.
- 6 sale attempts since 9y ago with the ask held roughly flat each time — persistent listings suggest the price (not the market) is what's stuck; bring a comps-based counter.
Risks & watch-outs
- Watch-outs: built in 1955 — expect roof / HVAC / electrical / plumbing capex.
Questions for the listing agent
- What do current leases actually rent for vs. the listed asking? Can we see a recent rent roll and the last 12 months of T-12 income?
- Can we see the unit-by-unit rent roll, current vacancy, and any below-market leases? What's the average tenancy length?
- What capital expenditures (roof, boiler, parking lot, exteriors) have been made in the last 5 years, and what's planned in the next 2?
- Built in 1955 — when were the roof, HVAC, electrical panel, plumbing, and water heater last replaced?
- Is there a deadline driving the sale (1031 exchange, divorce, estate, relocation)? That informs how much negotiation room exists.
- Schools are B-rated — typically a magnet for longer-tenancy family renters. What's the average tenant stay here, and is there a school-zone premium baked into asking?
- The area grade is low — what's the realistic commute time and amenity access for the typical tenant pool here? Any planned neighborhood developments (good or bad) we should know about?
- What's the average days-on-market for RENTAL listings here right now (not sales)? A rising rental-DOM trend means longer vacancies and softer asking-rent achievability than the comps imply.
- What's the recent tenant-quality profile in this submarket — average credit score on applications, eviction rate, late-payment / NSF rate, and stable-employment percentage? A property-management company in the area should have these aggregated.
- How much new apartment / multifamily construction is in the pipeline within 1–3 miles? Heavy new supply (>2% of stock underway) typically softens rents 12–24 months out; light construction supports rent growth.
Investment metrics
- 1% rule
- 0.75% ✗
- Cap rate
- 5.11%
- Cash-on-cash
- -4.22%
- DSCR
- 0.81
- GRM
- 11.1
CMA / ARV
No comps found within radius.
Projected returns pro-forma
-3.0% appreciation · 3.0% rent growth · sell at horizon
- IRR
- -23.4%
- Equity multiple
- 0.20×
- Total profit
- $-62,920
- Equity at exit
- $41,749
- IRR
- -18.1%
- Equity multiple
- 0.01×
- Total profit
- $-77,298
- Equity at exit
- $24,209
Cash invested: $78,400 (down + closing). Projections, not guarantees.
Landlord ↔ Tenant lean methodology
- Overall (STATE)
- 81 Strongly Landlord-Friendly
- State Missouri
- 81 Strongly Landlord-Friendly · R+10
- County
- — inherits STATE
- City
- — inherits STATE
ZIP-level market 65101
- Home prices YoY
- -29.1%
- Active inventory
- 189
- Price-to-rent
- 44.4×
Monthly cashflow live
- Estimated rent
- $2,100 medium interval (Pro) →
- Mortgage (P&I)
- −$1,468
- Tax est. 1.5%
- −$350 /mo · $4,200/yr
- Insurance
- −$117
- HOA
- −$0
- Vacancy / Maint / Mgmt
- −$441
- Net cashflow
- $-276
Break-even live
4-unit breakdown (identical units grouped — click to expand)
| Units | Beds | Baths | Est. rent |
|---|---|---|---|
| 4× units | 1 | 1 | $2,100 |
| #1 | 1 | 1 | $525 |
| #2 | 1 | 1 | $525 |
| #3 | 1 | 1 | $525 |
| #4 | 1 | 1 | $525 |
| Total (4 units) | $2,100 | ||
UW: 25.0% down · 7.5% · 30yr · 1.5% tax · 5.0% vac · 8.0% maint · 8.0% mgmt
Financing live
Cash to close
- Down payment
- $70,000
- Closing costs
- $8,400
- Reserves months
- —
- Total cash needed
- —
Loan-product check · same deal, 3 products live
Conventional
25% down · 7.5% · 30yr
- Down + closing
- —
- Monthly P&I
- —
- Monthly cashflow
- —
- DSCR
- —
- Eligible?
- —
Personal DTI + credit; lowest rate.
DSCR
20% down · 8.5% · 30yr
- Down + closing
- —
- Monthly P&I
- —
- Monthly cashflow
- —
- DSCR
- —
- Eligible?
- —
No personal income docs; deal must DSCR.
Hard money
10% down · 12.0% · 12mo
- Down + closing
- —
- Monthly P&I
- —
- Monthly cashflow
- —
- DSCR
- —
- Eligible?
- —
Short-term bridge; refi at stabilization.
Listing history 17 events
-
2026-05-03status Pending
-
2026-04-27$280,000 Active
-
2024-10-23soldstatus Closed 142-char remark
Show marketing remark (142 chars)
Investor / or Flippers OPPORTUNITY ! ! ! 4 Plex building gutted and ready for your finishing touch ! ! set up for 4 1 bedroom 1 bath units .
-
2024-09-25historical 142-char remark
Show marketing remark (142 chars)
Investor / or Flippers OPPORTUNITY ! ! ! 4 Plex building gutted and ready for your finishing touch ! ! set up for 4 1 bedroom 1 bath units .
-
2024-09-14price $58,500 142-char remark
Show marketing remark (142 chars)
Investor / or Flippers OPPORTUNITY ! ! ! 4 Plex building gutted and ready for your finishing touch ! ! set up for 4 1 bedroom 1 bath units .
-
2024-08-30status Active 142-char remark
Show marketing remark (142 chars)
Investor / or Flippers OPPORTUNITY ! ! ! 4 Plex building gutted and ready for your finishing touch ! ! set up for 4 1 bedroom 1 bath units .
-
2024-08-08historical 142-char remark
Show marketing remark (142 chars)
Investor / or Flippers OPPORTUNITY ! ! ! 4 Plex building gutted and ready for your finishing touch ! ! set up for 4 1 bedroom 1 bath units .
-
2024-06-25price $64,900 142-char remark
Show marketing remark (142 chars)
Investor / or Flippers OPPORTUNITY ! ! ! 4 Plex building gutted and ready for your finishing touch ! ! set up for 4 1 bedroom 1 bath units .
-
2024-05-23price $72,500 142-char remark
Show marketing remark (142 chars)
Investor / or Flippers OPPORTUNITY ! ! ! 4 Plex building gutted and ready for your finishing touch ! ! set up for 4 1 bedroom 1 bath units .
-
2024-04-19$79,900 Active 142-char remark
Show marketing remark (142 chars)
Investor / or Flippers OPPORTUNITY ! ! ! 4 Plex building gutted and ready for your finishing touch ! ! set up for 4 1 bedroom 1 bath units .
-
2022-07-18$90,000 Active
-
2022-07-13historical
-
2021-12-03soldstatus
-
2021-11-18soldstatus
-
2021-04-12$14,900
-
2017-05-17soldstatus
-
2017-02-28$11,000
ⓘ Source: listings_history table (triggers on properties + properties_extension) + one-shot
backfill from property_details.listing_events for pre-trigger history.
Climate risk First Street
- Flood 1/10 Low FEMA zone X (unshaded) · 0% chance over 30 yrs
- Wildfire 1/10 Low
- Heat 4/10 Moderate 7 d/yr ≥106°F today · 19 d/yr by 30 yrs out
- Wind 2/10 Low
- Air quality 2/10 Low 0 unhealthy d/yr today · 1 by 30 yrs out
Nearby sold comps map
Loading sold comps map…
Walkable amenities ~0.75 mi
Loading nearby amenities…
Taxation est. · year 1
- Rental income
- $25,200
- − Mortgage interest
- −$15,684
- − Property taxes
- −$4,200
- − Insurance
- −$1,400
- − Repairs & maintenance
- −$2,016
- − Management
- −$2,016
- − Depreciation
- −$8,145
- Taxable loss
- −$8,262
- Est. tax savings @ 24.0%
- +$1,983
- After-tax cash flow
- $-1,329/yr
For passive investors: Depreciation is non-cash, so a rental often shows a tax loss while cash-flowing — sheltering income. Rental losses are passive: they offset passive income freely, and up to $25,000/yr can offset ordinary (W-2) income if you actively participate and your MAGI is under $100k (phasing out to $0 by $150k); unused losses carry forward. On sale, claimed depreciation is recaptured at up to 25%, and gains may owe capital-gains tax (a 1031 exchange can defer both). Figures are a year-1 estimate at your 24.0% rate — not tax advice; consult a CPA.
Schools (NCES district)
- District
- Jefferson City
- NCES district ID
- 2916190
- Math proficiency
- 34% ▼ -1.00%
- Reading proficiency
- 48% ▲ 5.00%
- Median HH income
- $51,903
- Composite
- 35.45/100
- National rank
- #4930
- State rank
- #121 of 324 in MO
Livability — Jefferson City
- Score
- 83/100
- State rank
- #7
- US rank
- #838
Category grades
Schools grade is shown separately in the Schools card above.
Census & demographics
- Census place
- Jefferson City, MO
- City population
- 41,145
- Population (ZIP)
- 29,777
Population outlook (Cole County) Hauer SSP2
- Today (2025)
- 78,107 people
- By 2030
- 78,089 · +-0.0%
- By 2040
- 76,814 · -1.7%
- By 2050
- 74,515 · -4.6%
- By 2075
- 67,687 · -13.3%
- By 2100
- 55,023 · -29.6%
Race, ethnicity, and origin ACS 2023
- Neighborhood character
- Predominantly White (73%)
- Race & ethnicity
- White 73% Black 19% Two or more races 5% Hispanic / Latino 3%
- Common ancestry
- Slovak 2% Lithuanian 2% Italian 1%
- Foreign-born
- 3% · Canada
- Languages at home
- 96% English-only · Spanish 2%
Political lean MEDSL · Cole
- 2024 margin
- Solid R (+34.4) · D 32.1% · R 66.5% · Other 1.4%
- 2008→2024 swing
- -7.5pp toward R · 2008: -26.9pp · 2024: -34.4pp
- All cycles
- 2024: R+34.4 2020: R+33.9 2016: R+36.8 2012: R+33.7 2008: R+26.9
Not yet ingested
- Civics
- —
Market trends
- HPI YoY
- ▼ -86.16%
- Current HPI
- 209.3832
- Rent YoY
- —
- Metro
- —
- State GDP YoY
- ▲ 1.84%
- F500 in state
- 20
Industry mix (Fortune 500 HQ in MO)
| Industry | F500 HQs | Revenue |
|---|---|---|
| Healthcare | 1 | $163B |
|
||
| Insurance | 1 | $21B |
|
||
| Industrial Technology | 1 | $17B |
|
||
| Retail | 1 | $16B |
|
||
| Industrial Distribution | 1 | $10B |
|
||
| Utilities | 1 | $9B |
|
||
Price history
+2445.5% since first listed17 events — show timeline
- 2026-05-03 Pending — JCMLS
- 2026-04-27 Listed $280,000 JCMLS
- 2024-10-23 Sold (MLS) — HMMLS
- 2024-09-25 Delisted — HMMLS
- 2024-09-14 Price Changed $58,500 HMMLS
- 2024-08-30 Relisted — HMMLS
- 2024-08-08 Delisted — HMMLS
- 2024-06-25 Price Changed $64,900 HMMLS
- 2024-05-23 Price Changed $72,500 HMMLS
- 2024-04-19 Listed $79,900 HMMLS
- 2022-07-18 Listed $90,000 CBORMLS
- 2022-07-13 Coming Soon — CBORMLS
- 2021-12-03 Sold (Public Records) — Public Records
- 2021-11-18 Sold (MLS) — JCMLS
- 2021-04-12 Listed $14,900 JCMLS
- 2017-05-17 Sold (MLS) — JCMLS
- 2017-02-28 Listed $11,000 JCMLS
Property tax history
-12.4%/yrLatest (2025): $120 · -76.7% YoY. Source: county tax records.
Cash-flow waterfall
monthlySold comps — $/sqft
last 12 mo · ≤1 miLoading sold comps…