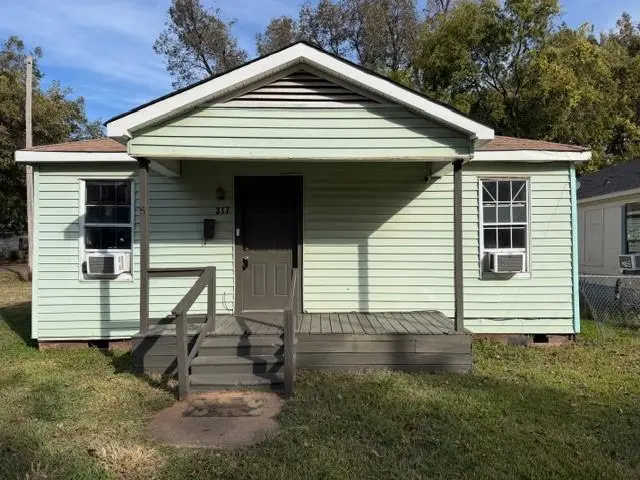
317 Kelly St · Bossier City, LA
Flood risk No data
- FEMA flood zone
- —
- Chance of flooding over 30 yrs
- —
- Est. flood insurance / yr
- —
Fire risk No data
- Est. fire insurance / yr
- —
Heat risk No data
- Hot days now (above threshold)
- —
- Hot days in 30 yrs
- —
Wind risk No data
- Chance of severe wind over 30 yrs
- —
Air-quality risk No data
- Unhealthy air days now
- —
- Unhealthy air days in 30 yrs
- —
Risk factors via First Street. Map © Google.
Why this score? — see what drove the B grade
The composite is a weighted blend of 9 inputs, each scored 0–100. Each bar is that input's sub-score; the figure is the points it added to the 100-point composite (weight × sub-score).
- Cash flow +30.0/30.0
- 1% rule +10.0/10.0
- DSCR +10.0/10.0
- ARV discount +8.8/15.0
- Rent growth +4.1/5.0
- Schools +3.8/10.0
- Livability +3.6/5.0
- Condition / age +2.5/5.0
- Appreciation +0.0/10.0
$72,000
🖨 Deal sheet (PDF) 📄 Offer letter ✓ Due diligence
Listing remarks MLS
Spacious 3-bedroom home situated on a desirable corner lot in Bossier City. This property has been recently remodeled by the current investor, offering updated finishes and a refreshed interior that makes it move-in ready for a new owner or tenant. The home features a functional layout with generous living space and strong rental potential, making it an attractive addition to any investment portfolio. Priced at just $72,000. This property is being offered as part of a larger investment package that includes two additional properties. All three MLS Numbers for this package are 21201955, 21201957, and 21201960. The full portfolio is available for $370,000 and consists of a total of seven rental doors, bringing in nearly $4,500 each month providing immediate scale for investors looking to expand or enter the market with multiple income-producing assets.
Key facts
- Recently remodeled
- Updated finishes
- Refreshed interior
Tags
Neighborhood map
What this means for you Summary
Snapshot
- This is a 3-bed/1.0-bath single-family listed at $72k.
Deal economics
- At list price, monthly cash flow is $650 ($8k/yr) — positive.
- The deal already cash-flows at list — no discount required.
- Meets the 1% rule at list price ($1k rent vs $72k).
- Recommended offer: $66k (9.0% below list) — sets the bar for market timing.
- Cap rate 17.1% vs local median 4.7% in Bossier City — top-decile yield for the area; either an underpriced asset or a hidden risk that comps aren't pricing in. Stress-test before assuming the spread holds.
Location & tenants
- Location reads 71/100 on livability (#47 in LA) — a middle-class / working-renter tenant base. Strengths: commute A+, cost of living A+, housing A+; Watch: employment D+, crime F, amenities F.
- Bossier Parish (urban): math 40% / reading 47% proficiency, ranked #17 of 98 in LA (top 17%) — families likely to look elsewhere, expect single-tenant / working-renter base with shorter leases.
- Zoned schools: Bossier Elementary School (math 8% / reading 17%, grade F, #550 of 646 statewide, top 88%, 222 students, 93% FRL); Greenacres Middle School (math 24% / reading 33%, grade F, #119 of 218 statewide, top 57%, 611 students, 75% FRL); Airline High School (math 49% / reading 56%, grade C-, #30 of 265 statewide, top 12%, 2,021 students, 56% FRL) — zoned schools average 75% FRL vs 41% district-wide (33 pts higher); higher-poverty schools than district average — tighter screening recommended.
- Zoned-school proficiency averages 31% at this address vs 44% district-wide (-12 pts) — the specific schools serving this property underperform the Bossier Parish average; the district grade overstates school quality for this exact location.
- Market conditions: Rents rising fast (+6.6%/yr); 426 active listings in the ZIP; 10 comparable units currently listed for rent nearby; rentals at typical pace (median 23d on market — plan ~3-4 weeks tenant-placement turnaround); 716 units permitted in Bossier Parish in 2024 (0 in 5+ unit buildings).
Forward outlook
- Local home prices are declining (-3.0%/yr); year-one equity from $498 of loan paydown is wiped out by about $2k of value loss. Plan a longer hold.
- Bossier County population projected at +28% by 2050 — long-run rental-demand tailwind backs the buy-and-hold thesis.
- At projected returns (-3.0% appreciation + 6.6% rent growth), your $20k cash investment doubles in ~3 years — after that, you're playing with house money.
Negotiation context
- It's been on market 104 days — a 9% lower offer ($66k) is reasonable based on typical stale-listing flexibility.
- 3 sale attempts since 3y ago; this cycle's ask has dropped $5k (6%) from the opening price — seller is motivated, your offer sets the floor, not the list.
Risks & watch-outs
- Watch-outs: built in 1947 — expect roof / HVAC / electrical / plumbing capex.
Questions for the listing agent
- It's been on market 104 days. Have you received any prior offers? Is the seller open to a 9% concession, seller financing, or rate buy-down credit?
- Built in 1947 — when were the roof, HVAC, electrical panel, plumbing, and water heater last replaced?
- Why hasn't it sold? Are there any deal-killer items the seller is aware of (foundation, flood, title, zoning, code violations)?
- Is there a deadline driving the sale (1031 exchange, divorce, estate, relocation)? That informs how much negotiation room exists.
- Schools are B-rated — typically a magnet for longer-tenancy family renters. What's the average tenant stay here, and is there a school-zone premium baked into asking?
- Crime grade is F in this area — have there been break-ins, vandalism, or insurance claims at this property in the last 3 years? What carrier currently insures it and at what premium?
- What's the average days-on-market for RENTAL listings here right now (not sales)? A rising rental-DOM trend means longer vacancies and softer asking-rent achievability than the comps imply.
- What's the recent tenant-quality profile in this submarket — average credit score on applications, eviction rate, late-payment / NSF rate, and stable-employment percentage? A property-management company in the area should have these aggregated.
- How much new for-sale + rental construction is in the pipeline within 1–3 miles? Heavy new supply typically softens prices + rents 12–24 months out; constrained supply supports both.
Investment metrics
- 1% rule
- 1.93% ✓
- Cap rate
- 17.13%
- Cash-on-cash
- 38.70%
- DSCR
- 2.72
- GRM
- 4.3
CMA / ARV
- ARV (median comp)
- $74,175
- List price
- $72,000
- Delta
- -2.93%
- Verdict
- FAIR
- Comps
- 20 within 1.0 mi
Show comp detail 6 sales within ~0.75 mi
| Address | Dist | Beds/Ba | Sqft | Sold | Price | $/sf | Match |
|---|---|---|---|---|---|---|---|
| 642 Joannes St | 0.33mi | 3/1.0 | 1,232 (-3%) | 20mo | $90,000 | $73 | 62 |
| 204 Montgomery St | 0.12mi | 4/1.0 (+1) | 1,172 (-8%) | 19mo | $49,900 | $43 | 60 |
| 329 Berry St | 0.17mi | 3/1.5 | 1,154 (-10%) | 21mo | $50,000 | $43 | 56 |
| 321 Wyche St | 0.25mi | 2/1.0 (-1) | 1,128 (-12%) | 16mo | $85,955 | $76 | 50 |
| 518 Thompson St | 0.24mi | 4/2.0 (+1) | 1,456 (+14%) | 11mo | $102,900 | $71 | 47 |
| 423 Adair St | 0.33mi | 4/1.5 (+1) | 1,400 (+10%) | 21mo | $39,000 | $28 | 44 |
Match score weights: distance 35% · size 25% · config 20% · recency 20%. Top-matched comps best support the ARV.
Projected returns pro-forma
-3.0% appreciation · 6.56% rent growth · sell at horizon
- IRR
- 38.7%
- Equity multiple
- 2.73×
- Total profit
- $34,904
- Equity at exit
- $10,735
- IRR
- 46.8%
- Equity multiple
- 6.28×
- Total profit
- $106,495
- Equity at exit
- $6,225
Cash invested: $20,160 (down + closing). Projections, not guarantees.
Landlord ↔ Tenant lean methodology
- Overall (STATE)
- 90 Strongly Landlord-Friendly
- State Louisiana
- 90 Strongly Landlord-Friendly · R+12
- County
- — inherits STATE
- City
- — inherits STATE
ZIP-level market 71111
- Home prices YoY
- -34.8%
- Rents YoY
- 6.6%
- Active inventory
- 426
- Price-to-rent
- 4.3×
Monthly cashflow live
- Estimated rent
- $1,392 high interval (Pro) →
- Mortgage (P&I)
- −$378
- Tax from tax record
- −$42 /mo · $506/yr
- Insurance
- −$30
- HOA
- −$0
- Vacancy / Maint / Mgmt
- −$292
- Net cashflow
- $650
Break-even live
Sensitivity live
| Price | -10% $691 | -5% $671 | +0% $650 | +5% $630 | +10% $609 |
|---|---|---|---|---|---|
| Rent | -10% $540 | -5% $595 | +0% $650 | +5% $705 | +10% $760 |
| Rate | -1.0pp $686 | -0.5pp $669 | base $650 | +0.5pp $632 | +1.0pp $613 |
UW: 25.0% down · 7.5% · 30yr · 1.5% tax · 5.0% vac · 8.0% maint · 8.0% mgmt
Financing live
Cash to close
- Down payment
- $18,000
- Closing costs
- $2,160
- Reserves months
- —
- Total cash needed
- —
Loan-product check · same deal, 3 products live
Conventional
25% down · 7.5% · 30yr
- Down + closing
- —
- Monthly P&I
- —
- Monthly cashflow
- —
- DSCR
- —
- Eligible?
- —
Personal DTI + credit; lowest rate.
DSCR
20% down · 8.5% · 30yr
- Down + closing
- —
- Monthly P&I
- —
- Monthly cashflow
- —
- DSCR
- —
- Eligible?
- —
No personal income docs; deal must DSCR.
Hard money
10% down · 12.0% · 12mo
- Down + closing
- —
- Monthly P&I
- —
- Monthly cashflow
- —
- DSCR
- —
- Eligible?
- —
Short-term bridge; refi at stabilization.
Rent comps 10 comps
| Address | Beds | Baths | Sqft | Rent | $/sqft | DOM | Units | Dist |
|---|---|---|---|---|---|---|---|---|
| 413 Montgomery St Bossier City, LA | 3.0 | 1.0 | 1152 | $1,000 | $0.87 | 15d | 1 | 0.12mi |
| 301 Edwards St Bossier City, LA | 2.0 | 1.0 | 900 | $1,175 | $1.31 | 22d | 1 | 0.20mi |
| 1735 Green St Bossier City, LA | 4.0 | 2.0 | 1488 | $1,775 | $1.19 | 45d | 1 | 0.67mi |
| 1225 Delhi St Bossier City, LA | 3.0 | 1.0 | 1092 | $800 | $0.73 | 22d | 1 | 1.13mi |
| 2400 Broadway Dr Bossier City, LA | 3.0 | 1.0 | 1295 | $1,450 | $1.12 | 15d | 1 | 1.23mi |
| 719 Edwards St Shreveport, LA | 1.0–2.0 | 1.0 | 810 | $1,275 | $1.57 | 22d | 7 | 1.26mi |
| 1518 Viosca St Bossier City, LA | 3.0 | 2.0 | 1434 | $1,200 | $0.84 | 22d | 1 | 1.39mi |
| 1005 Clarence St Bossier City, LA | 3.0 | 2.0 | 1203 | $1,300 | $1.08 | 45d | 1 | 1.40mi |
| 624 Texas St Shreveport, LA | 2.0 | 1.5 | 953 | $2,358 | $2.47 | 15d | 2 | 1.40mi |
| 1525 Debra St Bossier City, LA | 3.0 | 1.0 | 1033 | $975 | $0.94 | 22d | 1 | 1.48mi |
Listing history 24 events
-
2026-06-21days on market $72,000 Active 104 DOM
-
2026-06-18days on market $72,000 Active 101 DOM
-
2026-06-17days on market $72,000 Active 100 DOM
-
2026-06-16days on market $72,000 Active 99 DOM
-
2026-06-15days on market $72,000 Active 98 DOM
-
2026-06-14days on market $72,000 Active 96 DOM
-
2026-06-13days on market $72,000 Active 95 DOM
-
2026-06-10days on market $72,000 Active 93 DOM
-
2026-06-09days on market $72,000 Active 92 DOM
-
2026-06-08days on market $72,000 Active 91 DOM
-
2026-06-07days on market $72,000 Active 90 DOM
-
2026-06-02days on market $72,000 Active 85 DOM
-
2026-06-01days on market $72,000 Active 84 DOM
-
2026-05-31days on market $72,000 Active 83 DOM
-
2026-05-30days on market $72,000 Active 82 DOM
-
2026-05-19price $72,000 869-char remark
Show marketing remark (869 chars)
Spacious 3-bedroom home situated on a desirable corner lot in Bossier City. This property has been recently remodeled by the current investor, offering updated finishes and a refreshed interior that makes it move-in ready for a new owner or tenant. The home features a functional layout with generous living space and strong rental potential, making it an attractive addition to any investment portfolio. Priced at just $72,000. This property is being offered as part of a larger investment package that includes two additional properties. All three MLS Numbers for this package are 21201955, 21201957, and 21201960. The full portfolio is available for $370,000 and consists of a total of seven rental doors, bringing in nearly $4,500 each month providing immediate scale for investors looking to expand or enter the market with multiple income-producing assets.
-
2026-04-10historical $900
-
2026-03-08$77,000 Active 869-char remark
Show marketing remark (869 chars)
Spacious 3-bedroom home situated on a desirable corner lot in Bossier City. This property has been recently remodeled by the current investor, offering updated finishes and a refreshed interior that makes it move-in ready for a new owner or tenant. The home features a functional layout with generous living space and strong rental potential, making it an attractive addition to any investment portfolio. Priced at just $72,000. This property is being offered as part of a larger investment package that includes two additional properties. All three MLS Numbers for this package are 21201955, 21201957, and 21201960. The full portfolio is available for $370,000 and consists of a total of seven rental doors, bringing in nearly $4,500 each month providing immediate scale for investors looking to expand or enter the market with multiple income-producing assets.
-
2026-02-17price $900
-
2026-01-19price $950
-
2025-11-26price $975
-
2025-11-13$1,000
-
2023-10-27historical $1,100
-
2023-10-08$1,100
ⓘ Source: listings_history table (triggers on properties + properties_extension) + one-shot
backfill from property_details.listing_events for pre-trigger history.
Tax reassessment forecast LA · Resets to sale price
- Current annual tax
- $506 · $42/mo
- Projected year-2 tax
- $506 · $42/mo
- Expected delta
- $0/yr ($0/mo · 0.0%)
ⓘ Screening estimate from a state-policy table — verify with the county assessor before closing.
Nearby sold comps map
Loading sold comps map…
Walkable amenities ~0.75 mi
Loading nearby amenities…
Taxation est. · year 1
- Rental income
- $16,708
- − Mortgage interest
- −$4,033
- − Property taxes
- −$506
- − Insurance
- −$360
- − Repairs & maintenance
- −$1,337
- − Management
- −$1,337
- − Depreciation
- −$2,095
- Taxable income
- $7,041
- Est. tax owed @ 24.0%
- −$1,690
- After-tax cash flow
- $6,113/yr
For passive investors: Depreciation is non-cash, so a rental often shows a tax loss while cash-flowing — sheltering income. Rental losses are passive: they offset passive income freely, and up to $25,000/yr can offset ordinary (W-2) income if you actively participate and your MAGI is under $100k (phasing out to $0 by $150k); unused losses carry forward. On sale, claimed depreciation is recaptured at up to 25%, and gains may owe capital-gains tax (a 1031 exchange can defer both). Figures are a year-1 estimate at your 24.0% rate — not tax advice; consult a CPA.
Schools (NCES district)
- District
- Bossier Parish
- NCES district ID
- 2200270
- Math proficiency
- 40% ▼ -32.00%
- Reading proficiency
- 47% ▼ -28.00%
- Median HH income
- $51,326
- Composite
- 37.5/100
- National rank
- #4402
- State rank
- #17 of 98 in LA
Livability — Bossier City
- Score
- 71/100
- State rank
- #47
- US rank
- #7044
Category grades
Schools grade is shown separately in the Schools card above.
Census & demographics
- Census place
- Bossier City, LA
- County
- Bossier Parish · 98,704 people
- City population
- 91,925
- Metro
- Shreveport-Bossier City, LA
- Population (ZIP)
- 43,925
- Household income
- $65,292
- Rent vs Own
- Severe rent burden
- 1942.0
Population outlook (Bossier County) Hauer SSP2
- Today (2025)
- 143,247 people
- By 2030
- 151,802 · +6.0%
- By 2040
- 168,194 · +17.4%
- By 2050
- 183,533 · +28.1%
- By 2075
- 217,009 · +51.5%
- By 2100
- 230,091 · +60.6%
Race, ethnicity, and origin ACS 2023
- Neighborhood character
- Diverse neighborhood (Simpson 0.60)
- Race & ethnicity
- White 56% Black 29% Hispanic / Latino 9% Two or more races 8% Asian 3%
- Hispanic origin (detail)
- Mexican 5%
- Common ancestry
- Lithuanian 2% Iranian 1% Slovak 1%
- Foreign-born
- 5% · Canada, Vietnam
- Languages at home
- 90% English-only · Spanish 7% Vietnamese 1% French/Haitian/Cajun 1%
Political lean MEDSL · Bossier
- 2024 margin
- Solid R (+43.3) · D 27.7% · R 71.0% · Other 1.3%
- 2008→2024 swing
- +0.3pp no change · 2008: -43.7pp · 2024: -43.3pp
- All cycles
- 2024: R+43.3 2020: R+41.0 2016: R+45.8 2012: R+45.4 2008: R+43.7
Not yet ingested
- Civics
- —
Market trends
- HPI YoY
- ▼ -79.78%
- Current HPI
- 149.4336
- Rent YoY
- ▲ 6.56%
- Metro
- Shreveport-Bossier City, LA
- State GDP YoY
- ▲ 3.29%
- F500 in state
- 10
Industry mix (Fortune 500 HQ in LA)
| Industry | F500 HQs | Revenue |
|---|---|---|
| Telecommunications | 2 | $23B |
|
||
| Utilities | 1 | $12B |
|
||
| Wholesale / Distribution | 1 | $5B |
|
||
| Advertising | 1 | $2B |
|
||
Price history
+6445.5% since first listed9 events — show timeline
- 2026-05-19 Price Changed $72,000 NTREIS
- 2026-04-10 Rental Removed $900 NTREIS
- 2026-03-08 Listed $77,000 NTREIS
- 2026-02-17 Price Changed $900 NTREIS
- 2026-01-19 Price Changed $950 NTREIS
- 2025-11-26 Price Changed $975 NTREIS
- 2025-11-13 Listed for Rent $1,000 NTREIS
- 2023-10-27 Rental Removed $1,100 APPFOLIO
- 2023-10-08 Listed for Rent $1,100 APPFOLIO
Property tax history
+0.2%/yrLatest (2025): $506 · -1.3% YoY. Source: county tax records.
Cash-flow waterfall
monthlySold comps — $/sqft
last 12 mo · ≤1 miLoading sold comps…