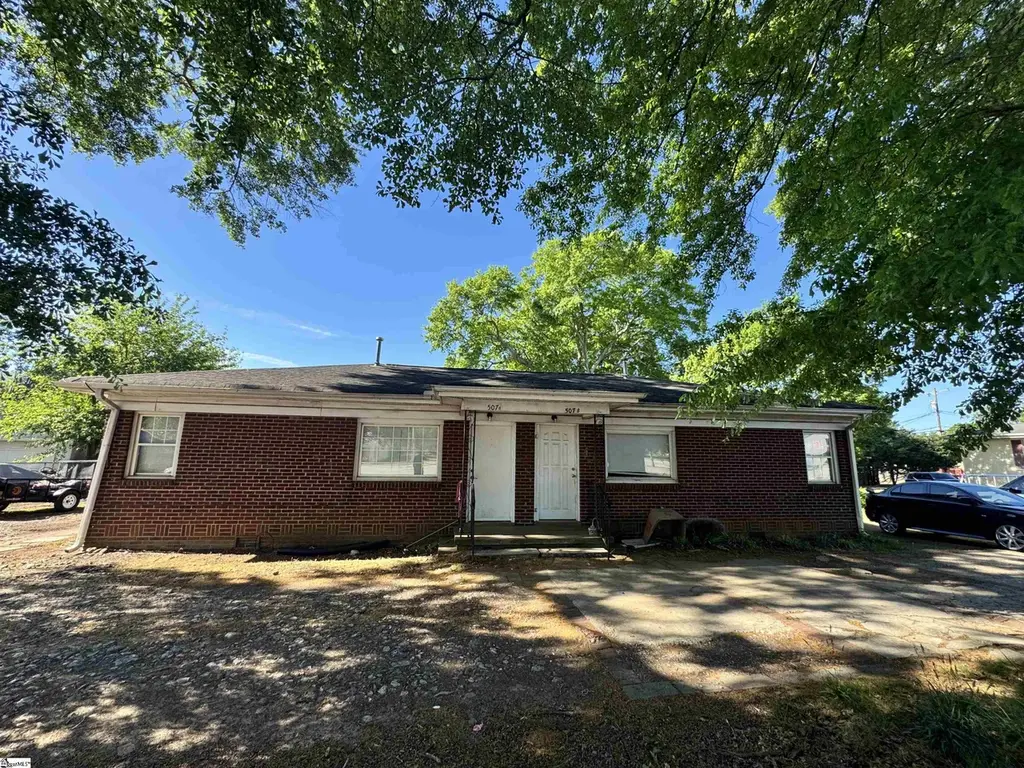
 Duplex
507 Cedar Lane Rd · Parker, SC
Flood risk 1/10 · Minimal
- FEMA flood zone
- X (unshaded)
- Chance of flooding over 30 yrs
- 0.0%
- Est. flood insurance / yr
- $507 – $1,088
Fire risk 1/10 · Minimal
- Est. fire insurance / yr
- $783 – $1,453
Heat risk 6/10 · Moderate
- Hot days now (above 102°F)
- 7 days/yr
- Hot days in 30 yrs
- 17 days/yr
Wind risk 2/10 · Minimal
- Chance of severe wind over 30 yrs
- 0.0%
Air-quality risk 4/10 · Minor
- Unhealthy air days now
- 3 days/yr
- Unhealthy air days in 30 yrs
- 4 days/yr
Risk factors via First Street. Map © Google.
Why this score? — see what drove the C- grade
The composite is a weighted blend of 9 inputs, each scored 0–100. Each bar is that input's sub-score; the figure is the points it added to the 100-point composite (weight × sub-score).
- Cash flow +20.3/30.0
- ARV discount +7.5/15.0
- DSCR +6.5/10.0
- 1% rule +4.6/10.0
- Schools +4.2/10.0
- Livability +3.7/5.0
- Rent growth +2.9/5.0
- Condition / age +2.5/5.0
- Appreciation +0.0/10.0
$299,900
🖨 Deal sheet (PDF) 📄 Offer letter ✓ Due diligence
Multi-family units
County records classify this as Multi-Family (2-4 Unit). Listing-text estimate: 2 units. confirmed
Listing remarks
Location! Potential to convert to Commercial if you wish. Duplex Home with 2 bedrooms, one bath on each side. All the possibilities with this property. Live in one unit, flip little by little, and rent out the other unit along with a storage opportunity at the rear of the home. Or INVESTORS, come add your vision to this growing location! Only 8 min to Downtown Greenville! Fix, Hold, and Flip! Sold As- Is. Driven by strong rental demand, this property offers investors the potential for steady cash flow today while building long-term equity and appreciation over time. Investors looking for a 1031 Exchange, here is your opportunity. Tenant occupied on a month-to-month basis.
Key facts
- 9,147 sq ft lot
- 2 parking spots
- Listed 13 days
Property features AI
Finance
- HOA & community: No community amenities listed
Exterior
- Parking: Paved driveway
- Utilities: Public water; Electric water heater; Public sewer (also listed as private sewer); Public garbage pickup
- Home design: Single-story building; Duplex (2 total units)
- Construction: Crawl space foundation; Year built unknown
- Exterior features: Brick veneer exterior; Architectural roof
Interior
- Kitchen: Unit 2: Kitchen/Breakfast Room
- Bedrooms: Unit 1: 2 bedrooms; Unit 2: 2 bedrooms
- Bathrooms: Unit 1: 1 full bathroom; Unit 2: 1 full bathroom
- Heating & cooling: Forced air heating; Central forced cooling
- Interior features: Two separate units (duplex); Unit 2 includes a balcony, kitchen/breakfast area, and a living/great room
Neighborhood map
What this means for you Summary
Snapshot
- This is a 2 × 2-bed/1.0-bath units multifamily listed at $300k.
Deal economics
- At list price, monthly cash flow is $386 ($5k/yr) — positive. Per door: $193/mo.
- The deal already cash-flows at list — no discount required.
- To meet the 1% rule (rent ≥ 1% of price), the offer needs to be $288k (4.1% below list).
- Recommended offer: $288k (4.1% below list) — sets the bar for 1% rule.
- Cap rate 7.8% vs local median 4.2% in Parker — top-decile yield for the area; either an underpriced asset or a hidden risk that comps aren't pricing in. Stress-test before assuming the spread holds.
Location & tenants
- Location reads 74/100 on livability (#31 in SC, #4,642 nationally) — a middle-class / working-renter tenant base. Strengths: commute A+, cost of living A+, housing A+; Watch: crime F, employment D-.
- Greenville 01 (suburban): math 44% / reading 54% proficiency, ranked #10 of 80 in SC (top 12%) — families likely to look elsewhere, expect single-tenant / working-renter base with shorter leases.
- Zoned schools: Monaview Elementary (math 40% / reading 24%, grade F, #369 of 597 statewide, top 64%, 615 students, 100% FRL) — zoned schools average 100% FRL vs 42% district-wide (58 pts higher); higher-poverty schools than district average — tighter screening recommended.
- Zoned-school proficiency averages 32% at this address vs 49% district-wide (-17 pts) — the specific schools serving this property underperform the Greenville 01 average; the district grade overstates school quality for this exact location.
- Market conditions: Rents rising (+1.7%/yr); 278 active listings in the ZIP; 15 comparable units currently listed for rent nearby; rentals at typical pace (median 16d on market — plan ~3-4 weeks tenant-placement turnaround); 5,595 units permitted in Greenville County in 2024 (566 in 5+ unit buildings).
- At $2,875/mo this rent would consume 67% of the median local household income ($52k/yr) (locally 1754% of renters already pay >50% of income on rent) — very limited rent-growth headroom before tenants either downsize or default.
Forward outlook
- Local home prices are declining (-3.0%/yr); year-one equity from $2k of loan paydown is wiped out by about $9k of value loss. Plan a longer hold.
- Greenville County population projected at +34% by 2050 — long-run rental-demand tailwind backs the buy-and-hold thesis.
Negotiation context
- Only 13 days on market — expect competitive offers; lowballing is unlikely to land.
- Current owner paid $85k; list at $300k implies a 253% gain — meaningful room to come down on a strong offer.
Risks & watch-outs
- Watch-outs: built in 1950 — expect roof / HVAC / electrical / plumbing capex.
- Climate carrying-cost: extreme-heat days projected 7→17/yr by 2055 (HVAC capex compounding) — expect insurance premiums to compound above CPI over the hold.
Questions for the listing agent
- Can we see the unit-by-unit rent roll, current vacancy, and any below-market leases? What's the average tenancy length?
- What capital expenditures (roof, boiler, parking lot, exteriors) have been made in the last 5 years, and what's planned in the next 2?
- Built in 1950 — when were the roof, HVAC, electrical panel, plumbing, and water heater last replaced?
- Is there a deadline driving the sale (1031 exchange, divorce, estate, relocation)? That informs how much negotiation room exists.
- Schools are F-rated, which usually means shorter tenancies and higher turnover. Who's the typical renter profile here, and what's been the actual vacancy rate?
- Crime grade is F in this area — have there been break-ins, vandalism, or insurance claims at this property in the last 3 years? What carrier currently insures it and at what premium?
- What's the average days-on-market for RENTAL listings here right now (not sales)? A rising rental-DOM trend means longer vacancies and softer asking-rent achievability than the comps imply.
- What's the recent tenant-quality profile in this submarket — average credit score on applications, eviction rate, late-payment / NSF rate, and stable-employment percentage? A property-management company in the area should have these aggregated.
- How much new apartment / multifamily construction is in the pipeline within 1–3 miles? Heavy new supply (>2% of stock underway) typically softens rents 12–24 months out; light construction supports rent growth.
Investment metrics
- 1% rule
- 0.96% ✗
- Cap rate
- 7.84%
- Cash-on-cash
- 5.52%
- DSCR
- 1.25
- GRM
- 8.7
CMA / ARV
No comps found within radius.
Projected returns pro-forma
-3.0% appreciation · 1.72% rent growth · sell at horizon
- IRR
- -9.1%
- Equity multiple
- 0.67×
- Total profit
- $-27,710
- Equity at exit
- $44,716
- IRR
- -1.4%
- Equity multiple
- 0.91×
- Total profit
- $-7,347
- Equity at exit
- $25,930
Cash invested: $83,972 (down + closing). Projections, not guarantees.
Landlord ↔ Tenant lean methodology
- Overall (STATE)
- 90 Strongly Landlord-Friendly
- State South Carolina
- 90 Strongly Landlord-Friendly · R+6
- County
- — inherits STATE
- City
- — inherits STATE
ZIP-level market 29611
- Home prices YoY
- -34.6%
- Rents YoY
- 1.7%
- Active inventory
- 278
- Price-to-rent
- 17.4×
Monthly cashflow live
- Estimated rent
- $2,875 high interval (Pro) →
- Mortgage (P&I)
- −$1,573
- Tax from tax record
- −$187 /mo · $2,245/yr
- Insurance
- −$125
- HOA
- −$0
- Vacancy / Maint / Mgmt
- −$604
- Net cashflow
- $386
Break-even live
Sensitivity live
| Price | -10% $556 | -5% $471 | +0% $386 | +5% $302 | +10% $217 |
|---|---|---|---|---|---|
| Rent | -10% $159 | -5% $273 | +0% $386 | +5% $500 | +10% $614 |
| Rate | -1.0pp $538 | -0.5pp $463 | base $386 | +0.5pp $309 | +1.0pp $230 |
2-unit breakdown (identical units grouped — click to expand)
| Units | Beds | Baths | Est. rent |
|---|---|---|---|
| 2× units | 2 | 1 | $2,874 |
| #1 | 2 | 1 | $1,437 |
| #2 | 2 | 1 | $1,437 |
| Total (2 units) | $2,875 | ||
UW: 25.0% down · 7.5% · 30yr · 1.5% tax · 5.0% vac · 8.0% maint · 8.0% mgmt
Financing live
Cash to close
- Down payment
- $74,975
- Closing costs
- $8,997
- Reserves months
- —
- Total cash needed
- —
Loan-product check · same deal, 3 products live
Conventional
25% down · 7.5% · 30yr
- Down + closing
- —
- Monthly P&I
- —
- Monthly cashflow
- —
- DSCR
- —
- Eligible?
- —
Personal DTI + credit; lowest rate.
DSCR
20% down · 8.5% · 30yr
- Down + closing
- —
- Monthly P&I
- —
- Monthly cashflow
- —
- DSCR
- —
- Eligible?
- —
No personal income docs; deal must DSCR.
Hard money
10% down · 12.0% · 12mo
- Down + closing
- —
- Monthly P&I
- —
- Monthly cashflow
- —
- DSCR
- —
- Eligible?
- —
Short-term bridge; refi at stabilization.
Rent comps 15 comps
| Address | Beds | Baths | Sqft | Rent | $/sqft | DOM | Units | Dist |
|---|---|---|---|---|---|---|---|---|
| 3 Frost St Greenville, SC | 3.0 | 2.0 | 1450 | $1,900 | $1.31 | 25d | 1 | 0.37mi |
| 25 Louise Ave Greenville, SC | 3.0 | 3.0 | 1600 | $1,999 | $1.25 | 25d | 1 | 0.67mi |
| 103 Fernside Ct Greenville, SC | 3.0 | 2.5 | 1210 | $1,750 | $1.45 | 5d | 1 | 0.74mi |
| 14 Pine Thicket Dr Greenville, SC | 3.0 | 2.5 | 1475 | $1,595 | $1.08 | 25d | 1 | 0.75mi |
| 12 Catawba Ave Greenville, SC | 3.0 | 2.5 | 1399 | $1,650 | $1.18 | 16d | 1 | 0.77mi |
| 5 Zarline St Greenville, SC | 3.0 | 1.0 | 1060 | $1,095 | $1.03 | 20d | 1 | 0.79mi |
| 525 Hampton Townes Dr Unit 1 Greenville, SC | 3.0 | 2.5 | 1286 | $1,775 | $1.38 | 13d | 1 | 0.79mi |
| 39 E 7th St Greenville, SC | 3.0 | 2.0 | 1120 | $1,750 | $1.56 | 5d | 1 | 0.90mi |
| 31 Victor St Unit 326 Greenville, SC | 4.0 | 2.0 | 1315 | $2,499 | $1.90 | 25d | 1 | 1.03mi |
| 1 E Main St Greenville, SC | 1.0–3.0 | 1.0–2.0 | 1241 | $2,600 | $2.10 | 5d | 28 | 1.20mi |
| 9 Gilreath St Greenville, SC | 3.0 | 2.0 | 1244 | $1,495 | $1.20 | 23d | 1 | 1.21mi |
| 5 Charles St Greenville, SC | 3.0 | 2.0 | 1492 | $1,800 | $1.21 | 25d | 1 | 1.22mi |
| 34 3rd St Greenville, SC | 4.0 | 3.0 | 2100 | $2,650 | $1.26 | 16d | 1 | 1.33mi |
| 420 Oscar St Greenville, SC | 3.0 | 2.0 | 1400 | $1,800 | $1.29 | 5d | 1 | 1.39mi |
| 7 Iola St Greenville, SC | 3.0 | 2.0 | 1165 | $2,500 | $2.15 | 16d | 1 | 1.42mi |
Listing history 10 events
-
2026-06-22days on market $299,900 Active 13 DOM
-
2026-06-18days on market $299,900 Active 10 DOM
-
2026-06-17days on market $299,900 Active 9 DOM
-
2026-06-16days on market $299,900 Active 8 DOM
-
2026-06-15days on market $299,900 Active 7 DOM
-
2026-06-13days on market $299,900 Active 5 DOM
-
2026-06-13days on market $299,900 Active 4 DOM
-
2026-06-10days on market $299,900 Active 2 DOM
-
2026-06-09remarks 680-char remark
-
2026-06-09$299,900 Active 1 DOM
ⓘ Source: listings_history table (triggers on properties + properties_extension) + one-shot
backfill from property_details.listing_events for pre-trigger history.
Tax reassessment forecast SC · Resets to sale price
- Current annual tax
- $2,245 · $187/mo
- Projected year-2 tax
- $2,245 · $187/mo
- Expected delta
- $0/yr ($0/mo · 0.0%)
ⓘ Screening estimate from a state-policy table — verify with the county assessor before closing.
Climate risk First Street
- Flood 1/10 Low FEMA zone X (unshaded) · 0% chance over 30 yrs
- Wildfire 1/10 Low
- Heat 6/10 Major 7 d/yr ≥102°F today · 17 d/yr by 30 yrs out
- Wind 2/10 Low 0% chance of damaging wind over 30 yrs
- Air quality 4/10 Moderate 3 unhealthy d/yr today · 4 by 30 yrs out
Nearby sold comps map
Loading sold comps map…
Walkable amenities ~0.75 mi
Loading nearby amenities…
Taxation est. · year 1
- Rental income
- $34,500
- − Mortgage interest
- −$16,799
- − Property taxes
- −$2,245
- − Insurance
- −$1,500
- − Repairs & maintenance
- −$2,760
- − Management
- −$2,760
- − Depreciation
- −$8,724
- Taxable loss
- −$288
- Est. tax savings @ 24.0%
- +$69
- After-tax cash flow
- $4,707/yr
For passive investors: Depreciation is non-cash, so a rental often shows a tax loss while cash-flowing — sheltering income. Rental losses are passive: they offset passive income freely, and up to $25,000/yr can offset ordinary (W-2) income if you actively participate and your MAGI is under $100k (phasing out to $0 by $150k); unused losses carry forward. On sale, claimed depreciation is recaptured at up to 25%, and gains may owe capital-gains tax (a 1031 exchange can defer both). Figures are a year-1 estimate at your 24.0% rate — not tax advice; consult a CPA.
Schools (NCES district)
- District
- Greenville 01
- NCES district ID
- 4502310
- Math proficiency
- 44% ▼ -10.00%
- Reading proficiency
- 54% ▼ -2.00%
- Median HH income
- $49,596
- Composite
- 41.88/100
- National rank
- #3370
- State rank
- #10 of 80 in SC
Livability — Parker
- Score
- 74/100
- State rank
- #31
- US rank
- #4642
Category grades
Schools grade is shown separately in the Schools card above.
Census & demographics
- Census place
- Parker, SC
- County
- Greenville County · 573,815 people
- Metro
- Greenville-Anderson, SC
- Population (ZIP)
- 32,365
- Household income
- $51,565
- Rent vs Own
- Severe rent burden
- 1754.0
Population outlook (Greenville County) Hauer SSP2
- Today (2025)
- 574,580 people
- By 2030
- 615,615 · +7.1%
- By 2040
- 695,373 · +21.0%
- By 2050
- 769,367 · +33.9%
- By 2075
- 933,296 · +62.4%
- By 2100
- 1,029,196 · +79.1%
Race, ethnicity, and origin ACS 2023
- Neighborhood character
- Highly diverse neighborhood (Simpson 0.70)
- Race & ethnicity
- White 41% Black 29% Hispanic / Latino 22% Two or more races 12%
- Hispanic origin (detail)
- Mexican 12% Puerto Rican 2%
- Common ancestry
- Slovak 1% Italian 1% Serbian 1%
- Foreign-born
- 12% · Canada, Jamaica, China
- Languages at home
- 79% English-only · Spanish 19% Russian/Polish/Slavic 1%
Political lean MEDSL · Greenville
- 2024 margin
- Strong R (+22.2) · D 38.0% · R 60.2% · Other 1.8%
- 2008→2024 swing
- +1.7pp toward D · 2008: -23.9pp · 2024: -22.2pp
- All cycles
- 2024: R+22.2 2020: R+18.2 2016: R+24.7 2012: R+27.8 2008: R+23.9
Not yet ingested
- Civics
- —
Market trends
- HPI YoY
- ▼ -139.58%
- Current HPI
- 264.2891
- Rent YoY
- ▲ 1.72%
- Metro
- Greenville-Anderson, SC
- State GDP YoY
- ▲ 4.51%
- F500 in state
- 2
Industry mix (Fortune 500 HQ in SC)
| Industry | F500 HQs | Revenue |
|---|---|---|
| Packaging | 1 | $7B |
|
||
Price history
+224.2% since first listed3 events — show timeline
- 2026-06-09 Listed $299,900 Greater Greenville MLS
- 2006-08-04 Sold (Public Records) $85,000 Public Records
- 1993-04-25 Sold (Public Records) $92,500 Public Records
Property tax history
+1.2%/yrLatest (2025): $2,245 · +2.9% YoY. Source: county tax records.
Cash-flow waterfall
monthlySold comps — $/sqft
last 12 mo · ≤1 miLoading sold comps…