162 Morning Vly · San Antonio, TX
Flood risk 1/10 · Minimal
- FEMA flood zone
- X (unshaded)
- Chance of flooding over 30 yrs
- 0.0%
- Est. flood insurance / yr
- $507 – $1,088
Fire risk 4/10 · Minor
- Est. fire insurance / yr
- $1,222 – $2,270
Heat risk 8/10 · Major
- Hot days now (above 108°F)
- 7 days/yr
- Hot days in 30 yrs
- 22 days/yr
Wind risk 7/10 · Major
- Chance of severe wind over 30 yrs
- 78.0%
Air-quality risk 2/10 · Minimal
- Unhealthy air days now
- 1 days/yr
- Unhealthy air days in 30 yrs
- 1 days/yr
Risk factors via First Street. Map © Google.
Why this score? — see what drove the D+ grade
The composite is a weighted blend of 9 inputs, each scored 0–100. Each bar is that input's sub-score; the figure is the points it added to the 100-point composite (weight × sub-score).
- Cash flow +14.4/30.0
- ARV discount +13.9/15.0
- 1% rule +5.1/10.0
- DSCR +4.4/10.0
- Livability +4.0/5.0
- Condition / age +2.5/5.0
- Schools +2.2/10.0
- Rent growth +2.1/5.0
- Appreciation +0.0/10.0
$155,900
🖨 Deal sheet (PDF) 📄 Offer letter ✓ Due diligence
Listing remarks
Newly updated and back on market! This well-located home on the city's southwest side offers comfort and convenience for a variety of lifestyles. Conveniently positioned near Lackland AFB, SeaWorld, Loop 1604, and Hwy 90, it provides easy access to schools, parks, shopping, and dining. Whether you're looking for your first home or your next chapter, this property presents a wonderful opportunity to settle into a welcoming and established neighborhood. The seller is motivated and open to making any additional repairs or seller concessions with an acceptable offer. Renovation loan options are available, and a renovation flyer will be made available during showings. This home is full of potent
Key facts
- Well located home
- Easy access to parks
- 8,407 sq ft lot
Tags
Property features AI
Finance
- Financial info: Down payment assistance resources available
- HOA & community: Subdivision: VALLEY HI; Neighborhood amenities: Other (see remarks)
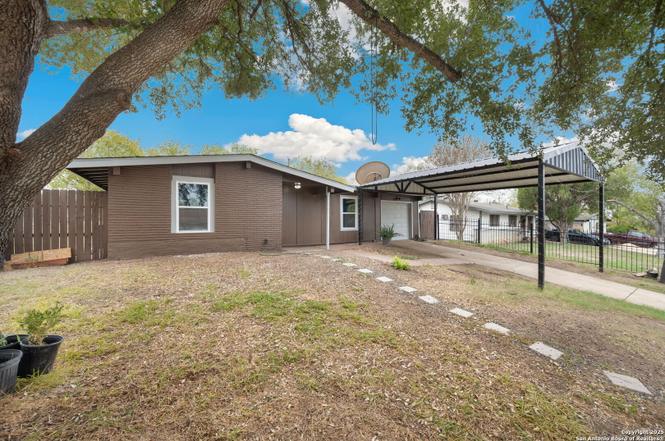
Exterior
- Parking: 1-car garage
- Utilities: City water and sewer
- Home design: Pre-owned single-family property; Approximately 59 years old
- Construction: Slab foundation; Wood shingle/shake roof
- Exterior features: Asbestos shingle and brick exterior
Interior
- Kitchen: Gas cooktop
- Bedrooms: Master bedroom on lower level (approx. 10 x 10); Bedroom 2 (approx. 10 x 10); Bedroom 3 (approx. 10 x 10)
- Flooring: Wood floors
- Bathrooms: 1 full bathroom
- Heating & cooling: Central heating with natural gas; Central air conditioning
- Interior features: Ceiling fans; Living and dining area combined; Study/Library; Ground level with no steps; Laundry located in the garage; Washer and dryer connections; Gas water heater; Gas cooktop
- Laundry & utility: Washer connection; Dryer connection; Laundry area in garage
Neighborhood map
What this means for you Summary
Snapshot
- This is a 3-bed/1.0-bath single-family listed at $156k.
Deal economics
- At list price, monthly cash flow is $31 ($375/yr) — positive.
- The deal already cash-flows at list — no discount required.
- Meets the 1% rule at list price ($2k rent vs $156k).
- Recommended offer: $137k (12.0% below list) — sets the bar for market timing.
- Cap rate 6.5% vs local median 3.8% in San Antonio — top-decile yield for the area; either an underpriced asset or a hidden risk that comps aren't pricing in. Stress-test before assuming the spread holds.
Location & tenants
- Location reads 80/100 on livability (#31 in TX, #1,616 nationally) — a professional / high-income tenant draw. Strengths: amenities A+, commute A+, cost of living A+; Watch: crime F.
- Southwest ISD (rural): math 21% / reading 31% proficiency, ranked #701 of 826 in TX (top 85%) — low school quality limits family demand, transient renter base, plan for 1-2y turnover; 75% free/reduced lunch — lower-income household profile, screen leases tightly.
- Zoned schools: Sun Valley El (math 21% / reading 29%, grade F, #3,013 of 4,322 statewide, top 70%, 650 students, 80% FRL); Francis R Scobee Middle (math 23% / reading 30%, grade F, #1,200 of 1,662 statewide, top 73%, 856 students, 73% FRL); Southwest H S (math 17% / reading 39%, grade F, #1,170 of 1,632 statewide, top 72%, 2,152 students, 72% FRL) — zoned schools at 75% FRL track the district average.
- Market conditions: Rents soft (-1.7%/yr); 30 active listings in the ZIP; 36 comparable units currently listed for rent nearby; rentals at typical pace (median 20d on market — plan ~3-4 weeks tenant-placement turnaround); 8,308 units permitted in Bexar County in 2024 (2,506 in 5+ unit buildings).
- This rent runs 37% of the median local income ($52k/yr) — at the standard rent-burdened threshold; future hikes will face affordability resistance.
Forward outlook
- Local home prices are declining (-3.0%/yr); year-one equity from $1k of loan paydown is wiped out by about $5k of value loss. Plan a longer hold.
- Bexar County population projected at +50% by 2050 — long-run rental-demand tailwind backs the buy-and-hold thesis.
Negotiation context
- It's been on market 219 days — a 12% lower offer ($137k) is reasonable based on typical stale-listing flexibility.
- 5 sale attempts since 19y ago; this cycle's ask has dropped $44k (22%) from the opening price — seller is motivated, your offer sets the floor, not the list.
Risks & watch-outs
- Watch-outs: property tax is 2.6% of price.
- Climate carrying-cost: major wind risk, 78% chance of damaging wind over 30y; extreme-heat days projected 7→22/yr by 2055 (HVAC capex compounding) — expect insurance premiums to compound above CPI over the hold.
Questions for the listing agent
- It's been on market 219 days. Have you received any prior offers? Is the seller open to a 12% concession, seller financing, or rate buy-down credit?
- Built in 1966 — when were the roof, HVAC, electrical panel, plumbing, and water heater last replaced?
- Property tax is high relative to price — has the assessment been appealed recently, and will the sale trigger a re-assessment?
- Why hasn't it sold? Are there any deal-killer items the seller is aware of (foundation, flood, title, zoning, code violations)?
- Is there a deadline driving the sale (1031 exchange, divorce, estate, relocation)? That informs how much negotiation room exists.
- Crime grade is F in this area — have there been break-ins, vandalism, or insurance claims at this property in the last 3 years? What carrier currently insures it and at what premium?
- The area grade is low — what's the realistic commute time and amenity access for the typical tenant pool here? Any planned neighborhood developments (good or bad) we should know about?
- What's the average days-on-market for RENTAL listings here right now (not sales)? A rising rental-DOM trend means longer vacancies and softer asking-rent achievability than the comps imply.
- What's the recent tenant-quality profile in this submarket — average credit score on applications, eviction rate, late-payment / NSF rate, and stable-employment percentage? A property-management company in the area should have these aggregated.
- How much new for-sale + rental construction is in the pipeline within 1–3 miles? Heavy new supply typically softens prices + rents 12–24 months out; constrained supply supports both.
Investment metrics
- 1% rule
- 1.01% ✓
- Cap rate
- 6.53%
- Cash-on-cash
- 0.86%
- DSCR
- 1.04
- GRM
- 8.2
CMA / ARV
- ARV (on-the-fly)
- $181,540
- Comps found
- 12
Show comp detail 12 sales within ~0.75 mi
| Address | Dist | Beds/Ba | Sqft | Sold | Price | $/sf | Match |
|---|---|---|---|---|---|---|---|
| 162 Pleasant Vly | 0.17mi | 4/2.0 (+1) | 1,328 (+6%) | 5mo | $139,900 | $105 | 69 |
| 122 Pleasant Vly | 0.23mi | 3/1.0 | 1,408 (+12%) | 1mo | $99,999 | $71 | 68 |
| 7427 Draco Leap | 0.38mi | 3/2.0 | 1,380 (+10%) | 1mo | $160,000 | $116 | 61 |
| 6703 Sabine Pass | 0.55mi | 3/2.0 | 1,304 (+4%) | 6mo | $217,999 | $167 | 58 |
| 111 Lake Vly | 0.34mi | 3/2.0 | 1,375 (+10%) | 7mo | $189,900 | $138 | 58 |
| 6914 Port Bay | 0.48mi | 3/2.0 | 1,334 (+6%) | 6mo | $215,000 | $161 | 58 |
| 6286 Apple Vly | 0.61mi | 3/2.0 | 1,188 (-5%) | 2mo | $99,900 | $84 | 57 |
| 7102 Heathers Pl | 0.64mi | 3/2.0 | 1,200 (-4%) | 4mo | $210,000 | $175 | 56 |
| 7010 Palacios Cv | 0.59mi | 3/2.0 | 1,304 (+4%) | 7mo | $190,000 | $146 | 56 |
| 7307 Apastron Haze | 0.74mi | 3/2.0 | 1,274 (+2%) | 4mo | $184,500 | $145 | 55 |
| 7019 Heathers | 0.64mi | 3/2.0 | 1,345 (+7%) | 6mo | $215,000 | $160 | 49 |
| 6306 Loyola Bch | 0.52mi | 3/2.5 | 1,420 (+13%) | 3mo | $205,000 | $144 | 45 |
Match score weights: distance 35% · size 25% · config 20% · recency 20%. Top-matched comps best support the ARV.
Projected returns pro-forma
-3.0% appreciation · 0.0% rent growth · sell at horizon
- IRR
- -18.7%
- Equity multiple
- 0.36×
- Total profit
- $-27,785
- Equity at exit
- $23,245
- IRR
- -20.0%
- Equity multiple
- 0.11×
- Total profit
- $-39,053
- Equity at exit
- $13,479
Cash invested: $43,652 (down + closing). Projections, not guarantees.
Landlord ↔ Tenant lean methodology
- Overall (STATE)
- 87 Strongly Landlord-Friendly
- State Texas
- 87 Strongly Landlord-Friendly · R+5
- County
- — inherits STATE
- City
- — inherits STATE
ZIP-level market 78227
- Home prices YoY
- -5.5%
- Rents YoY
- -1.7%
- Active inventory
- 30
- Price-to-rent
- 8.2×
Monthly cashflow live
- Estimated rent
- $1,577 high interval (Pro) →
- Mortgage (P&I)
- −$818
- Tax from tax record
- −$332 /mo · $3,984/yr
- Insurance
- −$65
- HOA
- −$0
- Vacancy / Maint / Mgmt
- −$331
- Net cashflow
- $31
Break-even live
Sensitivity live
| Price | -10% $119 | -5% $75 | +0% $31 | +5% $-13 | +10% $-57 |
|---|---|---|---|---|---|
| Rent | -10% $-93 | -5% $-31 | +0% $31 | +5% $94 | +10% $156 |
| Rate | -1.0pp $110 | -0.5pp $71 | base $31 | +0.5pp $-9 | +1.0pp $-50 |
UW: 25.0% down · 7.5% · 30yr · 1.5% tax · 5.0% vac · 8.0% maint · 8.0% mgmt
Financing live
Cash to close
- Down payment
- $38,975
- Closing costs
- $4,677
- Reserves months
- —
- Total cash needed
- —
Loan-product check · same deal, 3 products live
Conventional
25% down · 7.5% · 30yr
- Down + closing
- —
- Monthly P&I
- —
- Monthly cashflow
- —
- DSCR
- —
- Eligible?
- —
Personal DTI + credit; lowest rate.
DSCR
20% down · 8.5% · 30yr
- Down + closing
- —
- Monthly P&I
- —
- Monthly cashflow
- —
- DSCR
- —
- Eligible?
- —
No personal income docs; deal must DSCR.
Hard money
10% down · 12.0% · 12mo
- Down + closing
- —
- Monthly P&I
- —
- Monthly cashflow
- —
- DSCR
- —
- Eligible?
- —
Short-term bridge; refi at stabilization.
Rent comps 36 comps
| Address | Beds | Baths | Sqft | Rent | $/sqft | DOM | Units | Dist |
|---|---|---|---|---|---|---|---|---|
| 154 Morning Valley St San Antonio, TX | 3.0 | 2.0 | 1400 | $1,300 | $0.93 | 5d | 1 | 0.02mi |
| 134 Lake Valley St San Antonio, TX | 2.0 | 2.0 | 940 | $1,350 | $1.44 | 45d | 1 | 0.23mi |
| 6911 Hallie Rdg San Antonio, TX | 3.0 | 2.5 | 1463 | $1,475 | $1.01 | 45d | 1 | 0.27mi |
| 7050 Hallie Rdg San Antonio, TX | 4.0 | 2.0 | 1620 | $1,535 | $0.95 | 14d | 1 | 0.33mi |
| 7451 Hercules Pt San Antonio, TX | 3.0 | 2.0 | 1653 | $1,795 | $1.09 | 26d | 1 | 0.34mi |
| 7639 Hercules Pt San Antonio, TX | 3.0 | 2.0 | 1180 | $1,550 | $1.31 | 45d | 1 | 0.50mi |
| 7423 Vega Gap San Antonio, TX | 4.0 | 2.0 | 1572 | $2,400 | $1.53 | 46d | 1 | 0.51mi |
| 7327 Aphelion Cv San Antonio, TX | 3.0 | 2.0 | 1408 | $1,499 | $1.06 | 0d | 1 | 0.51mi |
| 7327 Aphelion Cv San Antonio, TX | 3.0 | 2.0 | 1408 | $1,499 | $1.06 | 45d | 1 | 0.51mi |
| 6286 Apple Valley Dr San Antonio, TX | 3.0 | 2.0 | 1188 | $1,395 | $1.17 | 4d | 1 | 0.57mi |
| 7006 Heathers Way San Antonio, TX | 4.0 | 2.5 | 1847 | $1,850 | $1.00 | 19d | 1 | 0.57mi |
| 6010 Ray Ellison Blvd San Antonio, TX | 1.0–3.0 | 1.0–2.0 | 974 | $1,418 | $1.46 | 45d | 1 | 0.73mi |
| 7326 Sirius Mesa San Antonio, TX | 4.0 | 2.0 | 1691 | $1,650 | $0.98 | 26d | 1 | 0.74mi |
| 7307 Apastron Haze San Antonio, TX | 3.0 | 2.0 | 1274 | $1,395 | $1.09 | 26d | 1 | 0.77mi |
| 6719 Dragon Crk San Antonio, TX | 3.0 | 2.0 | 1210 | $1,700 | $1.40 | 26d | 1 | 0.79mi |
| 7123 Pandora Way San Antonio, TX | 3.0 | 2.0 | 1651 | $1,561 | $0.95 | 14d | 1 | 0.81mi |
| 6230 Hazel Valley St San Antonio, TX | 3.0 | 2.0 | 1344 | $1,650 | $1.23 | 23d | 1 | 0.84mi |
| 7411 Hazel Cv San Antonio, TX | 3.0 | 2.0 | 1287 | $1,450 | $1.13 | 18d | 1 | 0.88mi |
| 6627 Freedom Rnch San Antonio, TX | 3.0 | 2.0 | 1400 | $1,750 | $1.25 | 26d | 1 | 0.90mi |
| 6619 Freedom Hls San Antonio, TX | 4.0 | 2.5 | 1410 | $1,900 | $1.35 | 4d | 1 | 0.92mi |
| 8126 Radiant Star San Antonio, TX | 3.0 | 2.0 | 1635 | $1,700 | $1.04 | 13d | 1 | 0.94mi |
| 6611 Cougar Vlg San Antonio, TX | 3.0 | 2.0 | 1251 | $1,495 | $1.20 | 16d | 1 | 1.00mi |
| 6106 Cedar Valley Dr San Antonio, TX | 3.0 | 1.0 | 984 | $1,375 | $1.40 | 6d | 1 | 1.05mi |
| 6802 Cougar Cv San Antonio, TX | 3.0 | 2.0 | 1251 | $1,550 | $1.24 | 45d | 1 | 1.08mi |
| 7319 Walnut Valley Dr San Antonio, TX | 3.0 | 2.0 | 1152 | $1,900 | $1.65 | 14d | 1 | 1.10mi |
| 7323 Perseus Brk San Antonio, TX | 4.0 | 2.5 | 1832 | $1,895 | $1.03 | 45d | 1 | 1.16mi |
| 7414 Perseus Brk San Antonio, TX | 3.0 | 2.0 | 1186 | $1,475 | $1.24 | 45d | 1 | 1.19mi |
| 6214 Slate Valley Dr San Antonio, TX | 3.0 | 1.0 | 920 | $1,050 | $1.14 | 0d | 1 | 1.21mi |
| 8671 SW Loop 410 San Antonio, TX | 2.0–3.0 | 2.0 | 1024 | $1,405 | $1.37 | 18d | 7 | 1.22mi |
| 6243 Indian Valley Dr San Antonio, TX | 3.0 | 1.0 | 975 | $1,400 | $1.44 | 6d | 1 | 1.31mi |
| 5938 Autumn Palms San Antonio, TX | 3.0 | 2.0 | 1350 | $2,400 | $1.78 | 0d | 1 | 1.32mi |
| 8414 Piedras Crk San Antonio, TX | 4.0 | 2.0 | 1560 | $1,671 | $1.07 | 45d | 1 | 1.32mi |
| 8423 Brazos Pt San Antonio, TX | 3.0 | 2.0 | 1647 | $1,750 | $1.06 | 4d | 1 | 1.32mi |
| 7058 Dominic Vly San Antonio, TX | 4.0 | 2.5 | 1687 | $1,650 | $0.98 | 45d | 1 | 1.42mi |
| 6830 Beltran Pass San Antonio, TX | 3.0 | 2.5 | 1772 | $1,900 | $1.07 | 19d | 1 | 1.45mi |
| 6730 Carmona Pass San Antonio, TX | 3.0 | 2.5 | 1771 | $1,700 | $0.96 | 18d | 1 | 1.47mi |
Listing history 33 events
-
2026-06-21days on market $155,900 Active 219 DOM
-
2026-06-18days on market $155,900 Active 216 DOM
-
2026-06-17days on market $155,900 Active 215 DOM
-
2026-06-16days on market $155,900 Active 214 DOM
-
2026-06-15days on market $155,900 Active 213 DOM
-
2026-06-13days on market $155,900 Active 211 DOM
-
2026-06-09days on market $155,900 Active 207 DOM
-
2026-06-08days on market $155,900 Active 206 DOM
-
2026-06-07days on market $155,900 Active 205 DOM
-
2026-06-04days on market $155,900 Active 202 DOM
-
2026-06-03days on market $155,900 Active 201 DOM
-
2026-06-02days on market $155,900 Active 200 DOM
-
2026-06-01days on market $155,900 Active 199 DOM
-
2026-05-31statusdays on market $155,900 Active 198 DOM
-
2026-05-21price $155,900
-
2026-05-21status Back on Market
-
2026-04-28historical
-
2026-04-11price $159,900
-
2026-04-02price $165,000
-
2026-01-23price $177,000
-
2025-12-06price $178,000
-
2025-12-05status Back on Market
-
2025-08-01historical
-
2025-06-30price $195,000
-
2025-06-19$200,000 New
-
2024-07-22soldstatus
-
2017-05-01soldstatus
-
2016-06-20soldstatus
-
2010-02-04historical
-
2009-07-10$59,900
-
2008-05-06historical
-
2007-06-03$66,000
-
2002-03-13soldstatus
ⓘ Source: listings_history table (triggers on properties + properties_extension) + one-shot
backfill from property_details.listing_events for pre-trigger history.
Tax reassessment forecast TX · Resets to sale price
- Current annual tax
- $3,984 · $332/mo
- Projected year-2 tax
- $3,984 · $332/mo
- Expected delta
- $0/yr ($0/mo · 0.0%)
ⓘ Screening estimate from a state-policy table — verify with the county assessor before closing.
Climate risk First Street
- Flood 1/10 Low FEMA zone X (unshaded) · 0% chance over 30 yrs
- Wildfire 4/10 Moderate
- Heat 8/10 Severe 7 d/yr ≥108°F today · 22 d/yr by 30 yrs out
- Wind 7/10 Severe 78% chance of damaging wind over 30 yrs
- Air quality 2/10 Low 1 unhealthy d/yr today · 1 by 30 yrs out
Nearby sold comps map
Loading sold comps map…
Walkable amenities ~0.75 mi
Loading nearby amenities…
Taxation est. · year 1
- Rental income
- $18,923
- − Mortgage interest
- −$8,733
- − Property taxes
- −$3,984
- − Insurance
- −$780
- − Repairs & maintenance
- −$1,514
- − Management
- −$1,514
- − Depreciation
- −$4,535
- Taxable loss
- −$2,136
- Est. tax savings @ 24.0%
- +$513
- After-tax cash flow
- $888/yr
For passive investors: Depreciation is non-cash, so a rental often shows a tax loss while cash-flowing — sheltering income. Rental losses are passive: they offset passive income freely, and up to $25,000/yr can offset ordinary (W-2) income if you actively participate and your MAGI is under $100k (phasing out to $0 by $150k); unused losses carry forward. On sale, claimed depreciation is recaptured at up to 25%, and gains may owe capital-gains tax (a 1031 exchange can defer both). Figures are a year-1 estimate at your 24.0% rate — not tax advice; consult a CPA.
Schools (NCES district)
- District
- Southwest ISD
- NCES district ID
- 4840950
- Math proficiency
- 21% ▼ -21.00%
- Reading proficiency
- 31% ▼ -5.00%
- Median HH income
- $43,362
- Composite
- 22.22/100
- National rank
- #8153
- State rank
- #701 of 826 in TX
Livability — San Antonio
- Score
- 80/100
- State rank
- #31
- US rank
- #1616
Category grades
Schools grade is shown separately in the Schools card above.
Census & demographics
- Census place
- San Antonio, TX
- County
- Bexar County · 1,990,555 people
- City population
- 1,806,925
- Metro
- San Antonio-New Braunfels, TX
- Population (ZIP)
- 44,035
- Household income
- $51,519
- Rent vs Own
- Severe rent burden
- 1773.0
Population outlook (Bexar County) Hauer SSP2
- Today (2025)
- 2,336,851 people
- By 2030
- 2,560,728 · +9.6%
- By 2040
- 3,020,569 · +29.3%
- By 2050
- 3,493,522 · +49.5%
- By 2075
- 4,668,459 · +99.8%
- By 2100
- 5,533,242 · +136.8%
Race, ethnicity, and origin ACS 2023
- Neighborhood character
- Predominantly Hispanic (83%)
- Race & ethnicity
- Hispanic / Latino 83% Two or more races 40% White 9% Black 5% Native American 2%
- Hispanic origin (detail)
- Mexican 72% Puerto Rican 1%
- Common ancestry
- Romanian 1%
- Foreign-born
- 15% · Canada
- Languages at home
- 52% English-only · Spanish 47% Other Asian/Pacific 1%
Political lean MEDSL · Bexar
- 2024 margin
- Lean D (+9.8) · D 54.3% · R 44.6% · Other 1.1%
- 2008→2024 swing
- +4.2pp toward D · 2008: 5.6pp · 2024: 9.8pp
- All cycles
- 2024: D+9.8 2020: D+18.2 2016: D+13.5 2012: D+4.6 2008: D+5.6
Not yet ingested
- Civics
- —
Market trends
- HPI YoY
- ▼ -15.94%
- Current HPI
- 275.9519
- Rent YoY
- ▼ -1.71%
- Metro
- San Antonio-New Braunfels, TX
- State GDP YoY
- ▲ 3.95%
- F500 in state
- 110
Industry mix (Fortune 500 HQ in TX)
| Industry | F500 HQs | Revenue |
|---|---|---|
| Energy | 16 | $1,198B |
|
||
| Technology | 5 | $198B |
|
||
| Engineering / Construction | 4 | $72B |
|
||
| Energy Services | 3 | $60B |
|
||
| Utilities | 3 | $41B |
|
||
| Healthcare | 2 | $330B |
|
||
Price history
+136.2% since first listed19 events — show timeline
- 2026-05-21 Price Changed $155,900 LERA
- 2026-05-21 Relisted — LERA
- 2026-04-28 Listing Removed — LERA
- 2026-04-11 Price Changed $159,900 LERA
- 2026-04-02 Price Changed $165,000 LERA
- 2026-01-23 Price Changed $177,000 LERA
- 2025-12-06 Price Changed $178,000 LERA
- 2025-12-05 Relisted — LERA
- 2025-08-01 Listing Removed — LERA
- 2025-06-30 Price Changed $195,000 LERA
- 2025-06-19 Listed $200,000 LERA
- 2024-07-22 Sold (Public Records) — Public Records
- 2017-05-01 Sold (Public Records) — Public Records
- 2016-06-20 Sold (Public Records) — Public Records
- 2010-02-04 Listing Removed — LERA
- 2009-07-10 Listed $59,900 LERA
- 2008-05-06 Listing Removed — LERA
- 2007-06-03 Listed $66,000 LERA
- 2002-03-13 Sold (Public Records) — Public Records
Property tax history
+5.5%/yrLatest (2025): $3,984 · -1.2% YoY. Source: county tax records.
Cash-flow waterfall
monthlySold comps — $/sqft
last 12 mo · ≤1 miLoading sold comps…