4303 Stonebrook Dr · Jonesboro, AR
Flood risk 1/10 · Minimal
- FEMA flood zone
- X
- Chance of flooding over 30 yrs
- 0.0%
- Est. flood insurance / yr
- $507 – $1,088
Fire risk 2/10 · Minimal
- Est. fire insurance / yr
- $1,499 – $2,785
Heat risk 5/10 · Moderate
- Hot days now (above 108°F)
- 7 days/yr
- Hot days in 30 yrs
- 20 days/yr
Wind risk 4/10 · Minor
- Chance of severe wind over 30 yrs
- 8.0%
Air-quality risk 1/10 · Minimal
- Unhealthy air days now
- 0 days/yr
- Unhealthy air days in 30 yrs
- 0 days/yr
Risk factors via First Street. Map © Google.
Why this score? — see what drove the F grade
The composite is a weighted blend of 9 inputs, each scored 0–100. Each bar is that input's sub-score; the figure is the points it added to the 100-point composite (weight × sub-score).
- Cash flow +14.8/30.0
- DSCR +4.5/10.0
- 1% rule +3.2/10.0
- Livability +3.2/5.0
- Rent growth +2.7/5.0
- Condition / age +2.5/5.0
- Schools +1.9/10.0
- ARV discount +1.3/15.0
- Appreciation +0.0/10.0
$164,900
🖨 Deal sheet (PDF) 📄 Offer letter ✓ Due diligence
Listing remarks
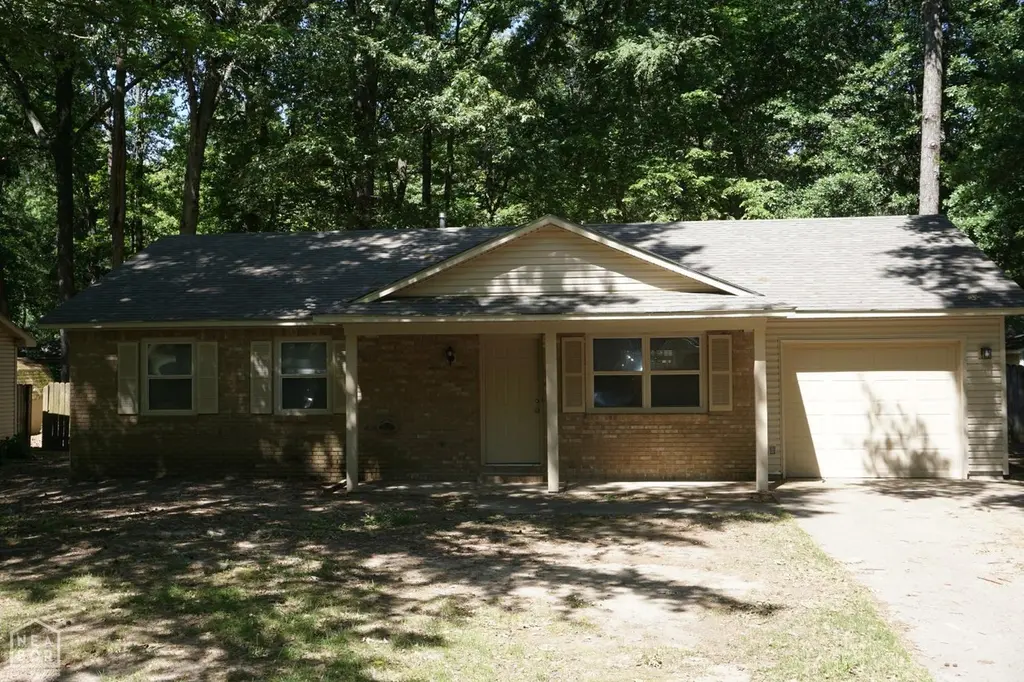
Charming 3-bedroom, 1.5-bath home nestled on a spacious wooded lot! This well-maintained property offers great curb appeal with a welcoming covered front porch, attached 1-car garage, and mature shade trees providing privacy and a peaceful setting. A wood privacy fence adds extra seclusion and space for pets, play, or outdoor entertaining. Inside, you'll find a functional layout perfect for comfortable everyday living, featuring generous living spaces, ample natural light, and plenty of potential to make it your own. Conveniently located with easy access to schools, shopping, and dining, this home is ideal for first-time buyers, downsizers, or investors. Don't miss this opportunity to own a
Key facts
- Covered front porch
- Ample natural light
- Spacious wooded lot
Tags
Property features AI
Exterior
- Parking: 1-car garage
- Utilities: Public water; Public sewer; Natural gas available
- Home design: Single-family residence; One story
- Construction: Brick and vinyl siding exterior; Slab foundation
- Exterior features: Front porch; Wood fencing; Outbuilding
Interior
- Kitchen: Dishwasher; Refrigerator
- Flooring: Carpet; Ceramic tile; Concrete
- Bathrooms: 1 full bathroom; 1 half bathroom
- Heating & cooling: Central heating (natural gas); Central air; Ceiling fans
- Interior features: Living room fireplace; Disposal; Gas water heater
- Laundry & utility: Dedicated laundry room
Neighborhood map
What this means for you Summary
Snapshot
- This is a 3-bed/1.5-bath single-family listed at $165k.
Deal economics
- At list price, monthly cash flow is $46 ($547/yr) — positive.
- The deal already cash-flows at list — no discount required.
- To meet the 1% rule (rent ≥ 1% of price), the offer needs to be $136k (17.8% below list).
- Recommended offer: $136k (17.8% below list) — sets the bar for 1% rule.
- Cap rate 6.6% vs local median 4.4% in Jonesboro — top-decile yield for the area; either an underpriced asset or a hidden risk that comps aren't pricing in. Stress-test before assuming the spread holds.
Location & tenants
- Location reads 65/100 on livability (#145 in AR) — a middle-class / working-renter tenant base. Strengths: cost of living A+, housing A+, health & safety A+; Watch: crime F, amenities F, commute F.
- Nettleton School District (urban): math 21% / reading 24% proficiency, ranked #199 of 238 in AR (top 84%) — low school quality limits family demand, transient renter base, plan for 1-2y turnover.
- Zoned schools: Fox Meadow Elementary (483 students, 100% FRL); Nettleton Junior High School (math 21% / reading 31%, grade F, #159 of 201 statewide, top 80%, 546 students, 100% FRL); Nettleton High School (math 11% / reading 27%, grade F, #248 of 292 statewide, top 86%, 981 students, 68% FRL) — zoned schools average 89% FRL vs 56% district-wide (34 pts higher); higher-poverty schools than district average — tighter screening recommended.
- Market conditions: Rents flat; 309 active listings in the ZIP; 27 comparable units currently listed for rent nearby; rentals lingering (median 45d on market — plan ~5-8 weeks vacancy on turnover, expect pricing pressure); 100% of comp listings sitting > 30 days — soft ceiling on asking rent; 926 units permitted in Craighead County in 2024 (69 in 5+ unit buildings).
Forward outlook
- Local home prices are declining (-3.0%/yr); year-one equity from $1k of loan paydown is wiped out by about $5k of value loss. Plan a longer hold.
- Craighead County population projected at +38% by 2050 — long-run rental-demand tailwind backs the buy-and-hold thesis.
Negotiation context
- It's been on market 34 days — a 3% lower offer ($160k) is reasonable based on typical stale-listing flexibility.
- 2 sale attempts with the ask held roughly flat each time — persistent listings suggest the price (not the market) is what's stuck; bring a comps-based counter.
- Current owner paid $84k; list at $165k implies a 96% gain — meaningful room to come down on a strong offer.
Risks & watch-outs
- Climate carrying-cost: extreme-heat days projected 7→20/yr by 2055 (HVAC capex compounding) — expect insurance premiums to compound above CPI over the hold.
Questions for the listing agent
- It's been on market 34 days. Have you received any prior offers? Is the seller open to a 18% concession, seller financing, or rate buy-down credit?
- Is there a deadline driving the sale (1031 exchange, divorce, estate, relocation)? That informs how much negotiation room exists.
- Schools are D-rated, which usually means shorter tenancies and higher turnover. Who's the typical renter profile here, and what's been the actual vacancy rate?
- Crime grade is F in this area — have there been break-ins, vandalism, or insurance claims at this property in the last 3 years? What carrier currently insures it and at what premium?
- The area grade is low — what's the realistic commute time and amenity access for the typical tenant pool here? Any planned neighborhood developments (good or bad) we should know about?
- What's the average days-on-market for RENTAL listings here right now (not sales)? A rising rental-DOM trend means longer vacancies and softer asking-rent achievability than the comps imply.
- What's the recent tenant-quality profile in this submarket — average credit score on applications, eviction rate, late-payment / NSF rate, and stable-employment percentage? A property-management company in the area should have these aggregated.
- How much new for-sale + rental construction is in the pipeline within 1–3 miles? Heavy new supply typically softens prices + rents 12–24 months out; constrained supply supports both.
Investment metrics
- 1% rule
- 0.82% ✗
- Cap rate
- 6.62%
- Cash-on-cash
- 1.19%
- DSCR
- 1.05
- GRM
- 10.1
CMA / ARV
- ARV (on-the-fly)
- $144,855
- Comps found
- 12
Show comp detail 12 sales within ~0.75 mi
| Address | Dist | Beds/Ba | Sqft | Sold | Price | $/sf | Match |
|---|---|---|---|---|---|---|---|
| 4411 Stonebrook Dr | 0.14mi | 3/1.5 | 1,069 (-0%) | 12mo | $154,800 | $145 | 83 |
| 2610 Oakbrook Dr | 0.15mi | 3/1.5 | 1,138 (+6%) | 11mo | $159,000 | $140 | 74 |
| 2412 Bonnie Jean Pl | 0.11mi | 3/2.0 | 1,110 (+3%) | 16mo | $137,000 | $123 | 74 |
| 4400 Stonebrook | 0.07mi | 3/1.5 | 960 (-10%) | 12mo | $120,000 | $125 | 69 |
| 2512 Bonnie Jean Pl | 0.13mi | 2/1.0 (-1) | 1,016 (-5%) | 16mo | $119,500 | $118 | 65 |
| 4410 Southbrook Dr | 0.14mi | 3/1.5 | 960 (-10%) | 14mo | $130,000 | $135 | 64 |
| 2513 Brooke Mcqueen | 0.23mi | 3/2.0 | 1,166 (+9%) | 13mo | $135,000 | $116 | 62 |
| 3905 Kents Pl | 0.28mi | 2/1.0 (-1) | 946 (-12%) | 1mo | $107,000 | $113 | 59 |
| 4400 Foxwood Cv | 0.17mi | 3/1.5 | 936 (-13%) | 15mo | $130,000 | $139 | 58 |
| 2512 Brooke Mcqueen Pl | 0.26mi | 2/2.0 (-1) | 1,215 (+13%) | 3mo | $160,000 | $132 | 57 |
| 2018 Fox Meadow Ln | 0.34mi | 3/2.0 | 1,176 (+10%) | 14mo | $159,900 | $136 | 54 |
| 4702 Big Johns Place Pl | 0.57mi | 2/1.0 (-1) | 987 (-8%) | 6mo | $139,900 | $142 | 48 |
Match score weights: distance 35% · size 25% · config 20% · recency 20%. Top-matched comps best support the ARV.
Projected returns pro-forma
-3.0% appreciation · 0.74% rent growth · sell at horizon
- IRR
- -16.8%
- Equity multiple
- 0.42×
- Total profit
- $-26,879
- Equity at exit
- $24,587
- IRR
- -12.9%
- Equity multiple
- 0.31×
- Total profit
- $-31,687
- Equity at exit
- $14,258
Cash invested: $46,172 (down + closing). Projections, not guarantees.
Landlord ↔ Tenant lean methodology
- Overall (STATE)
- 92 Strongly Landlord-Friendly
- State Arkansas
- 92 Strongly Landlord-Friendly · R+14
- County
- — inherits STATE
- City
- — inherits STATE
ZIP-level market 72404
- Home prices YoY
- -14.5%
- Rents YoY
- 0.7%
- Active inventory
- 309
- Price-to-rent
- 10.1×
Monthly cashflow live
- Estimated rent
- $1,355 high interval (Pro) →
- Mortgage (P&I)
- −$865
- Tax from tax record
- −$92 /mo · $1,098/yr
- Insurance
- −$69
- HOA
- −$0
- Vacancy / Maint / Mgmt
- −$285
- Net cashflow
- $46
Break-even live
Sensitivity live
| Price | -10% $139 | -5% $92 | +0% $46 | +5% $-1 | +10% $-48 |
|---|---|---|---|---|---|
| Rent | -10% $-61 | -5% $-8 | +0% $46 | +5% $99 | +10% $153 |
| Rate | -1.0pp $129 | -0.5pp $88 | base $46 | +0.5pp $3 | +1.0pp $-41 |
UW: 25.0% down · 7.5% · 30yr · 1.5% tax · 5.0% vac · 8.0% maint · 8.0% mgmt
Financing live
Cash to close
- Down payment
- $41,225
- Closing costs
- $4,947
- Reserves months
- —
- Total cash needed
- —
Loan-product check · same deal, 3 products live
Conventional
25% down · 7.5% · 30yr
- Down + closing
- —
- Monthly P&I
- —
- Monthly cashflow
- —
- DSCR
- —
- Eligible?
- —
Personal DTI + credit; lowest rate.
DSCR
20% down · 8.5% · 30yr
- Down + closing
- —
- Monthly P&I
- —
- Monthly cashflow
- —
- DSCR
- —
- Eligible?
- —
No personal income docs; deal must DSCR.
Hard money
10% down · 12.0% · 12mo
- Down + closing
- —
- Monthly P&I
- —
- Monthly cashflow
- —
- DSCR
- —
- Eligible?
- —
Short-term bridge; refi at stabilization.
Rent comps 27 comps
| Address | Beds | Baths | Sqft | Rent | $/sqft | DOM | Units | Dist |
|---|---|---|---|---|---|---|---|---|
| 3719 Stadium Blvd Unit E20 Jonesboro, AR | 3.0 | 2.0 | 1350 | $1,294 | $0.96 | 45d | 1 | 0.30mi |
| 3719 Stadium Blvd Unit J10 Jonesboro, AR | 2.0 | 1.0 | 1100 | $1,144 | $1.04 | 45d | 1 | 0.35mi |
| 6 Willow Creek Ln Jonesboro, AR | 1.0–3.0 | 1.0–2.0 | 925 | $1,458 | $1.58 | 45d | 24 | 0.47mi |
| 1424 Links Dr Jonesboro, AR | 1.0–2.0 | 1.0–2.0 | 771 | $860 | $1.11 | 45d | 1 | 0.49mi |
| 4619 S Caraway Rd Jonesboro, AR | 2.0 | 1.0 | 1012 | $1,150 | $1.14 | 45d | 1 | 0.54mi |
| 959 Links Dr Jonesboro, AR | 1.0–2.0 | 1.0–2.0 | 818 | $1,030 | $1.26 | 45d | 1 | 0.67mi |
| 4236 Fonda Jo Dr Unit 173 Jonesboro, AR | 2.0 | 2.5 | 1450 | $1,275 | $0.88 | 45d | 1 | 0.74mi |
| 4217 Fonda Jo Dr Unit 230 Jonesboro, AR | 2.0 | 2.5 | 1450 | $1,275 | $0.88 | 45d | 1 | 0.76mi |
| 4221 Fonda Jo Dr Unit 228 Jonesboro, AR | 2.0 | 2.5 | 1450 | $1,275 | $0.88 | 45d | 1 | 0.79mi |
| 4310 Makala Ln Jonesboro, AR | 2.0 | 1.5–2.5 | 1175 | $1,075 | $0.91 | 45d | 1 | 0.79mi |
| 954 E Craighead Forest Rd Unit 116 Jonesboro, AR | 2.0 | 1.5 | 1000 | $1,000 | $1.00 | 45d | 1 | 0.80mi |
| 4237 Blair Cv Unit 201 Jonesboro, AR | 2.0 | 2.5 | 1450 | $1,275 | $0.88 | 45d | 1 | 0.84mi |
| 4298 Dena Jo Dr Unit 158 Jonesboro, AR | 2.0 | 2.5 | 1450 | $1,275 | $0.88 | 45d | 1 | 0.87mi |
| 930 E Craighead Forest Rd Unit G Jonesboro, AR | 3.0 | 2.5 | 1350 | $1,450 | $1.07 | 45d | 1 | 0.87mi |
| 4296 Dena Jo Dr Unit 153 Jonesboro, AR | 2.0 | 2.5 | 1450 | $1,275 | $0.88 | 45d | 1 | 0.88mi |
| 926 E Craighead Forest Rd Unit K Jonesboro, AR | 2.0 | 2.5 | 1350 | $1,200 | $0.89 | 45d | 1 | 0.90mi |
| 908 E Craighead Forest Rd Apt 93 Jonesboro, AR | 3.0 | 2.5 | 1350 | $1,450 | $1.07 | 45d | 1 | 1.00mi |
| 3305 Richardson Dr Jonesboro, AR | 2.0 | 1.0–1.5 | 900 | $775 | $0.86 | 45d | 1 | 1.02mi |
| 4619 Jeri Cv Jonesboro, AR | 3.0 | 2.0 | 1412 | $1,495 | $1.06 | 45d | 1 | 1.03mi |
| 3817 Keeneland Dr Jonesboro, AR | 3.0 | 2.0 | 1355 | $1,525 | $1.13 | 45d | 1 | 1.18mi |
| 3809 Travers Ln Jonesboro, AR | 3.0 | 2.0 | 1243 | $1,550 | $1.25 | 45d | 1 | 1.24mi |
| 3840 Travers Ln Jonesboro, AR | 3.0 | 2.0 | 1243 | $1,525 | $1.23 | 45d | 1 | 1.25mi |
| 705 June Dr Apt A Jonesboro, AR | 2.0 | 1.0 | 1000 | $845 | $0.84 | 45d | 1 | 1.25mi |
| 3622 Hargis Dr Jonesboro, AR | 3.0 | 2.0 | 1143 | $1,495 | $1.31 | 45d | 1 | 1.29mi |
| 703 Gladiolus Dr Jonesboro, AR | 1.0–2.0 | 1.0 | 610 | $730 | $1.20 | 45d | 1 | 1.39mi |
| 5516 Harrisburg Rd Unit A Jonesboro, AR | 2.0 | 1.0 | 980 | $795 | $0.81 | 45d | 1 | 1.43mi |
| 2213 Spence Cir Unit 2 Jonesboro, AR | 2.0 | 1.5 | 1000 | $1,000 | $1.00 | 45d | 1 | 1.46mi |
Listing history 22 events
-
2026-06-21days on market $164,900 Active 34 DOM
-
2026-06-19days on market $164,900 Active 32 DOM
-
2026-06-18days on market $164,900 Active 31 DOM
-
2026-06-17days on market $164,900 Active 30 DOM
-
2026-06-16days on market $164,900 Active 29 DOM
-
2026-06-15days on market $164,900 Active 28 DOM
-
2026-06-14days on market $164,900 Active 26 DOM
-
2026-06-13days on market $164,900 Active 25 DOM
-
2026-06-10days on market $164,900 Active 23 DOM
-
2026-06-09days on market $164,900 Active 22 DOM
-
2026-06-08days on market $164,900 Active 21 DOM
-
2026-06-07days on market $164,900 Active 20 DOM
-
2026-06-05days on market $164,900 Active 17 DOM
-
2026-06-03days on market $164,900 Active 16 DOM
-
2026-06-02days on market $164,900 Active 15 DOM
-
2026-06-01days on market $164,900 Active 14 DOM
-
2026-05-31days on market $164,900 Active 13 DOM
-
2026-05-30days on market $164,900 Active 12 DOM
-
2026-05-18$164,900 Active
-
2026-05-18$164,900 New Listing
-
2009-07-28soldstatus $84,000
-
2004-03-23soldstatus $80,000
ⓘ Source: listings_history table (triggers on properties + properties_extension) + one-shot
backfill from property_details.listing_events for pre-trigger history.
Tax reassessment forecast AR · Resets to sale price
- Current annual tax
- $1,098 · $92/mo
- Projected year-2 tax
- $1,098 · $92/mo
- Expected delta
- $0/yr ($0/mo · 0.0%)
ⓘ Screening estimate from a state-policy table — verify with the county assessor before closing.
Climate risk First Street
- Flood 1/10 Low FEMA zone X · 0% chance over 30 yrs
- Wildfire 2/10 Low
- Heat 5/10 Major 7 d/yr ≥108°F today · 20 d/yr by 30 yrs out
- Wind 4/10 Moderate 8% chance of damaging wind over 30 yrs
- Air quality 1/10 Low 0 unhealthy d/yr today · 0 by 30 yrs out
Nearby sold comps map
Loading sold comps map…
Walkable amenities ~0.75 mi
Loading nearby amenities…
Taxation est. · year 1
- Rental income
- $16,262
- − Mortgage interest
- −$9,237
- − Property taxes
- −$1,098
- − Insurance
- −$824
- − Repairs & maintenance
- −$1,301
- − Management
- −$1,301
- − Depreciation
- −$4,797
- Taxable loss
- −$2,297
- Est. tax savings @ 24.0%
- +$551
- After-tax cash flow
- $1,099/yr
For passive investors: Depreciation is non-cash, so a rental often shows a tax loss while cash-flowing — sheltering income. Rental losses are passive: they offset passive income freely, and up to $25,000/yr can offset ordinary (W-2) income if you actively participate and your MAGI is under $100k (phasing out to $0 by $150k); unused losses carry forward. On sale, claimed depreciation is recaptured at up to 25%, and gains may owe capital-gains tax (a 1031 exchange can defer both). Figures are a year-1 estimate at your 24.0% rate — not tax advice; consult a CPA.
Schools (NCES district)
- District
- Nettleton School District
- NCES district ID
- 0510440
- Math proficiency
- 21% ▼ -16.00%
- Reading proficiency
- 24% ▼ -12.00%
- Median HH income
- $39,754
- Composite
- 19.0/100
- National rank
- #8846
- State rank
- #199 of 238 in AR
Livability — Jonesboro
- Score
- 65/100
- State rank
- #145
- US rank
- #12692
Category grades
Schools grade is shown separately in the Schools card above.
Census & demographics
- Census place
- Jonesboro, AR
- County
- Craighead County · 97,185 people
- City population
- 91,245
- Metro
- Jonesboro, AR
- Population (ZIP)
- 29,968
- Household income
- $70,269
- Rent vs Own
- Severe rent burden
- 869.0
Population outlook (Craighead County) Hauer SSP2
- Today (2025)
- 122,235 people
- By 2030
- 131,338 · +7.4%
- By 2040
- 149,862 · +22.6%
- By 2050
- 168,034 · +37.5%
- By 2075
- 208,094 · +70.2%
- By 2100
- 233,251 · +90.8%
Race, ethnicity, and origin ACS 2023
- Neighborhood character
- Predominantly White (72%)
- Race & ethnicity
- White 72% Black 18% Two or more races 5% Hispanic / Latino 4% Asian 2%
- Common ancestry
- Slovak 3% Lithuanian 1% Italian 1%
- Foreign-born
- 5% · Canada, China, South Korea
- Languages at home
- 95% English-only · Spanish 3% Chinese 1%
Political lean MEDSL · Craighead
- 2024 margin
- Solid R (+37.4) · D 30.1% · R 67.5% · Other 2.4%
- 2008→2024 swing
- -12.9pp toward R · 2008: -24.5pp · 2024: -37.4pp
- All cycles
- 2024: R+37.4 2020: R+35.4 2016: R+35.2 2012: R+31.1 2008: R+24.5
Not yet ingested
- Civics
- —
Market trends
- HPI YoY
- ▼ -35.22%
- Current HPI
- 208.3772
- Rent YoY
- ▲ 0.74%
- Metro
- Jonesboro, AR
- State GDP YoY
- ▲ 3.80%
- F500 in state
- 10
Industry mix (Fortune 500 HQ in AR)
| Industry | F500 HQs | Revenue |
|---|---|---|
| Retail | 1 | $681B |
|
||
| Food / Agriculture | 1 | $53B |
|
||
| Retail / Energy | 1 | $22B |
|
||
| Transportation / Logistics | 1 | $12B |
|
||
| Energy | 1 | $4B |
|
||
Price history
+106.1% since first listed4 events — show timeline
- 2026-05-18 Listed $164,900 NEABOR MLS
- 2026-05-18 Listed $164,900 CARMLS
- 2009-07-28 Sold (Public Records) $84,000 Public Records
- 2004-03-23 Sold (Public Records) $80,000 Public Records
Property tax history
+3.8%/yrLatest (2025): $1,098 · +10.3% YoY. Source: county tax records.
Cash-flow waterfall
monthlySold comps — $/sqft
last 12 mo · ≤1 miLoading sold comps…