1130 Sir Galahad · Canyon Lake, TX
Flood risk 1/10 · Minimal
- FEMA flood zone
- X (unshaded)
- Chance of flooding over 30 yrs
- 0.0%
- Est. flood insurance / yr
- $507 – $1,088
Fire risk 4/10 · Minor
- Est. fire insurance / yr
- $1,222 – $2,270
Heat risk 8/10 · Major
- Hot days now (above 106°F)
- 7 days/yr
- Hot days in 30 yrs
- 22 days/yr
Wind risk 6/10 · Moderate
- Chance of severe wind over 30 yrs
- 70.0%
Air-quality risk 2/10 · Minimal
- Unhealthy air days now
- 0 days/yr
- Unhealthy air days in 30 yrs
- 1 days/yr
Risk factors via First Street. Map © Google.
Why this score? — see what drove the C+ grade
The composite is a weighted blend of 9 inputs, each scored 0–100. Each bar is that input's sub-score; the figure is the points it added to the 100-point composite (weight × sub-score).
- Cash flow +26.3/30.0
- ARV discount +10.3/15.0
- DSCR +8.9/10.0
- 1% rule +6.0/10.0
- Schools +5.2/10.0
- Livability +3.4/5.0
- Condition / age +2.5/5.0
- Rent growth +2.2/5.0
- Appreciation +0.0/10.0
$149,000
🖨 Deal sheet (PDF) 📄 Offer letter ✓ Due diligence
Listing remarks MLS
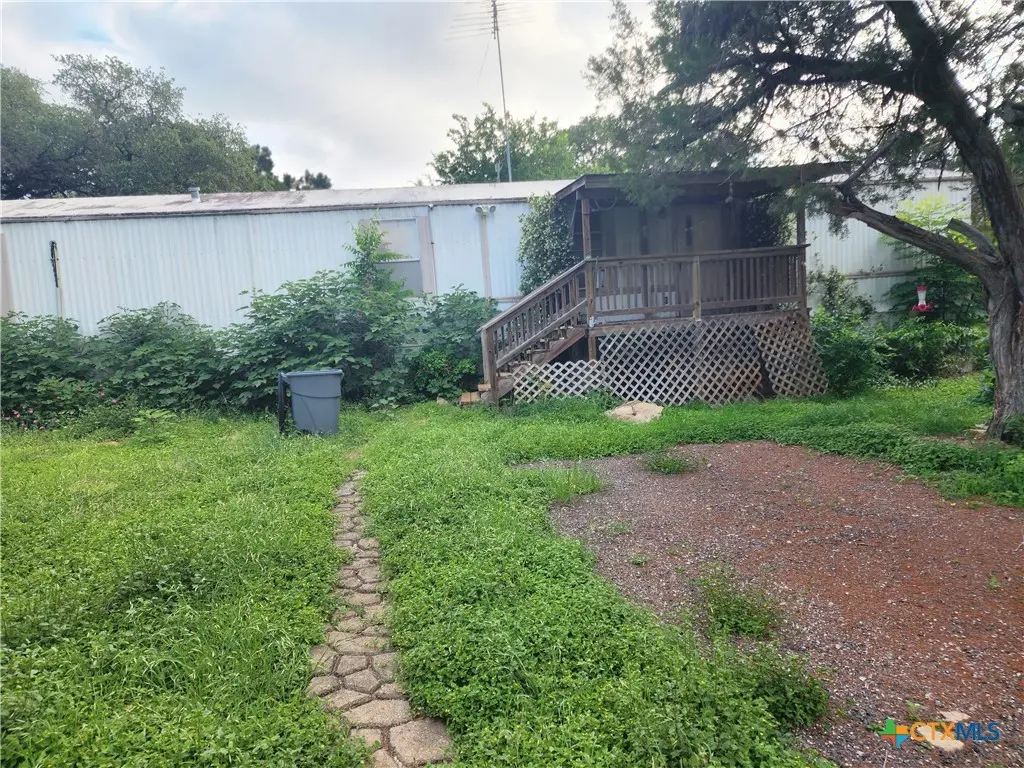
If you are looking for a place to call home or enjoy some time away this is the place for you. Sitting on a large corner lot fenced with solar double gate entrance with decorative stone steps to the front porch. Walk into the open living/kitchen floor plan with numerous upgrades and amenities from solid counter tops, wood laminate flooring, upgraded bathroom /kitchen faucets, split a/c units in kitchen and master, enclosed back deck with wood burning stove and removable window covers to open up and enjoy the outdoors. Home has newly replaced front porch, hot tub, rain recapture system for
Key facts
- Large corner lot
- Numerous upgrades
- Canyon lake area
Tags
Property features AI
Finance
- HOA & community: Homeowners association; Community pool; Community spa (fiberglass, heated)
Exterior
- Parking: Carport with 2 spaces
- Utilities: Cable available; Electricity available; Fiber optic available; High-speed internet available; Phone available; Septic tank; Community/co-op water
- Home design: Single-story; Single wide manufactured home; Raised foundation with pillar/post/pier support; Metal siding; Metal roof; Resale property; Road frontage on a county road (paved)
- Construction: Built (year per assessor); Metal siding; Metal roof; Raised pier/pillar foundation
- Exterior features: Chain link, front yard, perimeter and privacy fencing; No additional exterior features listed
Interior
- Kitchen: Dishwasher; Electric range; Range; Refrigerator; Kitchen island
- Flooring: Carpet; Laminate
- Bathrooms: 2 full bathrooms
- Heating & cooling: Central heating (multiple heating units); Central air; Electric cooling; Two cooling units; Wall/window unit(s)
- Interior features: Ceiling fan(s); Double vanity; Tub/shower; Walk-in closet(s); Kitchen island; Other (see remarks)
- Laundry & utility: Washer hookup; Electric dryer hookup; Electric water heater
Neighborhood map
What this means for you Summary
Snapshot
- This is a 2-bed/2.0-bath manufactured listed at $149k.
Deal economics
- At list price, monthly cash flow is $382 ($5k/yr) — positive.
- The deal already cash-flows at list — no discount required.
- Meets the 1% rule at list price ($2k rent vs $149k).
- Recommended offer: $147k (1.5% below list) — sets the bar for market timing.
- Cap rate 9.4% vs local median 2.2% in Canyon Lake — top-decile yield for the area; either an underpriced asset or a hidden risk that comps aren't pricing in. Stress-test before assuming the spread holds.
Location & tenants
- Location reads 67/100 on livability (#534 in TX) — a middle-class / working-renter tenant base. Strengths: employment A+, housing A+, cost of living A; Watch: schools C-, amenities F, commute F.
- Comal ISD (rural): math 57% / reading 59% proficiency, ranked #58 of 826 in TX (top 7%) — acceptable for families but not a draw, mixed tenant base, ~2y average lease.
- Market conditions: Rents soft (-1.2%/yr); 1029 active listings in the ZIP; 12 comparable units currently listed for rent nearby; rentals lingering (median 45d on market — plan ~5-8 weeks vacancy on turnover, expect pricing pressure); 58% of comp listings sitting > 30 days — soft ceiling on asking rent; solid renter incomes; 3,420 units permitted in Comal County in 2024 (1,164 in 5+ unit buildings).
Forward outlook
- Local home prices are declining (-3.0%/yr); year-one equity from $1k of loan paydown is wiped out by about $4k of value loss. Plan a longer hold.
- Comal County population projected at +70% by 2050 — long-run rental-demand tailwind backs the buy-and-hold thesis.
Negotiation context
- It's been on market 26 days — a 2% lower offer ($147k) is reasonable based on typical stale-listing flexibility.
- 3 sale attempts since 11y ago with the ask held roughly flat each time — persistent listings suggest the price (not the market) is what's stuck; bring a comps-based counter.
- Current owner paid $62k; list at $149k implies a 138% gain — meaningful room to come down on a strong offer.
Risks & watch-outs
- Climate carrying-cost: major wind risk, 70% chance of damaging wind over 30y; extreme-heat days projected 7→22/yr by 2055 (HVAC capex compounding) — expect insurance premiums to compound above CPI over the hold.
Questions for the listing agent
- Is there a deadline driving the sale (1031 exchange, divorce, estate, relocation)? That informs how much negotiation room exists.
- What's the average days-on-market for RENTAL listings here right now (not sales)? A rising rental-DOM trend means longer vacancies and softer asking-rent achievability than the comps imply.
- What's the recent tenant-quality profile in this submarket — average credit score on applications, eviction rate, late-payment / NSF rate, and stable-employment percentage? A property-management company in the area should have these aggregated.
- How much new for-sale + rental construction is in the pipeline within 1–3 miles? Heavy new supply typically softens prices + rents 12–24 months out; constrained supply supports both.
Investment metrics
- 1% rule
- 1.10% ✓
- Cap rate
- 9.37%
- Cash-on-cash
- 11.00%
- DSCR
- 1.49
- GRM
- 7.6
CMA / ARV
- ARV (on-the-fly)
- $158,720
- Comps found
- 5
Show comp detail 5 sales within ~0.75 mi
| Address | Dist | Beds/Ba | Sqft | Sold | Price | $/sf | Match |
|---|---|---|---|---|---|---|---|
| 1154 Hidden Fawn | 0.08mi | 3/2.0 (+1) | 1,140 (+11%) | 7mo | $190,000 | $167 | 67 |
| 220 Sir Arthur Way | 0.32mi | 2/2.0 | 1,056 (+3%) | 22mo | $149,500 | $142 | 62 |
| 706 Flintstone Dr | 0.37mi | 3/2.0 (+1) | 1,064 (+4%) | 16mo | $60,000 | $56 | 58 |
| 474 & 466 Forest Hill St | 0.35mi | 2/2.0 | 896 (-12%) | 11mo | $190,000 | $212 | 54 |
| 250 Deer Vly | 0.64mi | 3/2.0 (+1) | 902 (-12%) | 18mo | $140,000 | $155 | 30 |
Match score weights: distance 35% · size 25% · config 20% · recency 20%. Top-matched comps best support the ARV.
Projected returns pro-forma
-3.0% appreciation · 0.0% rent growth · sell at horizon
- IRR
- -3.0%
- Equity multiple
- 0.89×
- Total profit
- $-4,638
- Equity at exit
- $22,216
- IRR
- 3.2%
- Equity multiple
- 1.21×
- Total profit
- $8,566
- Equity at exit
- $12,883
Cash invested: $41,720 (down + closing). Projections, not guarantees.
Landlord ↔ Tenant lean methodology
- Overall (STATE)
- 87 Strongly Landlord-Friendly
- State Texas
- 87 Strongly Landlord-Friendly · R+5
- County
- — inherits STATE
- City
- — inherits STATE
ZIP-level market 78133
- Home prices YoY
- -33.8%
- Rents YoY
- -1.2%
- Active inventory
- 1029
- Price-to-rent
- 7.6×
Monthly cashflow live
- Estimated rent
- $1,640 high interval (Pro) →
- Mortgage (P&I)
- −$781
- Tax from tax record
- −$69 /mo · $832/yr
- Insurance
- −$62
- HOA
- −$0
- Vacancy / Maint / Mgmt
- −$344
- Net cashflow
- $382
Break-even live
Sensitivity live
| Price | -10% $467 | -5% $425 | +0% $382 | +5% $340 | +10% $298 |
|---|---|---|---|---|---|
| Rent | -10% $253 | -5% $318 | +0% $382 | +5% $447 | +10% $512 |
| Rate | -1.0pp $457 | -0.5pp $420 | base $382 | +0.5pp $344 | +1.0pp $305 |
UW: 25.0% down · 7.5% · 30yr · 1.5% tax · 5.0% vac · 8.0% maint · 8.0% mgmt
Financing live
Cash to close
- Down payment
- $37,250
- Closing costs
- $4,470
- Reserves months
- —
- Total cash needed
- —
Loan-product check · same deal, 3 products live
Conventional
25% down · 7.5% · 30yr
- Down + closing
- —
- Monthly P&I
- —
- Monthly cashflow
- —
- DSCR
- —
- Eligible?
- —
Personal DTI + credit; lowest rate.
DSCR
20% down · 8.5% · 30yr
- Down + closing
- —
- Monthly P&I
- —
- Monthly cashflow
- —
- DSCR
- —
- Eligible?
- —
No personal income docs; deal must DSCR.
Hard money
10% down · 12.0% · 12mo
- Down + closing
- —
- Monthly P&I
- —
- Monthly cashflow
- —
- DSCR
- —
- Eligible?
- —
Short-term bridge; refi at stabilization.
Rent comps 12 comps
| Address | Beds | Baths | Sqft | Rent | $/sqft | DOM | Units | Dist |
|---|---|---|---|---|---|---|---|---|
| 507 Scenic Run Canyon Lake, TX | 3.0 | 2.0 | 1276 | $1,650 | $1.29 | 45d | 1 | 0.06mi |
| 252 Sir Winston Dr Canyon Lake, TX | 3.0 | 2.0 | 1288 | $1,495 | $1.16 | 45d | 1 | 0.31mi |
| 270 Ridgerock Dr Canyon Lake, TX | 3.0 | 2.0 | 900 | $1,600 | $1.78 | 45d | 1 | 0.60mi |
| 324 Ridgerock Dr Unit 1 Canyon Lake, TX | 2.0 | 2.0 | 1050 | $1,450 | $1.38 | 25d | 1 | 0.62mi |
| 532 Grandview Bnd Canyon Lake, TX | 3.0 | 2.0 | 1344 | $1,450 | $1.08 | 21d | 1 | 0.64mi |
| 127 Quail Run St Canyon Lake, TX | 3.0 | 2.0 | 940 | $1,400 | $1.49 | 45d | 1 | 0.74mi |
| 1015 Twin Deer Ln Canyon Lake, TX | 3.0 | 1.0 | 1470 | $1,895 | $1.29 | 25d | 1 | 0.85mi |
| 1015 Twin Deer Ln Canyon Lake, TX | 3.0 | 2.0 | 1470 | $1,995 | $1.36 | 45d | 1 | 0.85mi |
| 634 Flatrock Dr Canyon Lake, TX | 3.0 | 2.0 | 1250 | $2,400 | $1.92 | 45d | 1 | 0.93mi |
| 668 Creekside Dr Canyon Lake, TX | 2.0 | 2.0 | 980 | $1,195 | $1.22 | 0d | 1 | 0.99mi |
| 446 W Overlook Dr Canyon Lake, TX | 3.0 | 2.0 | 1392 | $1,825 | $1.31 | 45d | 1 | 1.08mi |
| 1475 Bonnyview Dr Canyon Lake, TX | 3.0 | 2.0 | 1320 | $1,800 | $1.36 | 25d | 1 | 1.46mi |
Listing history 23 events
-
2026-06-21days on market $149,000 Active 26 DOM
-
2026-06-18days on market $149,000 Active 23 DOM
-
2026-06-17days on market $149,000 Active 22 DOM
-
2026-06-16days on market $149,000 Active 21 DOM
-
2026-06-15days on market $149,000 Active 20 DOM
-
2026-06-13days on market $149,000 Active 18 DOM
-
2026-06-09days on market $149,000 Active 14 DOM
-
2026-06-08days on market $149,000 Active 13 DOM
-
2026-06-07days on market $149,000 Active 12 DOM
-
2026-06-04days on market $149,000 Active 9 DOM
-
2026-06-03days on market $149,000 Active 8 DOM
-
2026-06-02days on market $149,000 Active 7 DOM
-
2026-06-01days on market $149,000 Active 6 DOM
-
2026-05-31days on market $149,000 Active 5 DOM
-
2026-05-26$149,000 Active
-
2024-09-12historical
-
2024-09-10price $69,000
-
2024-08-21$74,995 New
-
2015-11-06soldstatus
-
2015-11-04soldstatus $62,500 595-char remark
Show marketing remark (595 chars)
If you are looking for a place to call home or enjoy some time away this is the place for you. Sitting on a large corner lot fenced with solar double gate entrance with decorative stone steps to the front porch. Walk into the open living/kitchen floor plan with numerous upgrades and amenities from solid counter tops, wood laminate flooring, upgraded bathroom /kitchen faucets, split a/c units in kitchen and master, enclosed back deck with wood burning stove and removable window covers to open up and enjoy the outdoors. Home has newly replaced front porch, hot tub, rain recapture system for
-
2015-04-16$69,000 595-char remark
Show marketing remark (595 chars)
If you are looking for a place to call home or enjoy some time away this is the place for you. Sitting on a large corner lot fenced with solar double gate entrance with decorative stone steps to the front porch. Walk into the open living/kitchen floor plan with numerous upgrades and amenities from solid counter tops, wood laminate flooring, upgraded bathroom /kitchen faucets, split a/c units in kitchen and master, enclosed back deck with wood burning stove and removable window covers to open up and enjoy the outdoors. Home has newly replaced front porch, hot tub, rain recapture system for
-
2002-03-19soldstatus
-
2001-12-12soldstatus
ⓘ Source: listings_history table (triggers on properties + properties_extension) + one-shot
backfill from property_details.listing_events for pre-trigger history.
Tax reassessment forecast TX · Resets to sale price
- Current annual tax
- $832 · $69/mo
- Projected year-2 tax
- $2,727 · $227/mo
- Expected delta
- +$1,894/yr (+$158/mo · 227.6%)
ⓘ Screening estimate from a state-policy table — verify with the county assessor before closing.
Climate risk First Street
- Flood 1/10 Low FEMA zone X (unshaded) · 0% chance over 30 yrs
- Wildfire 4/10 Moderate
- Heat 8/10 Severe 7 d/yr ≥106°F today · 22 d/yr by 30 yrs out
- Wind 6/10 Major 70% chance of damaging wind over 30 yrs
- Air quality 2/10 Low 0 unhealthy d/yr today · 1 by 30 yrs out
Nearby sold comps map
Loading sold comps map…
Walkable amenities ~0.75 mi
Loading nearby amenities…
Taxation est. · year 1
- Rental income
- $19,675
- − Mortgage interest
- −$8,346
- − Property taxes
- −$832
- − Insurance
- −$745
- − Repairs & maintenance
- −$1,574
- − Management
- −$1,574
- − Depreciation
- −$4,335
- Taxable income
- $2,269
- Est. tax owed @ 24.0%
- −$544
- After-tax cash flow
- $4,045/yr
For passive investors: Depreciation is non-cash, so a rental often shows a tax loss while cash-flowing — sheltering income. Rental losses are passive: they offset passive income freely, and up to $25,000/yr can offset ordinary (W-2) income if you actively participate and your MAGI is under $100k (phasing out to $0 by $150k); unused losses carry forward. On sale, claimed depreciation is recaptured at up to 25%, and gains may owe capital-gains tax (a 1031 exchange can defer both). Figures are a year-1 estimate at your 24.0% rate — not tax advice; consult a CPA.
Schools (NCES district)
- District
- Comal ISD
- NCES district ID
- 4814730
- Math proficiency
- 57% ▼ -9.00%
- Reading proficiency
- 59% ▼ -2.00%
- Median HH income
- $74,792
- Composite
- 51.79/100
- National rank
- #1671
- State rank
- #58 of 826 in TX
Livability — Canyon Lake
- Score
- 67/100
- State rank
- #534
- US rank
- #10441
Category grades
Schools grade is shown separately in the Schools card above.
Census & demographics
- Census place
- Canyon Lake, TX
- County
- Comal County · 206,262 people
- City population
- 42,159
- Metro
- San Antonio-New Braunfels, TX
- Population (ZIP)
- 21,959
- Household income
- $83,853
- Rent vs Own
- Severe rent burden
- 402.0
Population outlook (Comal County) Hauer SSP2
- Today (2025)
- 175,637 people
- By 2030
- 199,911 · +13.8%
- By 2040
- 249,436 · +42.0%
- By 2050
- 299,430 · +70.5%
- By 2075
- 423,857 · +141.3%
- By 2100
- 512,048 · +191.5%
Race, ethnicity, and origin ACS 2023
- Neighborhood character
- Predominantly White (74%)
- Race & ethnicity
- White 74% Hispanic / Latino 20% Two or more races 10% Black 2%
- Hispanic origin (detail)
- Mexican 15%
- Common ancestry
- Lithuanian 3% Romanian 3% Italian 3%
- Foreign-born
- 4% · Canada
- Languages at home
- 91% English-only · Spanish 7%
Political lean MEDSL · Comal
- 2024 margin
- Solid R (+45.5) · D 26.8% · R 72.2%
- 2008→2024 swing
- +1.9pp toward D · 2008: -47.4pp · 2024: -45.5pp
- All cycles
- 2024: R+45.5 2020: R+42.7 2016: R+50.1 2012: R+54.1 2008: R+47.4
Not yet ingested
- Civics
- —
Market trends
- HPI YoY
- ▼ -111.36%
- Current HPI
- 218.4633
- Rent YoY
- ▼ -1.20%
- Metro
- San Antonio-New Braunfels, TX
- State GDP YoY
- ▲ 3.95%
- F500 in state
- 110
Industry mix (Fortune 500 HQ in TX)
| Industry | F500 HQs | Revenue |
|---|---|---|
| Energy | 16 | $1,198B |
|
||
| Technology | 5 | $198B |
|
||
| Engineering / Construction | 4 | $72B |
|
||
| Energy Services | 3 | $60B |
|
||
| Utilities | 3 | $41B |
|
||
| Healthcare | 2 | $330B |
|
||
Price history
+115.9% since first listed9 events — show timeline
- 2026-05-26 Listed $149,000 CTXMLS
- 2024-09-12 Listing Removed — LERA
- 2024-09-10 Price Changed $69,000 LERA
- 2024-08-21 Listed $74,995 LERA
- 2015-11-06 Sold (Public Records) — Public Records
- 2015-11-04 Sold (MLS) $62,500 CTXMLS
- 2015-04-16 Listed $69,000 CTXMLS
- 2002-03-19 Sold (Public Records) — Public Records
- 2001-12-12 Sold (Public Records) — Public Records
Property tax history
+4.1%/yrLatest (2026): $832 · +42.9% YoY. Source: county tax records.
Cash-flow waterfall
monthlySold comps — $/sqft
last 12 mo · ≤1 miLoading sold comps…