14683 Viney Grove Rd · Fayetteville, AR
Flood risk 1/10 · Minimal
- FEMA flood zone
- X (unshaded)
- Chance of flooding over 30 yrs
- 0.0%
- Est. flood insurance / yr
- $507 – $1,088
Fire risk 6/10 · Moderate
- Est. fire insurance / yr
- $1,499 – $2,785
Heat risk 5/10 · Moderate
- Hot days now (above 106°F)
- 7 days/yr
- Hot days in 30 yrs
- 21 days/yr
Wind risk 2/10 · Minimal
- Chance of severe wind over 30 yrs
- 2.0%
Air-quality risk 1/10 · Minimal
- Unhealthy air days now
- 0 days/yr
- Unhealthy air days in 30 yrs
- 0 days/yr
Risk factors via First Street. Map © Google.
Why this score? — see what drove the F grade
The composite is a weighted blend of 9 inputs, each scored 0–100. Each bar is that input's sub-score; the figure is the points it added to the 100-point composite (weight × sub-score).
- ARV discount +7.5/15.0
- Cash flow +7.4/30.0
- Livability +4.2/5.0
- Schools +3.6/10.0
- Rent growth +3.0/5.0
- Condition / age +2.5/5.0
- 1% rule +2.1/10.0
- DSCR +1.6/10.0
- Appreciation +0.0/10.0
$224,999
🖨 Deal sheet (PDF) 📄 Offer letter ✓ Due diligence
Listing remarks MLS
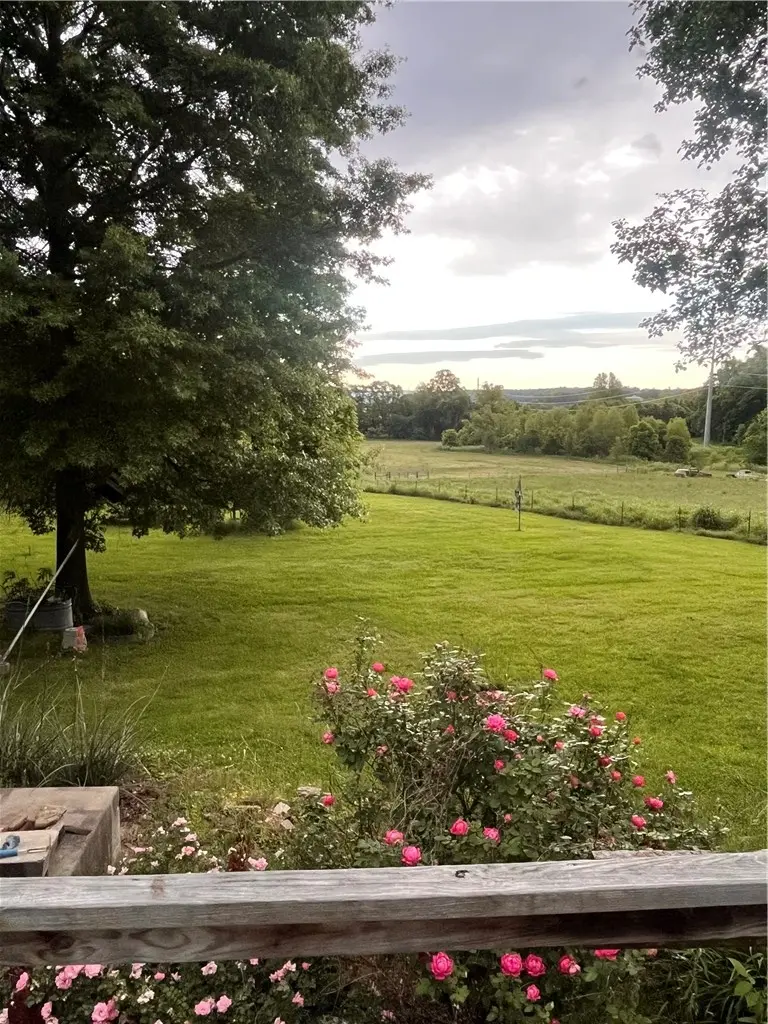
1996 Double wide needs work. Beautiful site to live in mobile or build a new home. Split bedroom floor plan with a wheelchair ramp on the front. Rural water. Great view!
Key facts
- Private acres
- Front deck
- Concrete patio
Tags
Property features AI
Finance
- Other: Lot size approximately 2.3 acres
- HOA & community: Association fees billed monthly
Exterior
- Parking: Detached carport; Two covered parking spaces
- Security: Storm shelter
- Utilities: Cable available; Electricity available; Propane available; Septic available (septic tank); Water available (public and well)
- Home design: Single-story home; Mobile home model year 1996; Has a view; Entry/facing details not specified
- Construction: Vinyl siding; Asphalt shingle roof; Block, skirt and slab foundation
- Exterior features: Deck; Porch; Gravel driveway; Barn(s); Storage structure(s); Partial fencing; Storm shelter; Rural setting with views; Cleared areas and hardwood trees; Not in a subdivision; outside city limits; County/public/shared road frontage; Paved road surface
Interior
- Kitchen: Gas range; Dishwasher; Plumbed for ice maker; Electric water heater
- Flooring: Laminate flooring; Simulated wood flooring
- Bathrooms: Two full bathrooms
- Heating & cooling: Heat pump heating; Central air conditioning
- Interior features: Split bedrooms layout; Walk-in closet(s); No additional interior features listed
- Laundry & utility: Washer and dryer included
Neighborhood map
What this means for you Summary
Snapshot
- This is a 3-bed/1.5-bath manufactured listed at $225k.
Deal economics
- At list price, monthly cash flow is $-287 ($-3k/yr) — negative.
- To cash-flow at today's rent, offer at most $183k (18.5% below list).
- To meet the 1% rule (rent ≥ 1% of price), the offer needs to be $160k (28.7% below list).
- Recommended offer: $160k (28.7% below list) — sets the bar for 1% rule.
- Cap rate 4.8% vs local median 3.5% in Fayetteville — top-decile yield for the area; either an underpriced asset or a hidden risk that comps aren't pricing in. Stress-test before assuming the spread holds.
Location & tenants
- Location reads 83/100 on livability (#3 in AR, #871 nationally) — a professional / high-income tenant draw. Strengths: amenities A+, commute A+, health & safety A+; Watch: employment D+, crime D-.
- Prairie Grove School District (town): math 43% / reading 39% proficiency, ranked #50 of 238 in AR (top 21%) — families likely to look elsewhere, expect single-tenant / working-renter base with shorter leases.
- Zoned schools: Prairie Grove Elem. School (math 52% / reading 38%, grade D-, #138 of 454 statewide, top 31%, 767 students, 37% FRL); Prairie Grove Middle School (math 53% / reading 36%, grade D, #61 of 201 statewide, top 32%, 512 students, 36% FRL); Prairie Grove High School (math 29% / reading 38%, grade F, #112 of 292 statewide, top 39%, 605 students, 33% FRL, charter) — zoned schools at 36% FRL track the district average.
- Market conditions: Rents rising (+2.2%/yr); 550 active listings in the ZIP; solid renter incomes; 3,494 units permitted in Washington County in 2024 (1,497 in 5+ unit buildings).
Forward outlook
- Local home prices are declining (-3.0%/yr); year-one equity from $2k of loan paydown is wiped out by about $7k of value loss. Plan a longer hold.
- Washington County population projected at +47% by 2050 — long-run rental-demand tailwind backs the buy-and-hold thesis.
Negotiation context
- Only 12 days on market — expect competitive offers; lowballing is unlikely to land.
- 2 sale attempts since 12y ago with the ask held roughly flat each time — persistent listings suggest the price (not the market) is what's stuck; bring a comps-based counter.
- Current owner paid $35k; list at $225k implies a 543% gain — meaningful room to come down on a strong offer.
Risks & watch-outs
- Climate carrying-cost: major wildfire risk; extreme-heat days projected 7→21/yr by 2055 (HVAC capex compounding) — expect insurance premiums to compound above CPI over the hold.
Questions for the listing agent
- What do current leases actually rent for vs. the listed asking? Can we see a recent rent roll and the last 12 months of T-12 income?
- Is there a deadline driving the sale (1031 exchange, divorce, estate, relocation)? That informs how much negotiation room exists.
- Schools are B-rated — typically a magnet for longer-tenancy family renters. What's the average tenant stay here, and is there a school-zone premium baked into asking?
- Crime grade is D in this area — have there been break-ins, vandalism, or insurance claims at this property in the last 3 years? What carrier currently insures it and at what premium?
- The area grade is low — what's the realistic commute time and amenity access for the typical tenant pool here? Any planned neighborhood developments (good or bad) we should know about?
- What's the average days-on-market for RENTAL listings here right now (not sales)? A rising rental-DOM trend means longer vacancies and softer asking-rent achievability than the comps imply.
- What's the recent tenant-quality profile in this submarket — average credit score on applications, eviction rate, late-payment / NSF rate, and stable-employment percentage? A property-management company in the area should have these aggregated.
- How much new for-sale + rental construction is in the pipeline within 1–3 miles? Heavy new supply typically softens prices + rents 12–24 months out; constrained supply supports both.
Investment metrics
- 1% rule
- 0.71% ✗
- Cap rate
- 4.76%
- Cash-on-cash
- -5.47%
- DSCR
- 0.76
- GRM
- 11.7
CMA / ARV
No comps found within radius.
Projected returns pro-forma
-3.0% appreciation · 2.17% rent growth · sell at horizon
- IRR
- -26.6%
- Equity multiple
- 0.11×
- Total profit
- $-56,062
- Equity at exit
- $33,548
- IRR
- -26.8%
- Equity multiple
- -0.23×
- Total profit
- $-77,644
- Equity at exit
- $19,454
Cash invested: $63,000 (down + closing). Projections, not guarantees.
Landlord ↔ Tenant lean methodology
- Overall (STATE)
- 92 Strongly Landlord-Friendly
- State Arkansas
- 92 Strongly Landlord-Friendly · R+14
- County
- — inherits STATE
- City
- — inherits STATE
ZIP-level market 72704
- Home prices YoY
- -20.2%
- Rents YoY
- 2.2%
- Active inventory
- 550
- Price-to-rent
- 11.7×
Monthly cashflow live
- Estimated rent
- $1,605 medium interval (Pro) →
- Mortgage (P&I)
- −$1,180
- Tax est. 1.5%
- −$281 /mo · $3,375/yr
- Insurance
- −$94
- HOA
- −$0
- Lot rent leased land?
- −$0
- Vacancy / Maint / Mgmt
- −$337
- Net cashflow
- $-287
Break-even live
Sensitivity live
| Price | -10% $-132 | -5% $-210 | +0% $-287 | +5% $-365 | +10% $-443 |
|---|---|---|---|---|---|
| Rent | -10% $-414 | -5% $-351 | +0% $-287 | +5% $-224 | +10% $-161 |
| Rate | -1.0pp $-174 | -0.5pp $-230 | base $-287 | +0.5pp $-346 | +1.0pp $-405 |
UW: 25.0% down · 7.5% · 30yr · 1.5% tax · 5.0% vac · 8.0% maint · 8.0% mgmt
Financing live
Cash to close
- Down payment
- $56,250
- Closing costs
- $6,750
- Reserves months
- —
- Total cash needed
- —
Loan-product check · same deal, 3 products live
Conventional
25% down · 7.5% · 30yr
- Down + closing
- —
- Monthly P&I
- —
- Monthly cashflow
- —
- DSCR
- —
- Eligible?
- —
Personal DTI + credit; lowest rate.
DSCR
20% down · 8.5% · 30yr
- Down + closing
- —
- Monthly P&I
- —
- Monthly cashflow
- —
- DSCR
- —
- Eligible?
- —
No personal income docs; deal must DSCR.
Hard money
10% down · 12.0% · 12mo
- Down + closing
- —
- Monthly P&I
- —
- Monthly cashflow
- —
- DSCR
- —
- Eligible?
- —
Short-term bridge; refi at stabilization.
Listing history 3 events
-
2026-05-08$224,999 Active 880-char remark
-
2014-10-31soldstatus $35,000 169-char remark
Show marketing remark (169 chars)
1996 Double wide needs work. Beautiful site to live in mobile or build a new home. Split bedroom floor plan with a wheelchair ramp on the front. Rural water. Great view!
-
2014-07-31$40,000 169-char remark
Show marketing remark (169 chars)
1996 Double wide needs work. Beautiful site to live in mobile or build a new home. Split bedroom floor plan with a wheelchair ramp on the front. Rural water. Great view!
ⓘ Source: listings_history table (triggers on properties + properties_extension) + one-shot
backfill from property_details.listing_events for pre-trigger history.
Climate risk First Street
- Flood 1/10 Low FEMA zone X (unshaded) · 0% chance over 30 yrs
- Wildfire 6/10 Major
- Heat 5/10 Major 7 d/yr ≥106°F today · 21 d/yr by 30 yrs out
- Wind 2/10 Low 2% chance of damaging wind over 30 yrs
- Air quality 1/10 Low 0 unhealthy d/yr today · 0 by 30 yrs out
Nearby sold comps map
Loading sold comps map…
Walkable amenities ~0.75 mi
Loading nearby amenities…
Taxation est. · year 1
- Rental income
- $19,255
- − Mortgage interest
- −$12,603
- − Property taxes
- −$3,375
- − Insurance
- −$1,125
- − Repairs & maintenance
- −$1,540
- − Management
- −$1,540
- − Depreciation
- −$6,545
- Taxable loss
- −$7,475
- Est. tax savings @ 24.0%
- +$1,794
- After-tax cash flow
- $-1,654/yr
For passive investors: Depreciation is non-cash, so a rental often shows a tax loss while cash-flowing — sheltering income. Rental losses are passive: they offset passive income freely, and up to $25,000/yr can offset ordinary (W-2) income if you actively participate and your MAGI is under $100k (phasing out to $0 by $150k); unused losses carry forward. On sale, claimed depreciation is recaptured at up to 25%, and gains may owe capital-gains tax (a 1031 exchange can defer both). Figures are a year-1 estimate at your 24.0% rate — not tax advice; consult a CPA.
Schools (NCES district)
- District
- Prairie Grove School District
- NCES district ID
- 0511760
- Math proficiency
- 43% ▼ -13.00%
- Reading proficiency
- 39% ▼ -10.00%
- Median HH income
- $55,896
- Composite
- 35.91/100
- National rank
- #4808
- State rank
- #50 of 238 in AR
Livability — Fayetteville
- Score
- 83/100
- State rank
- #3
- US rank
- #871
Category grades
Schools grade is shown separately in the Schools card above.
Census & demographics
- County
- Washington County · 252,056 people
- City population
- 118,228
- Metro
- Fayetteville-Springdale-Rogers, AR
- Population (ZIP)
- 32,497
- Household income
- $96,014
- Rent vs Own
- Severe rent burden
- 883.0
Population outlook (Washington County) Hauer SSP2
- Today (2025)
- 271,748 people
- By 2030
- 296,414 · +9.1%
- By 2040
- 346,874 · +27.6%
- By 2050
- 398,552 · +46.7%
- By 2075
- 523,309 · +92.6%
- By 2100
- 615,280 · +126.4%
Race, ethnicity, and origin ACS 2023
- Neighborhood character
- Predominantly White (77%)
- Race & ethnicity
- White 77% Two or more races 14% Hispanic / Latino 7% Black 3% Asian 2%
- Hispanic origin (detail)
- Mexican 5%
- Common ancestry
- Slovak 3% Italian 3% Lithuanian 2%
- Foreign-born
- 5% · Canada
- Languages at home
- 94% English-only · Spanish 3% Other Indo-European 2% Other Asian/Pacific 1%
Political lean MEDSL · Washington
- 2024 margin
- Lean R (+6.7) · D 45.1% · R 51.7% · Other 3.2%
- 2008→2024 swing
- +6.4pp toward D · 2008: -13.1pp · 2024: -6.7pp
- All cycles
- 2024: R+6.7 2020: R+3.9 2016: R+10.4 2012: R+16.3 2008: R+13.1
Not yet ingested
- Civics
- —
Market trends
- HPI YoY
- ▼ -73.44%
- Current HPI
- 289.7478
- Rent YoY
- ▲ 2.17%
- Metro
- Fayetteville-Springdale-Rogers, AR
- State GDP YoY
- ▲ 3.80%
- F500 in state
- 10
Industry mix (Fortune 500 HQ in AR)
| Industry | F500 HQs | Revenue |
|---|---|---|
| Retail | 1 | $681B |
|
||
| Food / Agriculture | 1 | $53B |
|
||
| Retail / Energy | 1 | $22B |
|
||
| Transportation / Logistics | 1 | $12B |
|
||
| Energy | 1 | $4B |
|
||
Price history
+462.5% since first listed4 events — show timeline
- 2026-05-21 Pending — NWARMLS
- 2026-05-08 Listed $224,999 NWARMLS
- 2014-10-31 Sold (MLS) $35,000 NWARMLS
- 2014-07-31 Listed $40,000 NWARMLS
Property tax history
-11.1%/yrLatest (2025): $206 · +13.6% YoY. Source: county tax records.
Cash-flow waterfall
monthlySold comps — $/sqft
last 12 mo · ≤1 miLoading sold comps…