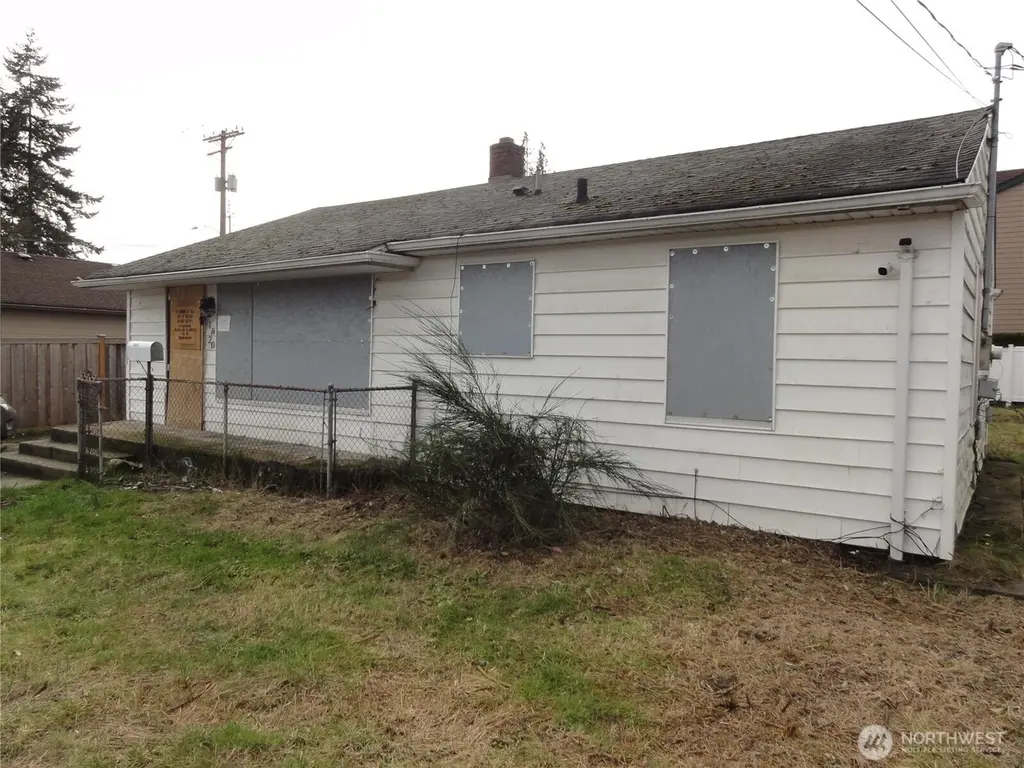
1820 S Sprague Ave · Tacoma, WA
Flood risk 1/10 · Minimal
- FEMA flood zone
- X (unshaded)
- Chance of flooding over 30 yrs
- 0.0%
- Est. flood insurance / yr
- $507 – $1,088
Fire risk 1/10 · Minimal
- Est. fire insurance / yr
- $604 – $1,122
Heat risk 3/10 · Minor
- Hot days now (above 87°F)
- 7 days/yr
- Hot days in 30 yrs
- 13 days/yr
Wind risk 1/10 · Minimal
- Chance of severe wind over 30 yrs
- —
Air-quality risk 7/10 · Major
- Unhealthy air days now
- 11 days/yr
- Unhealthy air days in 30 yrs
- 12 days/yr
Risk factors via First Street. Map © Google.
Why this score? — see what drove the D+ grade
The composite is a weighted blend of 9 inputs, each scored 0–100. Each bar is that input's sub-score; the figure is the points it added to the 100-point composite (weight × sub-score).
- ARV discount +15.0/15.0
- Cash flow +12.4/30.0
- Schools +4.2/10.0
- 1% rule +3.9/10.0
- Livability +3.9/5.0
- DSCR +3.7/10.0
- Rent growth +3.5/5.0
- Condition / age +2.5/5.0
- Appreciation +0.0/10.0
$233,000
🖨 Deal sheet (PDF) 📄 Offer letter ✓ Due diligence
Listing remarks
Opportunity awaits with this 1951 home offering 3 bedrooms, 1 bath, and a detached 2-car garage. Currently boarded up and in need of repairs, this property is ready for someone with vision to bring it back to life. Whether you’re an investor, builder, or buyer looking for a project, this home provides a blank canvas to create something special. The existing layout includes three bedrooms and one bathroom, with plenty of potential to reimagine the space and restore its character. The detached two-car garage offers additional storage, workshop space, or parking. Bring your tools, creativity, and ideas—this property is the perfect palette for painting your imagination. With the rig
Key facts
- 5,684 sq ft lot
- Garage
- Built 1951
Neighborhood map
What this means for you Summary
Snapshot
- This is a 3-bed/1.0-bath single-family listed at $233k.
Deal economics
- At list price, monthly cash flow is $-38 ($-459/yr) — negative.
- To cash-flow at today's rent, offer at most $226k (2.9% below list).
- To meet the 1% rule (rent ≥ 1% of price), the offer needs to be $207k (11.2% below list).
- Recommended offer: $207k (11.2% below list) — sets the bar for 1% rule.
- Cap rate 6.1% vs local median 2.9% in Tacoma — top-decile yield for the area; either an underpriced asset or a hidden risk that comps aren't pricing in. Stress-test before assuming the spread holds.
Location & tenants
- Location reads 78/100 on livability (#127 in WA, #2,535 nationally) — a middle-class / working-renter tenant base. Strengths: amenities A+, commute A+, housing A+; Watch: cost of living D, crime F.
- Tacoma School District (urban): math 40% / reading 53% proficiency, ranked #169 of 291 in WA (top 58%) — families likely to look elsewhere, expect single-tenant / working-renter base with shorter leases.
- Zoned schools: Stanley Elementary School (336 students, 66% FRL); Hilltop Heritage Middle School (524 students, 60% FRL); Tacoma School of The Arts (624 students, 49% FRL).
- Market conditions: Rents rising (+3.9%/yr); 123 active listings in the ZIP; 40 comparable units currently listed for rent nearby; rentals leasing fast (median 10d on market — plan ~1-2 weeks tenant-placement turnaround); solid renter incomes; 3,209 units permitted in Pierce County in 2024 (1,269 in 5+ unit buildings).
- This rent runs 33% of the median local income ($76k/yr) — at the standard rent-burdened threshold; future hikes will face affordability resistance.
Forward outlook
- Local home prices are declining (-3.0%/yr); year-one equity from $2k of loan paydown is wiped out by about $7k of value loss. Plan a longer hold.
- Pierce County population projected at +26% by 2050 — long-run rental-demand tailwind backs the buy-and-hold thesis.
Negotiation context
- Only 14 days on market — expect competitive offers; lowballing is unlikely to land.
- 5 sale attempts since 22y ago with the ask held roughly flat each time — persistent listings suggest the price (not the market) is what's stuck; bring a comps-based counter.
Risks & watch-outs
- Watch-outs: built in 1951 — expect roof / HVAC / electrical / plumbing capex.
Questions for the listing agent
- What do current leases actually rent for vs. the listed asking? Can we see a recent rent roll and the last 12 months of T-12 income?
- Built in 1951 — when were the roof, HVAC, electrical panel, plumbing, and water heater last replaced?
- Is there a deadline driving the sale (1031 exchange, divorce, estate, relocation)? That informs how much negotiation room exists.
- Schools are B-rated — typically a magnet for longer-tenancy family renters. What's the average tenant stay here, and is there a school-zone premium baked into asking?
- Crime grade is F in this area — have there been break-ins, vandalism, or insurance claims at this property in the last 3 years? What carrier currently insures it and at what premium?
- The area grade is low — what's the realistic commute time and amenity access for the typical tenant pool here? Any planned neighborhood developments (good or bad) we should know about?
- What's the average days-on-market for RENTAL listings here right now (not sales)? A rising rental-DOM trend means longer vacancies and softer asking-rent achievability than the comps imply.
- What's the recent tenant-quality profile in this submarket — average credit score on applications, eviction rate, late-payment / NSF rate, and stable-employment percentage? A property-management company in the area should have these aggregated.
- How much new for-sale + rental construction is in the pipeline within 1–3 miles? Heavy new supply typically softens prices + rents 12–24 months out; constrained supply supports both.
Investment metrics
- 1% rule
- 0.89% ✗
- Cap rate
- 6.10%
- Cash-on-cash
- -0.70%
- DSCR
- 0.97
- GRM
- 9.4
CMA / ARV
- ARV (on-the-fly)
- $409,968
- Comps found
- 12
Show comp detail 12 sales within ~0.75 mi
| Address | Dist | Beds/Ba | Sqft | Sold | Price | $/sf | Match |
|---|---|---|---|---|---|---|---|
| 1820 S Sprague Ave | 0.00mi | 3/1.0 | 949 (0%) | 1mo | $290,000 | $306 | 100 |
| 2113 S Wilkeson St | 0.30mi | 3/1.0 | 955 (+1%) | 1mo | $400,000 | $419 | 85 |
| 1807 S Sprague Ave | 0.06mi | 3/1.0 | 864 (-9%) | 4mo | $350,000 | $405 | 79 |
| 1722 S Cushman Ave Unit B | 0.35mi | 2/1.0 (-1) | 960 (+1%) | 2mo | $425,000 | $443 | 75 |
| 2123 S Wilkeson St | 0.31mi | 3/1.0 | 879 (-7%) | 0mo | $379,950 | $432 | 73 |
| 2532 S Ainsworth Ave | 0.63mi | 3/1.0 | 975 (+3%) | 0mo | $330,000 | $338 | 66 |
| 2533 S Grant Ave | 0.61mi | 3/2.0 | 952 (+0%) | 2mo | $425,000 | $446 | 65 |
| 1706 S Fife St | 0.36mi | 3/1.0 | 1,051 (+11%) | 1mo | $280,000 | $266 | 64 |
| 1901 S Hosmer St | 0.10mi | 2/1.0 (-1) | 812 (-14%) | 4mo | $385,000 | $474 | 63 |
| 1310 S Pine St | 0.63mi | 3/1.0 | 1,008 (+6%) | 2mo | $448,900 | $445 | 58 |
| 1241 S State St | 0.39mi | 2/1.0 (-1) | 816 (-14%) | 1mo | $376,212 | $461 | 53 |
| 2355 S Hosmer St | 0.41mi | 3/2.0 | 1,077 (+14%) | 3mo | $440,000 | $409 | 52 |
Match score weights: distance 35% · size 25% · config 20% · recency 20%. Top-matched comps best support the ARV.
Projected returns pro-forma
-3.0% appreciation · 3.9% rent growth · sell at horizon
- IRR
- -16.4%
- Equity multiple
- 0.41×
- Total profit
- $-38,230
- Equity at exit
- $34,741
- IRR
- -6.5%
- Equity multiple
- 0.57×
- Total profit
- $-28,240
- Equity at exit
- $20,146
Cash invested: $65,240 (down + closing). Projections, not guarantees.
Landlord ↔ Tenant lean methodology
- Overall (STATE)
- 28 Tenant-Leaning
- State Washington
- 28 Tenant-Leaning · D+8
- County
- — inherits STATE
- City
- — inherits STATE
ZIP-level market 98405
- Rents YoY
- 3.9%
- Active inventory
- 123
- Price-to-rent
- 9.4×
Monthly cashflow live
- Estimated rent
- $2,069 high interval (Pro) →
- Mortgage (P&I)
- −$1,222
- Tax from tax record
- −$354 /mo · $4,247/yr
- Insurance
- −$97
- HOA
- −$0
- Vacancy / Maint / Mgmt
- −$435
- Net cashflow
- $-38
Break-even live
Sensitivity live
| Price | -10% $94 | -5% $28 | +0% $-38 | +5% $-104 | +10% $-170 |
|---|---|---|---|---|---|
| Rent | -10% $-202 | -5% $-120 | +0% $-38 | +5% $44 | +10% $125 |
| Rate | -1.0pp $79 | -0.5pp $21 | base $-38 | +0.5pp $-99 | +1.0pp $-160 |
UW: 25.0% down · 7.5% · 30yr · 1.5% tax · 5.0% vac · 8.0% maint · 8.0% mgmt
Financing live
Cash to close
- Down payment
- $58,250
- Closing costs
- $6,990
- Reserves months
- —
- Total cash needed
- —
Loan-product check · same deal, 3 products live
Conventional
25% down · 7.5% · 30yr
- Down + closing
- —
- Monthly P&I
- —
- Monthly cashflow
- —
- DSCR
- —
- Eligible?
- —
Personal DTI + credit; lowest rate.
DSCR
20% down · 8.5% · 30yr
- Down + closing
- —
- Monthly P&I
- —
- Monthly cashflow
- —
- DSCR
- —
- Eligible?
- —
No personal income docs; deal must DSCR.
Hard money
10% down · 12.0% · 12mo
- Down + closing
- —
- Monthly P&I
- —
- Monthly cashflow
- —
- DSCR
- —
- Eligible?
- —
Short-term bridge; refi at stabilization.
Rent comps 40 comps
| Address | Beds | Baths | Sqft | Rent | $/sqft | DOM | Units | Dist |
|---|---|---|---|---|---|---|---|---|
| 1823 S Sprague Ave Tacoma, WA | 2.0 | 1.0 | 768 | $2,400 | $3.12 | 26d | 1 | 0.02mi |
| 1823 S Sprague Ave Tacoma, WA | 2.0 | 1.0 | 768 | $2,400 | $3.12 | 1d | 1 | 0.02mi |
| 1541 S Ridgewood Ave Tacoma, WA | 3.0 | 1.0 | 915 | $2,200 | $2.40 | 4d | 1 | 0.21mi |
| 1541 S Ridgewood Ave Tacoma, WA | 3.0 | 1.0 | 915 | $2,200 | $2.40 | 1d | 1 | 0.21mi |
| 1801 S 15th St Tacoma, WA | 1.0–2.0 | 1.0 | 567 | $1,499 | $2.64 | 1d | 7 | 0.32mi |
| 1402 Earnest S Brazill St Unit H Tacoma, WA | 2.0 | 1.0 | 580 | $1,395 | $2.41 | 3d | 1 | 0.60mi |
| 1402 Earnest S Brazill St Apt G Tacoma, WA | 2.0 | 1.0 | 580 | $1,295 | $2.23 | 3d | 1 | 0.60mi |
| 1316 S 25th St Tacoma, WA | 2.0 | 1.0 | 848 | $1,895 | $2.23 | 26d | 1 | 0.65mi |
| 1711 S 9th St Unit B Tacoma, WA | 2.0 | 1.0 | 1040 | $1,295 | $1.25 | 1d | 1 | 0.72mi |
| 1711 S 9th St Unit A Tacoma, WA | 3.0 | 1.0 | 1040 | $1,595 | $1.53 | 1d | 1 | 0.72mi |
| 1111 S L St Tacoma, WA | 3.0 | 2.0 | 1055 | $1,779 | $1.69 | 4d | 3 | 0.73mi |
| 630-632 S State St Apt 1 Tacoma, WA | 2.0 | 1.0 | 792 | $1,625 | $2.05 | 26d | 1 | 0.79mi |
| 630-632 S State St Unit 2 Tacoma, WA | 2.0 | 1.0 | 792 | $1,695 | $2.14 | 15d | 1 | 0.79mi |
| 630-632 S State St Tacoma, WA | 2.0 | 1.0 | 792 | $1,625 | $2.05 | 16d | 1 | 0.79mi |
| 630-632 S State St Tacoma, WA | 2.0 | 1.0 | 792 | $1,695 | $2.14 | 15d | 1 | 0.79mi |
| 1011 S 11th St Tacoma, WA | 2.0 | 1.0–2.0 | 839 | $2,805 | $3.34 | 0d | 18 | 0.85mi |
| 2416 S I St Tacoma, WA | 2.0 | 1.0 | 745 | $1,495 | $2.01 | 26d | 1 | 0.86mi |
| 1506 S G St Unit 3 Tacoma, WA | 2.0 | 1.0 | 750 | $1,450 | $1.93 | 3d | 1 | 0.91mi |
| 1502 S G St Tacoma, WA | 2.0 | 1.0 | 764 | $1,595 | $2.09 | 9d | 1 | 0.91mi |
| 1121 S I St Unit 1121-300 Tacoma, WA | 2.0 | 1.0 | 703 | $1,095 | $1.56 | 6d | 1 | 0.91mi |
| 2503 S I St Tacoma, WA | 3.0 | 1.0 | 864 | $1,480 | $1.71 | 4d | 2 | 0.93mi |
| 3301 S Asotin St Unit B Tacoma, WA | 2.0 | 1.0 | 850 | $1,295 | $1.52 | 26d | 1 | 0.96mi |
| 920 S 9th St Unit 3 Tacoma, WA | 2.0 | 1.0 | 1000 | $1,895 | $1.90 | 26d | 1 | 0.97mi |
| 3303 S Ainsworth Ave Unit A Tacoma, WA | 3.0 | 2.0 | 1030 | $2,180 | $2.12 | 26d | 1 | 0.99mi |
| 1915 Tacoma Ave S Tacoma, WA | 2.0 | 1.0–2.0 | 669 | $2,607 | $3.89 | 0d | 72 | 0.99mi |
| 1402 Tacoma Ave S Tacoma, WA | 2.0 | 1.0–2.0 | 533 | $2,165 | $4.06 | 0d | 19 | 1.00mi |
| 1515 Tacoma Ave S Tacoma, WA | 2.0 | 1.0–2.0 | 769 | $2,610 | $3.39 | 0d | 13 | 1.00mi |
| 640 N Prospect St Unit D Tacoma, WA | 2.0 | 1.5 | 850 | $1,825 | $2.15 | 26d | 1 | 1.01mi |
| 1502 Fawcett Ave Tacoma, WA | 2.0 | 1.0–2.0 | 903 | $3,725 | $4.13 | 16d | 21 | 1.04mi |
| 1210 Tacoma Ave S Tacoma, WA | 2.0 | 1.0–2.0 | 751 | $2,236 | $2.98 | 1d | 12 | 1.04mi |
| 3701 S 18th St Tacoma, WA | 2.0 | 1.0 | 1050 | $2,395 | $2.28 | 16d | 1 | 1.05mi |
| 2125 S Adams St Unit Top Floor Tacoma, WA | 2.0 | 1.0 | 1000 | $2,000 | $2.00 | 9d | 1 | 1.05mi |
| 908 N Grant Ave Unit 908A Tacoma, WA | 2.0 | 2.0 | 900 | $2,330 | $2.59 | 26d | 1 | 1.07mi |
| 411 S 15th St Tacoma, WA | 2.0 | 1.0–2.0 | 500 | $2,250 | $4.50 | 1d | 5 | 1.09mi |
| 902 S 7th St Apt 7 Tacoma, WA | 2.0 | 1.0 | 540 | $1,399 | $2.59 | 23d | 1 | 1.09mi |
| 409 S 23rd St Tacoma, WA | 2.0 | 1.0 | 565 | $1,880 | $3.33 | 4d | 30 | 1.11mi |
| 603 S J St Tacoma, WA | 1.0–2.0 | 1.0–2.0 | 805 | $2,367 | $2.94 | 0d | 4 | 1.12mi |
| 1516 N 9th St Tacoma, WA | 2.0 | 1.0 | 845 | $1,950 | $2.31 | 15d | 1 | 1.14mi |
| 1708 S Durango St Unit B Tacoma, WA | 2.0 | 1.0 | 840 | $1,730 | $2.06 | 26d | 1 | 1.18mi |
| 401 N M St Unit C Tacoma, WA | 2.0 | 1.0 | 720 | $1,395 | $1.94 | 16d | 1 | 1.20mi |
Listing history 19 events
-
2026-03-30status Pending
-
2026-03-16$233,000 Active
-
2021-09-15soldstatus $345,000 Closed
-
2021-08-02status Pending
-
2021-07-29$329,900 Active
-
2015-02-15historical
-
2015-02-13soldstatus $119,500
-
2015-01-24status Pending
-
2015-01-15status Pending Inspection
-
2014-11-14price
-
2014-10-18Active
-
2009-03-25soldstatus $97,900 Sold
-
2009-02-04historical
-
2009-01-22$99,900
-
2006-09-05soldstatus $168,400
-
2004-05-28soldstatus $110,500
-
2004-05-28soldstatus $110,500
-
2004-02-22$109,950
-
1991-08-22soldstatus $53,000
ⓘ Source: listings_history table (triggers on properties + properties_extension) + one-shot
backfill from property_details.listing_events for pre-trigger history.
Tax reassessment forecast WA · Resets to sale price
- Current annual tax
- $4,247 · $354/mo
- Projected year-2 tax
- $4,247 · $354/mo
- Expected delta
- $0/yr ($0/mo · 0.0%)
ⓘ Screening estimate from a state-policy table — verify with the county assessor before closing.
Climate risk First Street
- Flood 1/10 Low FEMA zone X (unshaded) · 0% chance over 30 yrs
- Wildfire 1/10 Low
- Heat 3/10 Moderate 7 d/yr ≥87°F today · 13 d/yr by 30 yrs out
- Wind 1/10 Low
- Air quality 7/10 Severe 11 unhealthy d/yr today · 12 by 30 yrs out
Nearby sold comps map
Loading sold comps map…
Walkable amenities ~0.75 mi
Loading nearby amenities…
Taxation est. · year 1
- Rental income
- $24,830
- − Mortgage interest
- −$13,052
- − Property taxes
- −$4,247
- − Insurance
- −$1,165
- − Repairs & maintenance
- −$1,986
- − Management
- −$1,986
- − Depreciation
- −$6,778
- Taxable loss
- −$4,384
- Est. tax savings @ 24.0%
- +$1,052
- After-tax cash flow
- $594/yr
For passive investors: Depreciation is non-cash, so a rental often shows a tax loss while cash-flowing — sheltering income. Rental losses are passive: they offset passive income freely, and up to $25,000/yr can offset ordinary (W-2) income if you actively participate and your MAGI is under $100k (phasing out to $0 by $150k); unused losses carry forward. On sale, claimed depreciation is recaptured at up to 25%, and gains may owe capital-gains tax (a 1031 exchange can defer both). Figures are a year-1 estimate at your 24.0% rate — not tax advice; consult a CPA.
Schools (NCES district)
- District
- Tacoma School District
- NCES district ID
- 5308700
- Math proficiency
- 40% ▬ 0.00%
- Reading proficiency
- 53% ▲ 1.00%
- Median HH income
- $52,467
- Composite
- 42.25/100
- National rank
- #6987
- State rank
- #169 of 291 in WA
Livability — Tacoma
- Score
- 78/100
- State rank
- #127
- US rank
- #2535
Category grades
Schools grade is shown separately in the Schools card above.
Census & demographics
- Census place
- Tacoma, WA
- County
- Pierce County · 788,257 people
- City population
- 212,935
- Metro
- Seattle-Tacoma-Bellevue, WA
- Population (ZIP)
- 25,939
- Household income
- $75,946
- Rent vs Own
- Severe rent burden
- 1313.0
Population outlook (Pierce County) Hauer SSP2
- Today (2025)
- 956,648 people
- By 2030
- 1,010,862 · +5.7%
- By 2040
- 1,113,170 · +16.4%
- By 2050
- 1,206,524 · +26.1%
- By 2075
- 1,436,425 · +50.2%
- By 2100
- 1,563,654 · +63.5%
Race, ethnicity, and origin ACS 2023
- Neighborhood character
- Diverse neighborhood (Simpson 0.63)
- Race & ethnicity
- White 58% Two or more races 16% Black 13% Hispanic / Latino 11% Asian 5%
- Hispanic origin (detail)
- Mexican 9% Puerto Rican 1%
- Common ancestry
- Portuguese 4% Scottish 3% Slovak 3%
- Foreign-born
- 8% · Canada, Vietnam
- Languages at home
- 88% English-only · Spanish 6% Vietnamese 2% Russian/Polish/Slavic 1%
Political lean MEDSL · Pierce
- 2024 margin
- D (+10.8) · D 53.9% · R 43.1% · Other 3.0%
- 2008→2024 swing
- -1.4pp toward R · 2008: 12.2pp · 2024: 10.8pp
- All cycles
- 2024: D+10.8 2020: D+11.2 2016: D+7.5 2012: D+11.0 2008: D+12.2
Not yet ingested
- Civics
- —
Market trends
- HPI YoY
- ▼ -570.22%
- Current HPI
- 378.3973
- Rent YoY
- ▲ 3.90%
- Metro
- Seattle-Tacoma-Bellevue, WA
- State GDP YoY
- ▲ 4.65%
- F500 in state
- 22
Industry mix (Fortune 500 HQ in WA)
| Industry | F500 HQs | Revenue |
|---|---|---|
| Retail | 2 | $269B |
|
||
| Technology / Retail | 1 | $638B |
|
||
| Technology | 1 | $245B |
|
||
| Telecommunications | 1 | $38B |
|
||
| Food / Beverage | 1 | $36B |
|
||
| Automotive / Trucks | 1 | $34B |
|
||
Price history
+339.6% since first listed19 events — show timeline
- 2026-03-30 Pending — NWMLS as Distributed by MLS Grid
- 2026-03-16 Listed $233,000 NWMLS as Distributed by MLS Grid
- 2021-09-15 Sold (MLS) $345,000 NWMLS as Distributed by MLS Grid
- 2021-08-02 Pending — NWMLS as Distributed by MLS Grid
- 2021-07-29 Listed $329,900 NWMLS as Distributed by MLS Grid
- 2015-02-15 Delisted — NWMLS as Distributed by MLS Grid
- 2015-02-13 Sold (Public Records) $119,500 Public Records
- 2015-01-24 Pending — NWMLS as Distributed by MLS Grid
- 2015-01-15 Pending — NWMLS as Distributed by MLS Grid
- 2014-11-14 Price Changed — NWMLS as Distributed by MLS Grid
- 2014-10-18 Listed — NWMLS as Distributed by MLS Grid
- 2009-03-25 Sold (MLS) $97,900 NWMLS as Distributed by MLS Grid
- 2009-02-04 Delisted — NWMLS as Distributed by MLS Grid
- 2009-01-22 Listed $99,900 NWMLS as Distributed by MLS Grid
- 2006-09-05 Sold (Public Records) $168,400 Public Records
- 2004-05-28 Sold (Public Records) $110,500 Public Records
- 2004-05-28 Sold (MLS) $110,500 NWMLS as Distributed by MLS Grid
- 2004-02-22 Listed $109,950 NWMLS as Distributed by MLS Grid
- 1991-08-22 Sold (Public Records) $53,000 Public Records
Property tax history
+4.2%/yrLatest (2026): $4,247 · +1.9% YoY. Source: county tax records.
Cash-flow waterfall
monthlySold comps — $/sqft
last 12 mo · ≤1 miLoading sold comps…