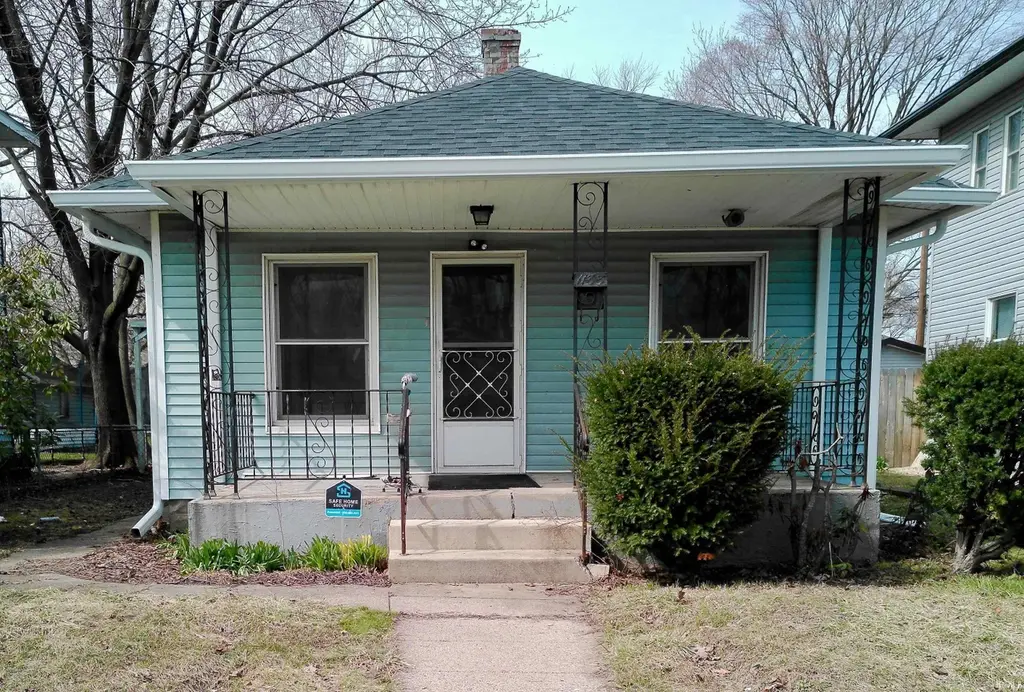
1133 N Brookfield St · South Bend, IN
Flood risk 1/10 · Minimal
- FEMA flood zone
- X (unshaded)
- Chance of flooding over 30 yrs
- 0.0%
- Est. flood insurance / yr
- $473 – $860
Fire risk 1/10 · Minimal
- Est. fire insurance / yr
- $717 – $1,331
Heat risk 2/10 · Minimal
- Hot days now (above 99°F)
- 7 days/yr
- Hot days in 30 yrs
- 15 days/yr
Wind risk 2/10 · Minimal
- Chance of severe wind over 30 yrs
- —
Air-quality risk 3/10 · Minor
- Unhealthy air days now
- 3 days/yr
- Unhealthy air days in 30 yrs
- 3 days/yr
Risk factors via First Street. Map © Google.
Why this score? — see what drove the C- grade
The composite is a weighted blend of 9 inputs, each scored 0–100. Each bar is that input's sub-score; the figure is the points it added to the 100-point composite (weight × sub-score).
- Cash flow +25.7/30.0
- DSCR +8.5/10.0
- 1% rule +5.7/10.0
- Rent growth +4.2/5.0
- Livability +3.2/5.0
- Condition / age +2.5/5.0
- Schools +1.4/10.0
- ARV discount +0.0/15.0
- Appreciation +0.0/10.0
$109,999
🖨 Deal sheet (PDF) 📄 Offer letter ✓ Due diligence
Listing remarks
Welcome home! This attractive and affordable 2-bedroom home in South Bend is ideal for owner-occupants or investors. The modernized kitchen features newly installed cabinets, countertops, appliances and fixtures, while the updated, spacious bathroom enhances both comfort and style. Additional amenities include beautifully refinished hardwood floors and convenient first-floor laundry. The exterior offers a fenced backyard, covered patio, and a detached one-car garage. Schedule your private showing today!
Key facts
- Modernized kitchen
- Fenced backyard
- Updated bathroom
Tags
Neighborhood map
What this means for you Summary
Snapshot
- This is a 2-bed/1.0-bath single-family listed at $110k.
Deal economics
- At list price, monthly cash flow is $262 ($3k/yr) — positive.
- The deal already cash-flows at list — no discount required.
- Meets the 1% rule at list price ($1k rent vs $110k).
- Recommended offer: $107k (3.0% below list) — sets the bar for market timing.
- Cap rate 9.2% vs local median 4.4% in South Bend — top-decile yield for the area; either an underpriced asset or a hidden risk that comps aren't pricing in. Stress-test before assuming the spread holds.
Location & tenants
- Location reads 64/100 on livability (#365 in IN) — a middle-class / working-renter tenant base. Strengths: cost of living A+, housing A+, health & safety A+; Watch: amenities D, employment D, crime F.
- South Bend Community School Corporation (urban): math 12% / reading 21% proficiency, ranked #284 of 301 in IN (top 94%) — low school quality limits family demand, transient renter base, plan for 1-2y turnover; 66% free/reduced lunch — lower-income household profile, screen leases tightly.
- Zoned schools: Muessel Elementary School (math 2% / reading 2%, grade F, #989 of 994 statewide, top 100%, 241 students, 88% FRL); Jefferson Traditional School (math 12% / reading 22%, grade F, #284 of 330 statewide, top 87%, 516 students, 64% FRL); Adams High School (math 28% / reading 57%, grade F, #195 of 369 statewide, top 53%, 1,976 students, 56% FRL) — zoned schools at 69% FRL track the district average.
- Market conditions: Rents rising fast (+6.8%/yr); 429 active listings in the ZIP; 29 comparable units currently listed for rent nearby; rentals at typical pace (median 23d on market — plan ~3-4 weeks tenant-placement turnaround); 41% of comp listings sitting > 30 days — soft ceiling on asking rent; 754 units permitted in St. Joseph County in 2024 (460 in 5+ unit buildings).
Forward outlook
- Local home prices are declining (-3.0%/yr); year-one equity from $760 of loan paydown is wiped out by about $3k of value loss. Plan a longer hold.
- At projected returns (-3.0% appreciation + 6.8% rent growth), your $31k cash investment doubles in ~8 years — after that, you're playing with house money.
Negotiation context
- It's been on market 32 days — a 3% lower offer ($107k) is reasonable based on typical stale-listing flexibility.
Risks & watch-outs
- Watch-outs: built in 1922 — expect roof / HVAC / electrical / plumbing capex.
Questions for the listing agent
- It's been on market 32 days. Have you received any prior offers? Is the seller open to a 3% concession, seller financing, or rate buy-down credit?
- Built in 1922 — when were the roof, HVAC, electrical panel, plumbing, and water heater last replaced?
- Is there a deadline driving the sale (1031 exchange, divorce, estate, relocation)? That informs how much negotiation room exists.
- Schools are F-rated, which usually means shorter tenancies and higher turnover. Who's the typical renter profile here, and what's been the actual vacancy rate?
- Crime grade is F in this area — have there been break-ins, vandalism, or insurance claims at this property in the last 3 years? What carrier currently insures it and at what premium?
- What's the average days-on-market for RENTAL listings here right now (not sales)? A rising rental-DOM trend means longer vacancies and softer asking-rent achievability than the comps imply.
- What's the recent tenant-quality profile in this submarket — average credit score on applications, eviction rate, late-payment / NSF rate, and stable-employment percentage? A property-management company in the area should have these aggregated.
- How much new for-sale + rental construction is in the pipeline within 1–3 miles? Heavy new supply typically softens prices + rents 12–24 months out; constrained supply supports both.
Investment metrics
- 1% rule
- 1.07% ✓
- Cap rate
- 9.15%
- Cash-on-cash
- 10.22%
- DSCR
- 1.45
- GRM
- 7.8
CMA / ARV
- ARV (on-the-fly)
- $83,952
- Comps found
- 12
Show comp detail 12 sales within ~0.75 mi
| Address | Dist | Beds/Ba | Sqft | Sold | Price | $/sf | Match |
|---|---|---|---|---|---|---|---|
| 1133 N Brookfield St | 0.00mi | 2/1.0 | 792 (0%) | 0mo | $112,900 | $143 | 100 |
| 1521 Van Buren St | 0.34mi | 2/1.0 | 792 (0%) | 1mo | $60,000 | $76 | 84 |
| 1118 N Brookfield St | 0.04mi | 2/1.0 | 864 (+9%) | 1mo | $159,900 | $185 | 82 |
| 1501 N Adams St | 0.34mi | 2/1.0 | 840 (+6%) | 0mo | $134,900 | $161 | 74 |
| 814 Sancome Ave | 0.40mi | 2/1.0 | 748 (-6%) | 2mo | $56,000 | $75 | 71 |
| 2702 Prast Blvd | 0.59mi | 2/1.0 | 804 (+2%) | 0mo | $75,000 | $93 | 70 |
| 1622 Wilber St | 0.49mi | 2/1.0 | 840 (+6%) | 3mo | $107,800 | $128 | 64 |
| 1353 N Olive St | 0.38mi | 2/1.0 | 720 (-9%) | 3mo | $60,000 | $83 | 64 |
| 925 Sancome Ave | 0.34mi | 3/1.0 (+1) | 864 (+9%) | 1mo | $108,000 | $125 | 63 |
| 1650 N Brookfield St | 0.48mi | 2/1.0 | 720 (-9%) | 1mo | $50,000 | $69 | 62 |
| 722 Johnson St | 0.37mi | 2/1.0 | 892 (+13%) | 0mo | $65,000 | $73 | 62 |
| 1811 N Brookfield St | 0.65mi | 2/1.0 | 852 (+8%) | 1mo | $89,900 | $106 | 56 |
Match score weights: distance 35% · size 25% · config 20% · recency 20%. Top-matched comps best support the ARV.
Projected returns pro-forma
-3.0% appreciation · 6.78% rent growth · sell at horizon
- IRR
- 2.8%
- Equity multiple
- 1.11×
- Total profit
- $3,476
- Equity at exit
- $16,401
- IRR
- 15.5%
- Equity multiple
- 2.46×
- Total profit
- $44,956
- Equity at exit
- $9,511
Cash invested: $30,800 (down + closing). Projections, not guarantees.
Landlord ↔ Tenant lean methodology
- Overall (STATE)
- 90 Strongly Landlord-Friendly
- State Indiana
- 90 Strongly Landlord-Friendly · R+11
- County
- — inherits STATE
- City
- — inherits STATE
ZIP-level market 46628
- Rents YoY
- 6.8%
- Active inventory
- 429
- Price-to-rent
- 7.8×
Monthly cashflow live
- Estimated rent
- $1,176 high interval (Pro) →
- Mortgage (P&I)
- −$577
- Tax from tax record
- −$44 /mo · $527/yr
- Insurance
- −$46
- HOA
- −$0
- Vacancy / Maint / Mgmt
- −$247
- Net cashflow
- $262
Break-even live
Sensitivity live
| Price | -10% $324 | -5% $293 | +0% $262 | +5% $231 | +10% $200 |
|---|---|---|---|---|---|
| Rent | -10% $169 | -5% $216 | +0% $262 | +5% $309 | +10% $355 |
| Rate | -1.0pp $318 | -0.5pp $290 | base $262 | +0.5pp $234 | +1.0pp $205 |
UW: 25.0% down · 7.5% · 30yr · 1.5% tax · 5.0% vac · 8.0% maint · 8.0% mgmt
Financing live
Cash to close
- Down payment
- $27,500
- Closing costs
- $3,300
- Reserves months
- —
- Total cash needed
- —
Loan-product check · same deal, 3 products live
Conventional
25% down · 7.5% · 30yr
- Down + closing
- —
- Monthly P&I
- —
- Monthly cashflow
- —
- DSCR
- —
- Eligible?
- —
Personal DTI + credit; lowest rate.
DSCR
20% down · 8.5% · 30yr
- Down + closing
- —
- Monthly P&I
- —
- Monthly cashflow
- —
- DSCR
- —
- Eligible?
- —
No personal income docs; deal must DSCR.
Hard money
10% down · 12.0% · 12mo
- Down + closing
- —
- Monthly P&I
- —
- Monthly cashflow
- —
- DSCR
- —
- Eligible?
- —
Short-term bridge; refi at stabilization.
Rent comps 29 comps
| Address | Beds | Baths | Sqft | Rent | $/sqft | DOM | Units | Dist |
|---|---|---|---|---|---|---|---|---|
| 1314 Johnson St South Bend, IN | 2.0 | 1.0 | 902 | $1,150 | $1.27 | 15d | 1 | 0.17mi |
| 1046 N Elmer St South Bend, IN | 2.0 | 1.0 | 1050 | $1,025 | $0.98 | 22d | 1 | 0.23mi |
| 1237 Wilber St South Bend, IN | 2.0 | 1.0 | 880 | $1,200 | $1.36 | 45d | 1 | 0.23mi |
| 2013 Elwood Ave South Bend, IN | 3.0 | 1.0 | 720 | $999 | $1.39 | 45d | 1 | 0.29mi |
| 1141 Fremont St South Bend, IN | 3.0 | 1.0 | 760 | $1,100 | $1.45 | 22d | 1 | 0.37mi |
| 1505 Huey St South Bend, IN | 3.0 | 1.0 | 864 | $1,425 | $1.65 | 22d | 1 | 0.39mi |
| 717 Huey St South Bend, IN | 2.0 | 1.0 | 672 | $1,050 | $1.56 | 45d | 1 | 0.43mi |
| 729 N Elmer St South Bend, IN | 2.0 | 1.0 | 672 | $1,100 | $1.64 | 15d | 1 | 0.46mi |
| 1630 Obrien St South Bend, IN | 3.0 | 1.0 | 1120 | $1,400 | $1.25 | 15d | 1 | 0.47mi |
| 736 Lawndale Ave Unit 1 South Bend, IN | 3.0 | 1.0 | 1072 | $1,200 | $1.12 | 15d | 1 | 0.50mi |
| 1710 Johnson St South Bend, IN | 3.0 | 1.0 | 1000 | $1,350 | $1.35 | 45d | 1 | 0.54mi |
| 1614 Fremont St South Bend, IN | 2.0 | 1.0 | 720 | $850 | $1.18 | 22d | 1 | 0.55mi |
| 1709 Huey St South Bend, IN | 2.0 | 1.0 | 720 | $995 | $1.38 | 22d | 1 | 0.57mi |
| 2823 Calhoun St South Bend, IN | 2.0 | 1.0 | 720 | $1,249 | $1.73 | 45d | 1 | 0.63mi |
| 1308 Kinyon St South Bend, IN | 2.0 | 1.0 | 700 | $1,100 | $1.57 | 45d | 1 | 0.64mi |
| 910 Allen St South Bend, IN | 3.0 | 1.0 | 1100 | $1,350 | $1.23 | 22d | 1 | 0.65mi |
| 1428 Kessler Blvd South Bend, IN | 3.0 | 1.0 | 936 | $1,000 | $1.07 | 45d | 1 | 0.66mi |
| 1214 Queen St South Bend, IN | 3.0 | 1.0 | 1056 | $1,300 | $1.23 | 15d | 1 | 0.66mi |
| 1201 Woodward Ave South Bend, IN | 2.0 | 1.0 | 960 | $1,675 | $1.74 | 45d | 1 | 0.69mi |
| 2417 Linden Ave South Bend, IN | 2.0 | 1.0 | 1000 | $1,200 | $1.20 | 45d | 1 | 0.77mi |
| 3224 Ardmore Trl South Bend, IN | 1.0 | 1.0 | 675 | $864 | $1.28 | 15d | 2 | 0.86mi |
| 1033 Beale St South Bend, IN | 3.0 | 1.0 | 840 | $1,250 | $1.49 | 22d | 1 | 0.93mi |
| 937 Roosevelt St South Bend, IN | 2.0 | 1.0 | 720 | $1,060 | $1.47 | 45d | 1 | 0.96mi |
| 929 Beale St South Bend, IN | 2.0 | 1.0 | 720 | $975 | $1.35 | 45d | 1 | 1.01mi |
| 344 Parkovash Ave South Bend, IN | 3.0 | 1.0 | 950 | $1,900 | $2.00 | 15d | 1 | 1.16mi |
| 208 S Bendix Dr South Bend, IN | 3.0 | 1.0 | 864 | $1,150 | $1.33 | 22d | 1 | 1.25mi |
| 1301 N Michigan St South Bend, IN | 1.0 | 1.0 | 575 | $740 | $1.29 | 22d | 1 | 1.40mi |
| 453 S Kaley St Unit 1 South Bend, IN | 2.0 | 1.0 | 1100 | $1,050 | $0.95 | 45d | 1 | 1.45mi |
| 125 W Marion St South Bend, IN | 2.0 | 1.0 | 672 | $1,350 | $2.01 | 15d | 5 | 1.48mi |
Listing history 3 events
-
2026-04-25status Pending
-
2026-04-13price $109,999
-
2026-03-24$115,000 Active
ⓘ Source: listings_history table (triggers on properties + properties_extension) + one-shot
backfill from property_details.listing_events for pre-trigger history.
Tax reassessment forecast IN · Partial reset (capped growth)
- Current annual tax
- $527 · $44/mo
- Projected year-2 tax
- $731 · $61/mo
- Expected delta
- +$204/yr (+$17/mo · 38.7%)
ⓘ Screening estimate from a state-policy table — verify with the county assessor before closing.
Climate risk First Street
- Flood 1/10 Low FEMA zone X (unshaded) · 0% chance over 30 yrs
- Wildfire 1/10 Low
- Heat 2/10 Low 7 d/yr ≥99°F today · 15 d/yr by 30 yrs out
- Wind 2/10 Low
- Air quality 3/10 Moderate 3 unhealthy d/yr today · 3 by 30 yrs out
Nearby sold comps map
Loading sold comps map…
Walkable amenities ~0.75 mi
Loading nearby amenities…
Taxation est. · year 1
- Rental income
- $14,108
- − Mortgage interest
- −$6,162
- − Property taxes
- −$527
- − Insurance
- −$550
- − Repairs & maintenance
- −$1,129
- − Management
- −$1,129
- − Depreciation
- −$3,200
- Taxable income
- $1,412
- Est. tax owed @ 24.0%
- −$339
- After-tax cash flow
- $2,807/yr
For passive investors: Depreciation is non-cash, so a rental often shows a tax loss while cash-flowing — sheltering income. Rental losses are passive: they offset passive income freely, and up to $25,000/yr can offset ordinary (W-2) income if you actively participate and your MAGI is under $100k (phasing out to $0 by $150k); unused losses carry forward. On sale, claimed depreciation is recaptured at up to 25%, and gains may owe capital-gains tax (a 1031 exchange can defer both). Figures are a year-1 estimate at your 24.0% rate — not tax advice; consult a CPA.
Schools (NCES district)
- District
- South Bend Community School Corporation
- NCES district ID
- 1810290
- Math proficiency
- 12% ▼ -10.00%
- Reading proficiency
- 21% ▼ -6.00%
- Median HH income
- $41,935
- Composite
- 14.21/100
- National rank
- #9452
- State rank
- #284 of 301 in IN
Livability — South Bend
- Score
- 64/100
- State rank
- #365
- US rank
- #13730
Category grades
Schools grade is shown separately in the Schools card above.
Census & demographics
- Census place
- South Bend, IN
- County
- Saint Joseph County · 189,048 people
- City population
- 99,767
- Metro
- South Bend-Mishawaka, IN-MI
- Population (ZIP)
- 27,685
- Household income
- $61,759
- Rent vs Own
- Severe rent burden
- 1024.0
Population outlook (St. Joseph County) Hauer SSP2
- Today (2025)
- 273,186 people
- By 2030
- 273,594 · +0.1%
- By 2040
- 271,641 · -0.6%
- By 2050
- 269,187 · -1.5%
- By 2075
- 263,136 · -3.7%
- By 2100
- 245,659 · -10.1%
Race, ethnicity, and origin ACS 2023
- Neighborhood character
- Diverse neighborhood (Simpson 0.60)
- Race & ethnicity
- White 55% Black 30% Hispanic / Latino 10% Two or more races 8%
- Hispanic origin (detail)
- Mexican 8%
- Common ancestry
- Romanian 12% Lithuanian 1% Slovak 1%
- Foreign-born
- 7% · Canada, China
- Languages at home
- 89% English-only · Spanish 7% Russian/Polish/Slavic 1%
Political lean MEDSL · St. Joseph
- 2024 margin
- Toss-up / Even · D 50.0% · R 48.5% · Other 1.5%
- 2008→2024 swing
- -15.6pp toward R · 2008: 17.1pp · 2024: 1.5pp
- All cycles
- 2024: D+1.5 2020: D+5.8 2016: D+0.2 2012: D+3.5 2008: D+17.1
Not yet ingested
- Civics
- —
Market trends
- HPI YoY
- ▼ -130.47%
- Current HPI
- 202.112
- Rent YoY
- ▲ 6.78%
- Metro
- South Bend-Mishawaka, IN-MI
- State GDP YoY
- ▲ 2.90%
- F500 in state
- 18
Industry mix (Fortune 500 HQ in IN)
| Industry | F500 HQs | Revenue |
|---|---|---|
| Industrial Machinery | 2 | $37B |
|
||
| Healthcare | 1 | $177B |
|
||
| Pharmaceuticals | 1 | $45B |
|
||
| Metals / Steel | 1 | $18B |
|
||
| Agriculture | 1 | $17B |
|
||
| Packaging | 1 | $12B |
|
||
Price history
-4.3% since first listed3 events — show timeline
- 2026-04-25 Pending — IRMLS
- 2026-04-13 Price Changed $109,999 IRMLS
- 2026-03-24 Listed $115,000 IRMLS
Property tax history
+0.4%/yrLatest (2023): $527 · +34.6% YoY. Source: county tax records.
Cash-flow waterfall
monthlySold comps — $/sqft
last 12 mo · ≤1 miLoading sold comps…