 Duplex
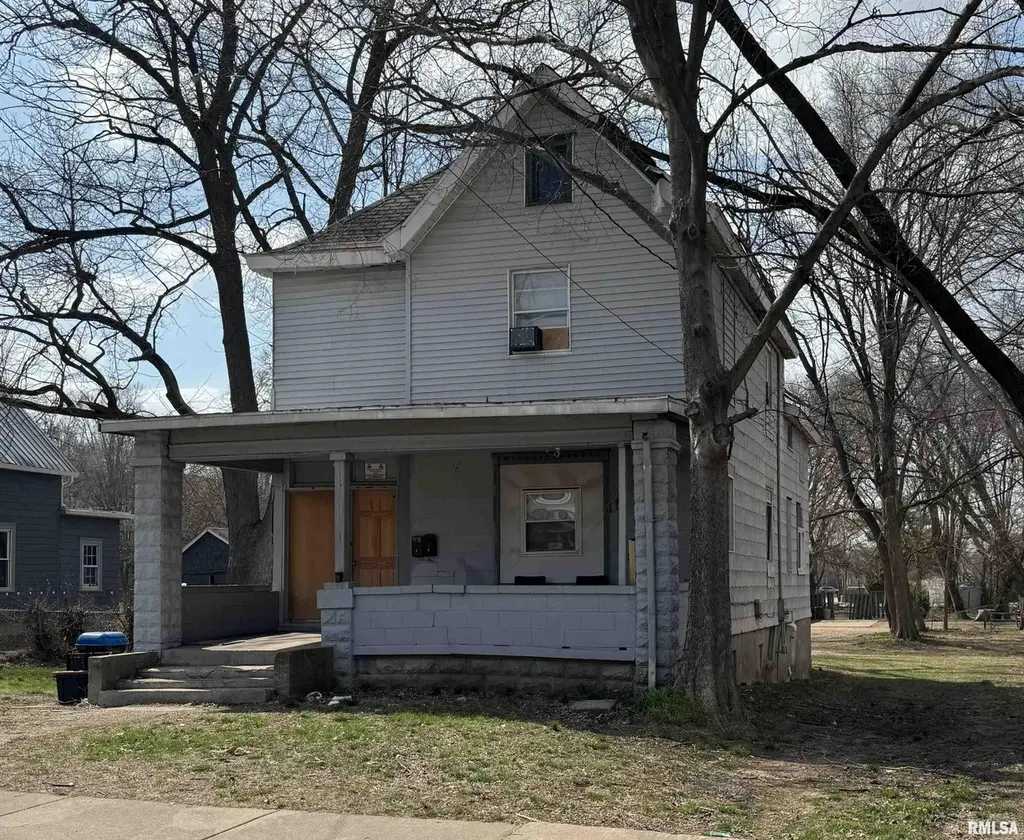
1823-1825 N Linn St · Peoria, IL
Flood risk 6/10 · Moderate
- FEMA flood zone
- X
- Chance of flooding over 30 yrs
- 0.75%
- Est. flood insurance / yr
- $473 – $860
Fire risk 1/10 · Minimal
- Est. fire insurance / yr
- $804 – $1,492
Heat risk 3/10 · Minor
- Hot days now (above 105°F)
- 7 days/yr
- Hot days in 30 yrs
- 18 days/yr
Wind risk 2/10 · Minimal
- Chance of severe wind over 30 yrs
- 1.0%
Air-quality risk 3/10 · Minor
- Unhealthy air days now
- 1 days/yr
- Unhealthy air days in 30 yrs
- 3 days/yr
Risk factors via First Street. Map © Google.
Why this score? — see what drove the C+ grade
The composite is a weighted blend of 9 inputs, each scored 0–100. Each bar is that input's sub-score; the figure is the points it added to the 100-point composite (weight × sub-score).
- Cash flow +30.0/30.0
- 1% rule +10.0/10.0
- DSCR +10.0/10.0
- Livability +3.7/5.0
- Rent growth +3.1/5.0
- Condition / age +2.5/5.0
- ARV discount +2.3/15.0
- Schools +1.1/10.0
- Appreciation +0.0/10.0
$75,000
🖨 Deal sheet (PDF) 📄 Offer letter ✓ Due diligence
Multi-family units
County records classify this as Multi-Family (2-4 Unit). Listing-text estimate: 2 units. confirmed
Listing remarks
Fully occupied duplex generating approxiately $15,600 annually. Estimated NOI $9,300. Approx. 13.67% cap rate at $79,900 Two 2 BR/1BA units Strong rental area. Furnace 4 years old Hot water heater 1 year old. South roof 4 yr old, Back roof 8 yr old. 9 new windws. Hardwood floors. Sold AS-IS Opportunity to increase rents. Improve property by building a 2 car garage. This property offers a practical and affordable investment option with a duplex layout, giving buyers the ability to create rental income, house-hack, or add a solid property to their portfolio. . With separate living spaces & strong rental demand, this property is ideal for an investor looking for cash flow and long-term
Key facts
- Strong rental demand
- Accessibility
- Nice curb appeal
Tags
Property features AI
Finance
- Other: Building area approximately 2,038 total square feet
- Financial info: Unit 1 currently rents for $600; Unit 2 currently rents for $700
Exterior
- Parking: Total of 2 parking spaces; On-street parking available; Parking pad
- Utilities: Public water; Public sewer
- Home design: Residential income property; Two-unit building
- Construction: Built in 1880
- Exterior features: Level lot; Shingle roof
Interior
- Bedrooms: Two 2-bedroom units
- Bathrooms: Two full bathrooms (one per unit)
- Heating & cooling: Forced air heating; Window unit(s) for cooling
- Interior features: Unfinished basement
Neighborhood map
What this means for you Summary
Snapshot
- This is a 2 × 2.0-bed/1.0-bath units multifamily listed at $75k.
Deal economics
- At list price, monthly cash flow is $1k ($15k/yr) — positive. Per door: $616/mo.
- The deal already cash-flows at list — no discount required.
- Meets the 1% rule at list price ($2k rent vs $75k).
- Recommended offer: $73k (3.0% below list) — sets the bar for market timing.
- Cap rate 26.0% vs local median 5.6% in Peoria — top-decile yield for the area; either an underpriced asset or a hidden risk that comps aren't pricing in. Stress-test before assuming the spread holds.
Location & tenants
- Location reads 73/100 on livability (#270 in IL) — a middle-class / working-renter tenant base. Strengths: commute A+, cost of living A+, housing A+; Watch: employment D+, crime F.
- Peoria SD 150 (urban): math 11% / reading 14% proficiency, ranked #554 of 620 in IL (top 89%) — low school quality limits family demand, transient renter base, plan for 1-2y turnover; 70% free/reduced lunch — lower-income household profile, screen leases tightly.
- Zoned schools: Peoria High School (math 4% / reading 7%, grade F, #609 of 693 statewide, top 88%, 1,447 students, 0% FRL) — zoned schools average 0% FRL vs 70% district-wide (70 pts lower); this property's tenant base skews higher-income than the district average.
- Market conditions: Rents rising (+2.3%/yr); 180 active listings in the ZIP; 1 comparable units currently listed for rent nearby; 73 units permitted in Peoria County in 2024 (0 in 5+ unit buildings).
- At $2,165/mo this rent would consume 50% of the median local household income ($52k/yr) (locally 815% of renters already pay >50% of income on rent) — very limited rent-growth headroom before tenants either downsize or default.
Forward outlook
- Local home prices are declining (-3.0%/yr); year-one equity from $519 of loan paydown is wiped out by about $2k of value loss. Plan a longer hold.
- Peoria County population projected at -11% by 2050 — secular population decline; favor cash flow + early exit over multi-decade hold.
- At projected returns (-3.0% appreciation + 2.3% rent growth), your $21k cash investment doubles in ~2 years — after that, you're playing with house money.
Negotiation context
- It's been on market 57 days — a 3% lower offer ($73k) is reasonable based on typical stale-listing flexibility.
Risks & watch-outs
- Watch-outs: built in 1880 — expect roof / HVAC / electrical / plumbing capex.
- Climate carrying-cost: major flood risk — expect insurance premiums to compound above CPI over the hold.
Questions for the listing agent
- It's been on market 57 days. Have you received any prior offers? Is the seller open to a 3% concession, seller financing, or rate buy-down credit?
- Can we see the unit-by-unit rent roll, current vacancy, and any below-market leases? What's the average tenancy length?
- What capital expenditures (roof, boiler, parking lot, exteriors) have been made in the last 5 years, and what's planned in the next 2?
- Built in 1880 — when were the roof, HVAC, electrical panel, plumbing, and water heater last replaced?
- Is there a deadline driving the sale (1031 exchange, divorce, estate, relocation)? That informs how much negotiation room exists.
- Schools are F-rated, which usually means shorter tenancies and higher turnover. Who's the typical renter profile here, and what's been the actual vacancy rate?
- Crime grade is F in this area — have there been break-ins, vandalism, or insurance claims at this property in the last 3 years? What carrier currently insures it and at what premium?
- What's the average days-on-market for RENTAL listings here right now (not sales)? A rising rental-DOM trend means longer vacancies and softer asking-rent achievability than the comps imply.
- What's the recent tenant-quality profile in this submarket — average credit score on applications, eviction rate, late-payment / NSF rate, and stable-employment percentage? A property-management company in the area should have these aggregated.
- How much new apartment / multifamily construction is in the pipeline within 1–3 miles? Heavy new supply (>2% of stock underway) typically softens rents 12–24 months out; light construction supports rent growth.
Investment metrics
- 1% rule
- 2.89% ✓
- Cap rate
- 26.01%
- Cash-on-cash
- 70.42%
- DSCR
- 4.13
- GRM
- 2.9
CMA / ARV
- ARV (on-the-fly)
- $67,254
- Comps found
- 6
Show comp detail 6 sales within ~0.75 mi
| Address | Dist | Beds/Ba | Sqft | Sold | Price | $/sf | Match |
|---|---|---|---|---|---|---|---|
| 1504 N Linn St | 0.29mi | 4/2.0 (-1) | 2,268 (+11%) | 1mo | $23,000 | $10 | 62 |
| 2315 N Sheridan Rd | 0.61mi | 4/2.0 (-1) | 1,920 (-6%) | 4mo | $50,000 | $26 | 54 |
| 1427 N Sheridan Rd | 0.52mi | 4/2.0 (-1) | 2,232 (+10%) | 3mo | $113,300 | $51 | 52 |
| 2400 N Sheridan Rd | 0.61mi | 4/2.0 (-1) | 2,156 (+6%) | 11mo | $71,000 | $33 | 47 |
| 2315 N Bigelow St | 0.42mi | 4/2.0 (-1) | 2,200 (+8%) | 23mo | $78,900 | $36 | 43 |
| 1404 N Broadway St | 0.68mi | 4/2.0 (-1) | 1,800 (-12%) | 2mo | $60,000 | $33 | 42 |
Match score weights: distance 35% · size 25% · config 20% · recency 20%. Top-matched comps best support the ARV.
Projected returns pro-forma
-3.0% appreciation · 2.3% rent growth · sell at horizon
- IRR
- 69.2%
- Equity multiple
- 4.09×
- Total profit
- $64,825
- Equity at exit
- $11,183
- IRR
- 73.1%
- Equity multiple
- 8.21×
- Total profit
- $151,414
- Equity at exit
- $6,485
Cash invested: $21,000 (down + closing). Projections, not guarantees.
Landlord ↔ Tenant lean methodology
- Overall (STATE)
- 43 Moderately Tenant-Leaning
- State Illinois
- 43 Moderately Tenant-Leaning · D+7
- County
- — inherits STATE
- City
- — inherits STATE
ZIP-level market 61604
- Home prices YoY
- -24.6%
- Rents YoY
- 2.3%
- Active inventory
- 180
- Price-to-rent
- 5.8×
Monthly cashflow live
- Estimated rent
- $2,165 high interval (Pro) →
- Mortgage (P&I)
- −$393
- Tax from tax record
- −$54 /mo · $642/yr
- Insurance
- −$31
- HOA
- −$0
- Vacancy / Maint / Mgmt
- −$455
- Net cashflow
- $1,232
Break-even live
Sensitivity live
| Price | -10% $1,275 | -5% $1,254 | +0% $1,232 | +5% $1,211 | +10% $1,190 |
|---|---|---|---|---|---|
| Rent | -10% $1,061 | -5% $1,147 | +0% $1,232 | +5% $1,318 | +10% $1,403 |
| Rate | -1.0pp $1,270 | -0.5pp $1,251 | base $1,232 | +0.5pp $1,213 | +1.0pp $1,193 |
2-unit breakdown (identical units grouped — click to expand)
| Units | Beds | Baths | Est. rent |
|---|---|---|---|
| 2× units | 2.0 | 1 | $2,166 |
| #1 | 2.0 | 1 | $1,083 |
| #2 | 2.0 | 1 | $1,083 |
| Total (2 units) | $2,165 | ||
UW: 25.0% down · 7.5% · 30yr · 1.5% tax · 5.0% vac · 8.0% maint · 8.0% mgmt
Financing live
Cash to close
- Down payment
- $18,750
- Closing costs
- $2,250
- Reserves months
- —
- Total cash needed
- —
Loan-product check · same deal, 3 products live
Conventional
25% down · 7.5% · 30yr
- Down + closing
- —
- Monthly P&I
- —
- Monthly cashflow
- —
- DSCR
- —
- Eligible?
- —
Personal DTI + credit; lowest rate.
DSCR
20% down · 8.5% · 30yr
- Down + closing
- —
- Monthly P&I
- —
- Monthly cashflow
- —
- DSCR
- —
- Eligible?
- —
No personal income docs; deal must DSCR.
Hard money
10% down · 12.0% · 12mo
- Down + closing
- —
- Monthly P&I
- —
- Monthly cashflow
- —
- DSCR
- —
- Eligible?
- —
Short-term bridge; refi at stabilization.
Rent comps 1 comps
| Address | Beds | Baths | Sqft | Rent | $/sqft | DOM | Units | Dist |
|---|---|---|---|---|---|---|---|---|
| 1806 N Peoria Ave Peoria, IL | 4.0 | 1.5 | 1668 | $894 | $0.54 | 14d | 1 | 0.26mi |
Listing history 20 events
-
2026-06-19days on market $75,000 Active 57 DOM
-
2026-06-18days on market $75,000 Active 56 DOM
-
2026-06-17days on market $75,000 Active 55 DOM
-
2026-06-16days on market $75,000 Active 54 DOM
-
2026-06-15days on market $75,000 Active 53 DOM
-
2026-06-14days on market $75,000 Active 51 DOM
-
2026-06-13days on market $75,000 Active 50 DOM
-
2026-06-10days on market $75,000 Active 48 DOM
-
2026-06-09days on market $75,000 Active 47 DOM
-
2026-06-08days on market $75,000 Active 46 DOM
-
2026-06-07days on market $75,000 Active 45 DOM
-
2026-06-03days on market $75,000 Active 41 DOM
-
2026-06-02pricedays on market $75,000 Active 40 DOM
-
2026-06-01days on market $79,900 Active 39 DOM
-
2026-05-31days on market $79,900 Active 38 DOM
-
2026-05-30days on market $79,900 Active 37 DOM
-
2026-04-27price $79,900
-
2026-04-23$85,000 Active
-
2021-08-06historical
-
2009-12-01soldstatus $330,000
ⓘ Source: listings_history table (triggers on properties + properties_extension) + one-shot
backfill from property_details.listing_events for pre-trigger history.
Tax reassessment forecast IL · Partial reset (capped growth)
- Current annual tax
- $642 · $54/mo
- Projected year-2 tax
- $1,172 · $98/mo
- Expected delta
- +$530/yr (+$44/mo · 82.5%)
ⓘ Screening estimate from a state-policy table — verify with the county assessor before closing.
Climate risk First Street
- Flood 6/10 Major FEMA zone X · 75% chance over 30 yrs
- Wildfire 1/10 Low
- Heat 3/10 Moderate 7 d/yr ≥105°F today · 18 d/yr by 30 yrs out
- Wind 2/10 Low 100% chance of damaging wind over 30 yrs
- Air quality 3/10 Moderate 1 unhealthy d/yr today · 3 by 30 yrs out
Nearby sold comps map
Loading sold comps map…
Walkable amenities ~0.75 mi
Loading nearby amenities…
Taxation est. · year 1
- Rental income
- $25,980
- − Mortgage interest
- −$4,201
- − Property taxes
- −$642
- − Insurance
- −$375
- − Repairs & maintenance
- −$2,078
- − Management
- −$2,078
- − Depreciation
- −$2,182
- Taxable income
- $14,423
- Est. tax owed @ 24.0%
- −$3,462
- After-tax cash flow
- $11,326/yr
For passive investors: Depreciation is non-cash, so a rental often shows a tax loss while cash-flowing — sheltering income. Rental losses are passive: they offset passive income freely, and up to $25,000/yr can offset ordinary (W-2) income if you actively participate and your MAGI is under $100k (phasing out to $0 by $150k); unused losses carry forward. On sale, claimed depreciation is recaptured at up to 25%, and gains may owe capital-gains tax (a 1031 exchange can defer both). Figures are a year-1 estimate at your 24.0% rate — not tax advice; consult a CPA.
Schools (NCES district)
- District
- Peoria SD 150
- NCES district ID
- 1731230
- Math proficiency
- 11% ▼ -5.00%
- Reading proficiency
- 14% ▼ -4.00%
- Median HH income
- $41,951
- Composite
- 10.92/100
- National rank
- #9751
- State rank
- #554 of 620 in IL
Livability — Peoria
- Score
- 73/100
- State rank
- #270
- US rank
- #5096
Category grades
Schools grade is shown separately in the Schools card above.
Census & demographics
- Census place
- Peoria, IL
- County
- Peoria County · 120,495 people
- City population
- 114,670
- Metro
- Peoria, IL
- Population (ZIP)
- 28,313
- Household income
- $52,414
- Rent vs Own
- Severe rent burden
- 815.0
Population outlook (Peoria County) Hauer SSP2
- Today (2025)
- 183,007 people
- By 2030
- 179,643 · -1.8%
- By 2040
- 171,782 · -6.1%
- By 2050
- 163,508 · -10.7%
- By 2075
- 140,178 · -23.4%
- By 2100
- 114,493 · -37.4%
Race, ethnicity, and origin ACS 2023
- Neighborhood character
- Diverse neighborhood (Simpson 0.61)
- Race & ethnicity
- White 55% Black 29% Two or more races 10% Hispanic / Latino 7% Asian 2%
- Hispanic origin (detail)
- Mexican 5%
- Common ancestry
- Italian 2% Slovak 1% Iranian 1%
- Foreign-born
- 6% · Canada, China
- Languages at home
- 92% English-only · Spanish 4% Chinese 1% French/Haitian/Cajun 1%
Political lean MEDSL · Peoria
- 2024 margin
- Toss-up / Even · D 51.5% · R 46.9% · Other 1.6%
- 2008→2024 swing
- -9.2pp toward R · 2008: 13.9pp · 2024: 4.7pp
- All cycles
- 2024: D+4.7 2020: D+6.3 2016: D+2.8 2012: D+4.4 2008: D+13.9
Not yet ingested
- Civics
- —
Market trends
- HPI YoY
- ▼ -54.15%
- Current HPI
- 165.8838
- Rent YoY
- ▲ 2.30%
- Metro
- Peoria, IL
- State GDP YoY
- ▲ 1.59%
- F500 in state
- 60
Industry mix (Fortune 500 HQ in IL)
| Industry | F500 HQs | Revenue |
|---|---|---|
| Insurance | 4 | $201B |
|
||
| Consumer Goods | 4 | $87B |
|
||
| Industrial Machinery | 3 | $64B |
|
||
| Healthcare | 2 | $55B |
|
||
| Retail / Pharmacy | 1 | $148B |
|
||
| Agriculture / Food | 1 | $86B |
|
||
Price history
-75.8% since first listed4 events — show timeline
- 2026-04-27 Price Changed $79,900 RMLSA as Distributed by MLS Grid
- 2026-04-23 Listed $85,000 RMLSA as Distributed by MLS Grid
- 2021-08-06 Listing Removed — RMLSA as Distributed by MLS Grid
- 2009-12-01 Sold (Public Records) $330,000 Public Records
Property tax history
+0.3%/yrLatest (2024): $642 · +4.9% YoY. Source: county tax records.
Cash-flow waterfall
monthlySold comps — $/sqft
last 12 mo · ≤1 miLoading sold comps…