12023 Greenwood Forest Dr Unit B · Houston, TX
Flood risk No data
- FEMA flood zone
- —
- Chance of flooding over 30 yrs
- —
- Est. flood insurance / yr
- —
Fire risk No data
- Est. fire insurance / yr
- —
Heat risk No data
- Hot days now (above threshold)
- —
- Hot days in 30 yrs
- —
Wind risk No data
- Chance of severe wind over 30 yrs
- —
Air-quality risk No data
- Unhealthy air days now
- —
- Unhealthy air days in 30 yrs
- —
Risk factors via First Street. Map © Google.
Why this score? — see what drove the D grade
The composite is a weighted blend of 9 inputs, each scored 0–100. Each bar is that input's sub-score; the figure is the points it added to the 100-point composite (weight × sub-score).
- Cash flow +9.6/30.0
- ARV discount +7.4/15.0
- 1% rule +5.2/10.0
- Appreciation +4.5/10.0
- Schools +4.1/10.0
- Livability +3.7/5.0
- DSCR +2.7/10.0
- Condition / age +2.5/5.0
- Rent growth +1.3/5.0
$136,500
🖨 Deal sheet 📄 Offer letter ✓ Due diligence
Listing remarks
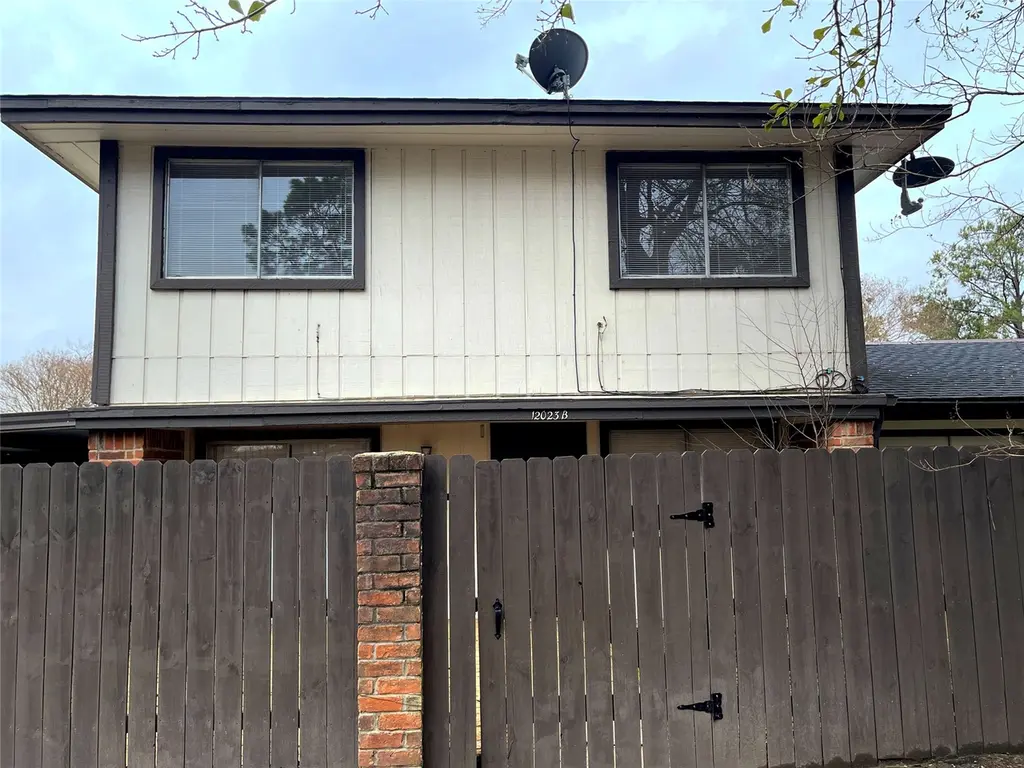
Wonderfully remodeled 3 bedroom 2 1/2 bath townhome for sale. Updates includes carpet on stairs and upstairs , fresh paint, fence and much more. One of the rare 3 bedrooms in the complex. All bedrooms up, two full baths upstairs, half bath downstairs. Great blank slate to make this home your own! Enclosed large decked patio behind private fence. Two parking spots (one covered, one uncovered), within walking distance to clubhouse, schools and pool. This makes a great starter home, forever home or investment property.
Key facts
- Remodeled
- Large decked patio
- Private fence
Tags
Property features AI
Finance
- Financial info: Lease considered
- HOA & community: Villas of Capistran HOA; Monthly association fee of $249 covering common areas, structure maintenance, and recreation facilities; Community pool
Exterior
- Parking: Carport (2 spaces); Assigned parking
- Utilities: Public water; Public sewer
- Home design: Residential property; 2 stories; Full ownership; Built in 1973; Slab foundation; Composition roof
- Construction: Brick and wood siding construction
- Exterior features: Deck; Patio; Concrete road surface
Interior
- Kitchen: Dishwasher; Electric oven; Electric range; Kitchen/Dining combo area (7x7)
- Bedrooms: Three bedrooms (two on second floor); Bedroom sizes: 9x9, 13x8, 14x11
- Flooring: Carpet; Tile
- Bathrooms: 2 full bathrooms; 1 half bathroom
- Heating & cooling: Propane heating; Central electric air conditioning
- Interior features: Ceiling fans; Kitchen/dining combo; 6 total rooms
- Laundry & utility: Electric dryer hookup
Neighborhood map
What this means for you Summary
Snapshot
- This is a 3-bed/2.5-bath condo listed at $136k.
Deal economics
- At list price, monthly cash flow is $-91 ($-1k/yr) — negative.
- To cash-flow at today's rent, offer at most $123k (9.7% below list).
- Meets the 1% rule at list price ($1k rent vs $136k).
- Recommended offer: $123k (9.7% below list) — sets the bar for cash-flow.
- Cap rate 5.5% vs local median 3.2% in Houston — top-decile yield for the area; either an underpriced asset or a hidden risk that comps aren't pricing in. Stress-test before assuming the spread holds.
Location & tenants
- Location reads 74/100 on livability (#184 in TX, #4,771 nationally) — a middle-class / working-renter tenant base. Strengths: amenities A+, cost of living A+, housing A+; Watch: crime F.
- Klein ISD (suburban): math 41% / reading 48% proficiency, ranked #213 of 826 in TX (top 26%) — families likely to look elsewhere, expect single-tenant / working-renter base with shorter leases.
- Zoned schools: Greenwood Forest El (math 30% / reading 34%, grade F, #2,268 of 4,322 statewide, top 55%, 672 students, 75% FRL); Wunderlich Int (math 24% / reading 34%, grade F, #1,103 of 1,662 statewide, top 67%, 1,316 students, 77% FRL); Klein Forest H S (math 20% / reading 28%, grade F, #1,333 of 1,632 statewide, top 82%, 3,481 students, 79% FRL) — zoned schools average 77% FRL vs 37% district-wide (40 pts higher); higher-poverty schools than district average — tighter screening recommended.
- Zoned-school proficiency averages 28% at this address vs 44% district-wide (-16 pts) — the specific schools serving this property underperform the Klein ISD average; the district grade overstates school quality for this exact location.
- Market conditions: Rents falling (-4.7%/yr); 160 active listings in the ZIP; 40 comparable units currently listed for rent nearby; rentals leasing fast (median 11d on market — plan ~1-2 weeks tenant-placement turnaround); solid renter incomes; 29,883 units permitted in Harris County in 2024 (8,621 in 5+ unit buildings).
Forward outlook
- Local home prices are declining (-1.0%/yr); year-one equity from $944 of loan paydown is wiped out by about $1k of value loss. Plan a longer hold.
- Harris County population projected at +47% by 2050 — long-run rental-demand tailwind backs the buy-and-hold thesis.
Negotiation context
- It's been on market 28 days — a 2% lower offer ($134k) is reasonable based on typical stale-listing flexibility.
- 28 sale attempts since 11y ago; this cycle's ask is 9685% above the opening price — seller raised mid-cycle; expect resistance to lowballs.
Questions for the listing agent
- What do current leases actually rent for vs. the listed asking? Can we see a recent rent roll and the last 12 months of T-12 income?
- Built in 1973 — when were the roof, HVAC, electrical panel, plumbing, and water heater last replaced?
- What does the HOA fee cover, when was the last increase, and are there any pending special assessments or reserve-fund shortfalls?
- Any open or pending special assessments — roof, HVAC, plumbing, elevator, façade? What's the per-unit balance and payoff schedule, and is the seller paying it off at close or rolling it to the buyer?
- Is there a deadline driving the sale (1031 exchange, divorce, estate, relocation)? That informs how much negotiation room exists.
- Schools are D-rated, which usually means shorter tenancies and higher turnover. Who's the typical renter profile here, and what's been the actual vacancy rate?
- Crime grade is F in this area — have there been break-ins, vandalism, or insurance claims at this property in the last 3 years? What carrier currently insures it and at what premium?
- The area grade is low — what's the realistic commute time and amenity access for the typical tenant pool here? Any planned neighborhood developments (good or bad) we should know about?
- What's the average days-on-market for RENTAL listings here right now (not sales)? A rising rental-DOM trend means longer vacancies and softer asking-rent achievability than the comps imply.
- What's the recent tenant-quality profile in this submarket — average credit score on applications, eviction rate, late-payment / NSF rate, and stable-employment percentage? A property-management company in the area should have these aggregated.
- How much new apartment / multifamily construction is in the pipeline within 1–3 miles? Heavy new supply (>2% of stock underway) typically softens rents 12–24 months out; light construction supports rent growth.
Investment metrics
- 1% rule
- 1.02% ✓
- Cap rate
- 5.49%
- Cash-on-cash
- -2.86%
- DSCR
- 0.87
- GRM
- 8.2
CMA / ARV
- ARV (median comp)
- $136,134
- List price
- $136,500
- Delta
- 2.47%
- Verdict
- FAIR
- Comps
- 20 within 1.0 mi
Projected returns pro-forma
-1.02% appreciation · 0.0% rent growth · sell at horizon
- IRR
- -12.6%
- Equity multiple
- 0.47×
- Total profit
- $-20,130
- Equity at exit
- $32,811
- IRR
- -9.4%
- Equity multiple
- 0.24×
- Total profit
- $-29,106
- Equity at exit
- $34,335
Cash invested: $38,220 (down + closing). Projections, not guarantees.
Landlord ↔ Tenant lean methodology
- Overall (STATE)
- 87 Strongly Landlord-Friendly
- State Texas
- 87 Strongly Landlord-Friendly · R+5
- County
- — inherits STATE
- City
- — inherits STATE
ZIP-level market 77066
- Home prices YoY
- -0.4%
- Rents YoY
- -4.7%
- Active inventory
- 160
- Price-to-rent
- 8.2×
Monthly cashflow live
- Estimated rent
- $1,394 high interval (Pro) →
- Mortgage (P&I)
- −$716
- Tax est. 1.5%
- −$171 /mo · $2,048/yr
- Insurance
- −$57
- HOA
- −$249
- Vacancy / Maint / Mgmt
- −$293
- Net cashflow
- $-91
Break-even live
UW: 25.0% down · 7.5% · 30yr · 1.5% tax · 5.0% vac · 8.0% maint · 8.0% mgmt
Financing live
Cash to close
- Down payment
- $34,125
- Closing costs
- $4,095
- Reserves months
- —
- Total cash needed
- —
Loan-product check · same deal, 3 products live
Conventional
25% down · 7.5% · 30yr
- Down + closing
- —
- Monthly P&I
- —
- Monthly cashflow
- —
- DSCR
- —
- Eligible?
- —
Personal DTI + credit; lowest rate.
DSCR
20% down · 8.5% · 30yr
- Down + closing
- —
- Monthly P&I
- —
- Monthly cashflow
- —
- DSCR
- —
- Eligible?
- —
No personal income docs; deal must DSCR.
Hard money
10% down · 12.0% · 12mo
- Down + closing
- —
- Monthly P&I
- —
- Monthly cashflow
- —
- DSCR
- —
- Eligible?
- —
Short-term bridge; refi at stabilization.
Rent comps 40 comps
| Address | Beds | Baths | Sqft | Rent | $/sqft | DOM | Units | Dist |
|---|---|---|---|---|---|---|---|---|
| 4202 Brandemere Way St Houston, TX | 3.0 | 2.0 | 1586 | $1,695 | $1.07 | 43d | 1 | 0.56mi |
| 13949 Bammel North Houston Rd Unit 2047 Houston, TX | 2.0 | 2.0 | 902 | $865 | $0.96 | 5d | 1 | 0.60mi |
| 13949 Bammel North Houston Rd Unit 2047 Houston, TX | 2.0 | 2.0 | 902 | $822 | $0.91 | 3d | 1 | 0.60mi |
| 13949 Bammel North Houston Rd Unit 2162 Houston, TX | 2.0 | 2.0 | 902 | $830 | $0.92 | 7d | 1 | 0.61mi |
| 4203 Stonehenge Trl Houston, TX | 3.0 | 2.0 | 1500 | $1,811 | $1.21 | 12d | 1 | 0.62mi |
| 13955 Bammel North Houston Rd Houston, TX | 2.0 | 1.0 | 914 | $980 | $1.07 | 22d | 1 | 0.66mi |
| 13955 Bammel North Houston Rd Houston, TX | 2.0 | 1.0 | 914 | $980 | $1.07 | 12d | 1 | 0.66mi |
| 12817 Greenwood Forest Dr Houston, TX | 2.0 | 2.0 | 983 | $1,020 | $1.04 | 22d | 1 | 0.67mi |
| 12817 Greenwood Forest Dr Houston, TX | 2.0 | 2.0 | 983 | $1,020 | $1.04 | 43d | 1 | 0.67mi |
| 12820 Greenwood Forest Dr Apt 420 Houston, TX | 2.0 | 2.0 | 979 | $985 | $1.01 | 15d | 1 | 0.73mi |
| 12820 Greenwood Forest Dr Apt 424 Houston, TX | 2.0 | 2.0 | 979 | $1,110 | $1.13 | 7d | 1 | 0.73mi |
| 12820 Greenwood Forest Dr Unit 3047 Houston, TX | 3.0 | 2.0 | 1458 | $1,884 | $1.29 | 3d | 1 | 0.73mi |
| 12820 Greenwood Forest Dr Unit 525 Houston, TX | 3.0 | 2.0 | 1458 | $1,852 | $1.27 | 3d | 1 | 0.73mi |
| 12820 Greenwood Forest Dr Unit 2148 Houston, TX | 2.0 | 2.0 | 979 | $1,102 | $1.13 | 3d | 1 | 0.73mi |
| 12811 Greenwood Forest Dr Houston, TX | 1.0–2.0 | 1.0–2.5 | 935 | $1,269 | $1.36 | 2d | 25 | 0.76mi |
| 12811 Greenwood Forest Dr Unit 12838 Houston, TX | 2.0 | 2.0 | 983 | $1,119 | $1.14 | 11d | 1 | 0.77mi |
| 12811 Greenwood Forest Dr Unit 422 Houston, TX | 2.0 | 2.0 | 983 | $1,095 | $1.11 | 7d | 1 | 0.77mi |
| 12811 Greenwood Forest Dr Unit 2047 Houston, TX | 2.0 | 2.0 | 983 | $1,130 | $1.15 | 11d | 1 | 0.80mi |
| 5007 Farm to Market 1960 Rd W Unit 2047 Houston, TX | 2.0 | 2.0 | 910 | $1,153 | $1.27 | 43d | 1 | 0.80mi |
| 5007 Farm to Market 1960 Rd W Houston, TX | 1.0–2.0 | 1.0–2.0 | 994 | $1,557 | $1.57 | 2d | 15 | 0.80mi |
| 31 Greenwood Forest Dr Houston, TX | 3.0 | 2.0 | 1367 | $1,733 | $1.27 | 43d | 1 | 0.83mi |
| 31 Greenwood Forest Dr Houston, TX | 2.0 | 2.0 | 1176 | $1,563 | $1.33 | 19d | 1 | 0.83mi |
| 31 Greenwood Forest Dr Houston, TX | 3.0 | 2.0 | 1367 | $1,733 | $1.27 | 19d | 1 | 0.83mi |
| 12801 Champion Forest Dr Houston, TX | 1.0–3.0 | 1.0–2.0 | 925 | $1,478 | $1.60 | 43d | 28 | 0.86mi |
| 12801 Champion Forest Dr Houston, TX | 1.0–3.0 | 1.0–2.0 | 1039 | $1,477 | $1.42 | 1d | 16 | 0.86mi |
| 5013 Farm to Market 1960 Rd W Houston, TX | 2.0 | 2.0 | 1144 | $1,549 | $1.35 | 43d | 1 | 0.88mi |
| 12407 Hosanna Way Houston, TX | 4.0 | 2.0 | 1275 | $2,200 | $1.73 | 24d | 1 | 0.88mi |
| 5106 Cypress Creek Pkwy Houston, TX | 2.0 | 2.0 | 1096 | $1,162 | $1.06 | 24d | 1 | 0.91mi |
| 5100 Farm to Market 1960 Rd W Houston, TX | 1.0–2.0 | 1.0–2.0 | 825 | $1,215 | $1.47 | 1d | 11 | 1.00mi |
| 5163 Klein Orchard Dr Houston, TX | 3.0 | 2.0 | 1544 | $2,149 | $1.39 | 43d | 1 | 1.02mi |
| 14150 Wunderlich Dr Unit 14207 Houston, TX | 2.0 | 2.0 | 956 | $1,189 | $1.24 | 11d | 1 | 1.07mi |
| 14150 Wunderlich Dr Unit 422 Houston, TX | 2.0 | 2.0 | 956 | $1,165 | $1.22 | 7d | 1 | 1.07mi |
| 14150 Wunderlich Dr Unit 425 Houston, TX | 2.0 | 2.0 | 956 | $1,157 | $1.21 | 3d | 1 | 1.07mi |
| 5965 Farm to Market 1960 Rd W Houston, TX | 2.0 | 2.0 | 1054 | $1,289 | $1.22 | 43d | 1 | 1.07mi |
| 4703 Cashel Cir Unit A Houston, TX | 3.0 | 2.5 | 1722 | $1,950 | $1.13 | 18d | 1 | 1.09mi |
| 5959 Farm to Market 1960 Rd W Unit 2112 Houston, TX | 2.0 | 2.0 | 880 | $1,048 | $1.19 | 2d | 1 | 1.17mi |
| 5959 Farm to Market 1960 Rd W Unit 6016 Houston, TX | 2.0 | 2.0 | 880 | $1,145 | $1.30 | 12d | 1 | 1.17mi |
| 5959 Farm to Market 1960 Rd W Unit 424 Houston, TX | 2.0 | 2.0 | 880 | $1,056 | $1.20 | 5d | 1 | 1.17mi |
| 5959 Farm to Market 1960 Rd W Apt 422 Houston, TX | 2.0 | 2.0 | 880 | $1,056 | $1.20 | 7d | 1 | 1.17mi |
| 5959 Farm to Market 1960 Rd W Unit 2174 Houston, TX | 2.0 | 2.0 | 880 | $1,080 | $1.23 | 10d | 1 | 1.17mi |
HOA detail condo
- Monthly dues
- $249 · $2,988/yr
- Likely covers
- pool
- Assessments
- None detected in remarks — confirm with the listing agent.
Listing history 50 events
-
2026-06-18days on market $136,500 Active 28 DOM
-
2026-06-17days on market $136,500 Active 27 DOM
-
2026-06-16days on market $136,500 Active 26 DOM
-
2026-06-15days on market $136,500 Active 25 DOM
-
2026-06-13days on market $136,500 Active 23 DOM
-
2026-06-09days on market $136,500 Active 19 DOM
-
2026-06-08days on market $136,500 Active 18 DOM
-
2026-06-07days on market $136,500 Active 17 DOM
-
2026-06-04days on market $136,500 Active 14 DOM
-
2026-06-03days on market $136,500 Active 13 DOM
-
2026-06-02days on market $136,500 Active 12 DOM
-
2026-06-01days on market $136,500 Active 11 DOM
-
2026-05-31days on market $136,500 Active 10 DOM
-
2026-04-10$1,395
-
2026-04-09historical $1,395
-
2026-04-09$139,500 Active 528-char remark
-
2026-04-09historical
-
2026-02-24$1,395
-
2026-02-23$139,500 Active
-
2026-02-23historical
-
2026-02-02$143,900 Active
-
2026-02-02historical
-
2025-12-20$143,900 Active
-
2025-12-20historical
-
2025-11-05$143,900 Active
-
2025-11-05historical
-
2025-09-10$144,900 Active
-
2025-09-10historical
-
2025-08-05price $145,000
-
2025-07-31$150,000 Active
-
2025-07-31historical
-
2025-06-18$150,000 Active
-
2025-06-18historical
-
2025-04-16$150,000 Active
-
2025-04-16historical
-
2025-02-22$150,000 Active
-
2023-12-07historical $1,250
-
2023-12-06historical
-
2023-12-01price $145,000
-
2023-11-21price $1,250
-
2023-11-16$1,375
-
2023-11-01$149,900 Active
-
2023-11-01historical
-
2023-10-24historical $1,375
-
2023-10-14$1,375
-
2023-09-29price $149,900
-
2023-09-12$159,500 Active
-
2023-09-12historical
-
2023-07-14$159,500 Active
-
2023-07-14historical
ⓘ Source: listings_history table (triggers on properties + properties_extension) + one-shot
backfill from property_details.listing_events for pre-trigger history.
Nearby sold comps map
Loading sold comps map…
Walkable amenities ~0.75 mi
Loading nearby amenities…
Taxation est. · year 1
- Rental income
- $16,725
- − Mortgage interest
- −$7,646
- − Property taxes
- −$2,048
- − Insurance
- −$682
- − Repairs & maintenance
- −$1,338
- − Management
- −$1,338
- − HOA
- −$2,988
- − Depreciation
- −$3,971
- Taxable loss
- −$3,286
- Est. tax savings @ 24.0%
- +$789
- After-tax cash flow
- $-306/yr
For passive investors: Depreciation is non-cash, so a rental often shows a tax loss while cash-flowing — sheltering income. Rental losses are passive: they offset passive income freely, and up to $25,000/yr can offset ordinary (W-2) income if you actively participate and your MAGI is under $100k (phasing out to $0 by $150k); unused losses carry forward. On sale, claimed depreciation is recaptured at up to 25%, and gains may owe capital-gains tax (a 1031 exchange can defer both). Figures are a year-1 estimate at your 24.0% rate — not tax advice; consult a CPA.
Schools (NCES district)
- District
- Klein ISD
- NCES district ID
- 4825740
- Math proficiency
- 41% ▼ -12.00%
- Reading proficiency
- 48% ▼ -3.00%
- Median HH income
- $78,288
- Composite
- 40.91/100
- National rank
- #3615
- State rank
- #213 of 826 in TX
Livability — Houston
- Score
- 74/100
- State rank
- #184
- US rank
- #4771
Category grades
Schools grade is shown separately in the Schools card above.
Census & demographics
- County
- Harris County · 4,702,590 people
- City population
- 3,226,434
- Metro
- Houston-The Woodlands-Sugar Land, TX
- Population (ZIP)
- 39,311
- Household income
- $87,138
- Rent vs Own
- Severe rent burden
- 815.0
Population outlook (Harris County) Hauer SSP2
- Today (2025)
- 5,571,493 people
- By 2030
- 6,089,821 · +9.3%
- By 2040
- 7,142,806 · +28.2%
- By 2050
- 8,185,864 · +46.9%
- By 2075
- 10,574,329 · +89.8%
- By 2100
- 12,109,958 · +117.4%
Race, ethnicity, and origin ACS 2023
- Neighborhood character
- Diverse neighborhood (Simpson 0.69)
- Race & ethnicity
- Hispanic / Latino 47% Black 23% Two or more races 21% Asian 15% White 13%
- Hispanic origin (detail)
- Mexican 32%
- Common ancestry
- Romanian 1%
- Foreign-born
- 31% · Canada, Vietnam, Jamaica
- Languages at home
- 49% English-only · Spanish 36% Vietnamese 8% Other Asian/Pacific 2%
Political lean MEDSL · Harris
- 2024 margin
- Lean D (+5.5) · D 52.0% · R 46.4% · Other 1.6%
- 2008→2024 swing
- +3.9pp toward D · 2008: 1.6pp · 2024: 5.5pp
- All cycles
- 2024: D+5.5 2020: D+13.3 2016: D+12.4 2012: D+0.1 2008: D+1.6
Not yet ingested
- Civics
- —
Market trends
- HPI YoY
- ▼ -1.02%
- Current HPI
- 261.1086
- Rent YoY
- ▼ -4.69%
- Metro
- Houston-The Woodlands-Sugar Land, TX
- State GDP YoY
- ▲ 3.95%
- F500 in state
- 110
Industry mix (Fortune 500 HQ in TX)
| Industry | F500 HQs | Revenue |
|---|---|---|
| Energy | 16 | $1,198B |
|
||
| Technology | 5 | $198B |
|
||
| Engineering / Construction | 4 | $72B |
|
||
| Energy Services | 3 | $60B |
|
||
| Utilities | 3 | $41B |
|
||
| Healthcare | 2 | $330B |
|
||
Price history
-98.4% since first listed62 events — show timeline
- 2026-06-02 Listed for Rent $1,395 HARMLS
- 2026-06-01 Rental Removed $1,395 HARMLS
- 2026-05-21 Listing Removed — HARMLS
- 2026-05-21 Listed $136,500 HARMLS
- 2026-04-10 Listed for Rent $1,395 HARMLS
- 2026-04-09 Rental Removed $1,395 HARMLS
- 2026-04-09 Listing Removed — HARMLS
- 2026-04-09 Listed $139,500 HARMLS
- 2026-02-24 Listed for Rent $1,395 HARMLS
- 2026-02-23 Listing Removed — HARMLS
- 2026-02-23 Listed $139,500 HARMLS
- 2026-02-02 Listing Removed — HARMLS
- 2026-02-02 Listed $143,900 HARMLS
- 2025-12-20 Listing Removed — HARMLS
- 2025-12-20 Listed $143,900 HARMLS
- 2025-11-05 Listing Removed — HARMLS
- 2025-11-05 Listed $143,900 HARMLS
- 2025-09-10 Listing Removed — HARMLS
- 2025-09-10 Listed $144,900 HARMLS
- 2025-08-05 Price Changed $145,000 HARMLS
- 2025-07-31 Listing Removed — HARMLS
- 2025-07-31 Listed $150,000 HARMLS
- 2025-06-18 Listing Removed — HARMLS
- 2025-06-18 Listed $150,000 HARMLS
- 2025-04-16 Listing Removed — HARMLS
- 2025-04-16 Listed $150,000 HARMLS
- 2025-02-22 Listed $150,000 HARMLS
- 2023-12-07 Rental Removed $1,250 HARMLS
- 2023-12-06 Listing Removed — HARMLS
- 2023-12-01 Price Changed $145,000 HARMLS
- 2023-11-21 Price Changed $1,250 HARMLS
- 2023-11-16 Listed for Rent $1,375 HARMLS
- 2023-11-01 Listing Removed — HARMLS
- 2023-11-01 Listed $149,900 HARMLS
- 2023-10-24 Rental Removed $1,375 HARMLS
- 2023-10-14 Listed for Rent $1,375 HARMLS
- 2023-09-29 Price Changed $149,900 HARMLS
- 2023-09-12 Listing Removed — HARMLS
- 2023-09-12 Listed $159,500 HARMLS
- 2023-07-14 Listing Removed — HARMLS
- 2023-07-14 Listed $159,500 HARMLS
- 2023-05-05 Listing Removed — HARMLS
- 2023-05-05 Listed $159,500 HARMLS
- 2023-03-16 Listed $159,500 HARMLS
- 2023-03-15 Listing Removed — HARMLS
- 2022-12-30 Listed $159,500 HARMLS
- 2018-03-21 Listing Removed — HARMLS
- 2018-02-10 Price Changed $87,995 HARMLS
- 2018-02-09 Listing Removed — HARMLS
- 2018-02-09 Listed $87,995 HARMLS
- 2017-12-22 Listing Removed — HARMLS
- 2017-12-22 Listed $89,995 HARMLS
- 2017-10-23 Listed $89,995 HARMLS
- 2017-10-23 Listing Removed — HARMLS
- 2017-07-17 Price Changed $89,995 HARMLS
- 2017-06-22 Listed $96,500 HARMLS
- 2017-06-22 Listing Removed — HARMLS
- 2017-03-31 Price Changed $96,500 HARMLS
- 2016-12-09 Listed $99,500 HARMLS
- 2016-01-07 Listing Removed — HARMLS
- 2015-12-30 Price Changed $84,900 HARMLS
- 2015-09-22 Listed $87,500 HARMLS
Cash-flow waterfall
monthlySold comps — $/sqft
last 12 mo · ≤1 miLoading sold comps…