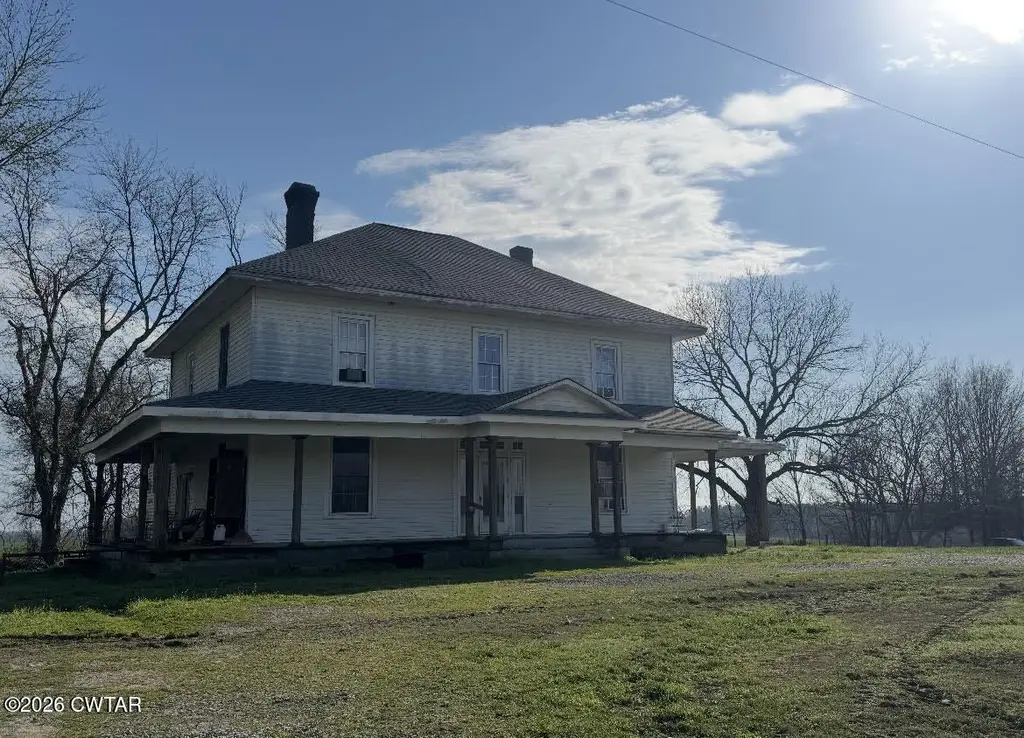
571 Bells Chapel Rd · Yorkville, TN
Flood risk 1/10 · Minimal
- FEMA flood zone
- X (unshaded)
- Chance of flooding over 30 yrs
- 0.0%
- Est. flood insurance / yr
- $507 – $1,088
Fire risk 1/10 · Minimal
- Est. fire insurance / yr
- $949 – $1,763
Heat risk 5/10 · Moderate
- Hot days now (above 107°F)
- 7 days/yr
- Hot days in 30 yrs
- 21 days/yr
Wind risk 4/10 · Minor
- Chance of severe wind over 30 yrs
- 13.0%
Air-quality risk 2/10 · Minimal
- Unhealthy air days now
- 0 days/yr
- Unhealthy air days in 30 yrs
- 1 days/yr
Risk factors via First Street. Map © Google.
Why this score? — see what drove the B grade
The composite is a weighted blend of 9 inputs, each scored 0–100. Each bar is that input's sub-score; the figure is the points it added to the 100-point composite (weight × sub-score).
- Cash flow +30.0/30.0
- DSCR +10.0/10.0
- 1% rule +9.2/10.0
- ARV discount +7.5/15.0
- Appreciation +5.8/10.0
- Schools +3.7/10.0
- Livability +3.0/5.0
- Rent growth +2.5/5.0
- Condition / age +2.5/5.0
$90,500
🖨 Deal sheet (PDF) 📄 Offer letter ✓ Due diligence
Listing remarks
Investor special with endless potential! Situated on a spacious lot in Gibson County, this property offers a great opportunity for buyers looking to renovate, flip, or create their dream home. The existing structure provides a solid footprint with over 2,800 square feet, ready for your vision and updates. Surrounded by peaceful rural scenery, yet conveniently located near Dyer, this property combines privacy with accessibility. With the right improvements, this home could truly shine. Being sold as-is—bring your tools and imagination! Don't miss this chance to unlock its full value. Call Brad Lindsey @ 731-414-2318
Key facts
- 3 parking spots
- Built 1942
- Listed 87 days
Property features AI
Finance
- Financial info: Annual tax amount approximately $663.77
Exterior
- Parking: Three parking spaces
- Home design: Two-story single-family residence; Residential property
- Exterior features: Lot with approximate dimensions 210 x 205 x 210 x 208
Interior
- Bathrooms: Two full bathrooms; One main-level bathroom
- Interior features: Has a double-sided wood-burning fireplace; Nine total rooms
Neighborhood map
What this means for you Summary
Snapshot
- This is a 3-bed/2.0-bath single-family listed at $90k.
Deal economics
- At list price, monthly cash flow is $448 ($5k/yr) — positive.
- The deal already cash-flows at list — no discount required.
- Meets the 1% rule at list price ($1k rent vs $90k).
- Recommended offer: $85k (6.0% below list) — sets the bar for market timing.
Location & tenants
- Location reads 60/100 on livability (#273 in TN) — a middle-class / working-renter tenant base. Strengths: cost of living A+, housing A+; Watch: health & safety C-, crime F, amenities F.
- Gibson County Sp District (rural): math 47% / reading 39% proficiency, ranked #11 of 139 in TN (top 8%) — families likely to look elsewhere, expect single-tenant / working-renter base with shorter leases.
- Zoned schools: Yorkville Elementary (math 42% / reading 27%, grade F, #319 of 952 statewide, top 37%, 134 students, 0% FRL); South Gibson County Middle School (math 58% / reading 42%, grade C, #20 of 333 statewide, top 6%, 800 students, 0% FRL); Gibson County High School (math 27% / reading 37%, grade F, #56 of 332 statewide, top 20%, 449 students, 0% FRL) — zoned schools average 0% FRL vs 33% district-wide (33 pts lower); this property's tenant base skews higher-income than the district average.
- Market conditions: 28 active listings in the ZIP; 155 units permitted in Gibson County in 2024 (0 in 5+ unit buildings).
Forward outlook
- In year one you build about $2k of equity ($626 loan paydown + $1k appreciation (1.6% local appreciation)).
- Gibson County population projected to shrink 8% by 2050 — rents likely to lag national; underwrite the cash flow, not the appreciation.
- At projected returns (1.6% appreciation + 3.0% rent growth), your $25k cash investment doubles in ~4 years — after that, you're playing with house money.
Negotiation context
- It's been on market 87 days — a 6% lower offer ($85k) is reasonable based on typical stale-listing flexibility.
Risks & watch-outs
- Watch-outs: built in 1942 — expect roof / HVAC / electrical / plumbing capex.
- Climate carrying-cost: extreme-heat days projected 7→21/yr by 2055 (HVAC capex compounding) — expect insurance premiums to compound above CPI over the hold.
Questions for the listing agent
- It's been on market 87 days. Have you received any prior offers? Is the seller open to a 6% concession, seller financing, or rate buy-down credit?
- Built in 1942 — when were the roof, HVAC, electrical panel, plumbing, and water heater last replaced?
- Why hasn't it sold? Are there any deal-killer items the seller is aware of (foundation, flood, title, zoning, code violations)?
- Is there a deadline driving the sale (1031 exchange, divorce, estate, relocation)? That informs how much negotiation room exists.
- Schools are D-rated, which usually means shorter tenancies and higher turnover. Who's the typical renter profile here, and what's been the actual vacancy rate?
- Crime grade is F in this area — have there been break-ins, vandalism, or insurance claims at this property in the last 3 years? What carrier currently insures it and at what premium?
- What's the average days-on-market for RENTAL listings here right now (not sales)? A rising rental-DOM trend means longer vacancies and softer asking-rent achievability than the comps imply.
- What's the recent tenant-quality profile in this submarket — average credit score on applications, eviction rate, late-payment / NSF rate, and stable-employment percentage? A property-management company in the area should have these aggregated.
- How much new for-sale + rental construction is in the pipeline within 1–3 miles? Heavy new supply typically softens prices + rents 12–24 months out; constrained supply supports both.
Investment metrics
- 1% rule
- 1.42% ✓
- Cap rate
- 12.24%
- Cash-on-cash
- 21.23%
- DSCR
- 1.94
- GRM
- 5.9
CMA / ARV
No comps found within radius.
Projected returns pro-forma
1.58% appreciation · 3.0% rent growth · sell at horizon
- IRR
- 24.6%
- Equity multiple
- 2.30×
- Total profit
- $32,825
- Equity at exit
- $33,652
- IRR
- 26.7%
- Equity multiple
- 4.38×
- Total profit
- $85,555
- Equity at exit
- $46,935
Cash invested: $25,340 (down + closing). Projections, not guarantees.
Landlord ↔ Tenant lean methodology
- Overall (STATE)
- 87 Strongly Landlord-Friendly
- State Tennessee
- 87 Strongly Landlord-Friendly · R+13
- County
- — inherits STATE
- City
- — inherits STATE
ZIP-level market 38330
- Home prices YoY
- 0.9%
- Active inventory
- 28
- Price-to-rent
- 5.9×
Monthly cashflow live
- Estimated rent
- $1,286 medium interval (Pro) →
- Mortgage (P&I)
- −$475
- Tax from tax record
- −$55 /mo · $664/yr
- Insurance
- −$38
- HOA
- −$0
- Vacancy / Maint / Mgmt
- −$270
- Net cashflow
- $448
Break-even live
Sensitivity live
| Price | -10% $500 | -5% $474 | +0% $448 | +5% $423 | +10% $397 |
|---|---|---|---|---|---|
| Rent | -10% $347 | -5% $398 | +0% $448 | +5% $499 | +10% $550 |
| Rate | -1.0pp $494 | -0.5pp $471 | base $448 | +0.5pp $425 | +1.0pp $401 |
UW: 25.0% down · 7.5% · 30yr · 1.5% tax · 5.0% vac · 8.0% maint · 8.0% mgmt
Financing live
Cash to close
- Down payment
- $22,625
- Closing costs
- $2,715
- Reserves months
- —
- Total cash needed
- —
Loan-product check · same deal, 3 products live
Conventional
25% down · 7.5% · 30yr
- Down + closing
- —
- Monthly P&I
- —
- Monthly cashflow
- —
- DSCR
- —
- Eligible?
- —
Personal DTI + credit; lowest rate.
DSCR
20% down · 8.5% · 30yr
- Down + closing
- —
- Monthly P&I
- —
- Monthly cashflow
- —
- DSCR
- —
- Eligible?
- —
No personal income docs; deal must DSCR.
Hard money
10% down · 12.0% · 12mo
- Down + closing
- —
- Monthly P&I
- —
- Monthly cashflow
- —
- DSCR
- —
- Eligible?
- —
Short-term bridge; refi at stabilization.
Listing history 17 events
-
2026-06-21days on market $90,500 Active 87 DOM
-
2026-06-21days on market $90,500 Active 86 DOM
-
2026-06-18days on market $90,500 Active 84 DOM
-
2026-06-17days on market $90,500 Active 83 DOM
-
2026-06-16days on market $90,500 Active 82 DOM
-
2026-06-15days on market $90,500 Active 81 DOM
-
2026-06-13days on market $90,500 Active 79 DOM
-
2026-06-12days on market $90,500 Active 78 DOM
-
2026-06-09days on market $90,500 Active 75 DOM
-
2026-06-08days on market $90,500 Active 74 DOM
-
2026-06-08days on market $90,500 Active 73 DOM
-
2026-06-07pricedays on market $90,500 Active 72 DOM
-
2026-06-03days on market $97,500 Active 69 DOM
-
2026-06-02days on market $97,500 Active 68 DOM
-
2026-06-01days on market $97,500 Active 67 DOM
-
2026-05-31days on market $97,500 Active 66 DOM
-
2026-03-25$97,500 Active
ⓘ Source: listings_history table (triggers on properties + properties_extension) + one-shot
backfill from property_details.listing_events for pre-trigger history.
Tax reassessment forecast TN · Resets to sale price
- Current annual tax
- $664 · $55/mo
- Projected year-2 tax
- $664 · $55/mo
- Expected delta
- $0/yr ($0/mo · 0.0%)
ⓘ Screening estimate from a state-policy table — verify with the county assessor before closing.
Climate risk First Street
- Flood 1/10 Low FEMA zone X (unshaded) · 0% chance over 30 yrs
- Wildfire 1/10 Low
- Heat 5/10 Major 7 d/yr ≥107°F today · 21 d/yr by 30 yrs out
- Wind 4/10 Moderate 13% chance of damaging wind over 30 yrs
- Air quality 2/10 Low 0 unhealthy d/yr today · 1 by 30 yrs out
Nearby sold comps map
Loading sold comps map…
Walkable amenities ~0.75 mi
Loading nearby amenities…
Taxation est. · year 1
- Rental income
- $15,433
- − Mortgage interest
- −$5,069
- − Property taxes
- −$664
- − Insurance
- −$452
- − Repairs & maintenance
- −$1,235
- − Management
- −$1,235
- − Depreciation
- −$2,633
- Taxable income
- $4,145
- Est. tax owed @ 24.0%
- −$995
- After-tax cash flow
- $4,386/yr
For passive investors: Depreciation is non-cash, so a rental often shows a tax loss while cash-flowing — sheltering income. Rental losses are passive: they offset passive income freely, and up to $25,000/yr can offset ordinary (W-2) income if you actively participate and your MAGI is under $100k (phasing out to $0 by $150k); unused losses carry forward. On sale, claimed depreciation is recaptured at up to 25%, and gains may owe capital-gains tax (a 1031 exchange can defer both). Figures are a year-1 estimate at your 24.0% rate — not tax advice; consult a CPA.
Schools (NCES district)
- District
- Gibson County Sp District
- NCES district ID
- 4701400
- Math proficiency
- 47% ▼ -13.00%
- Reading proficiency
- 39% ▼ -5.00%
- Median HH income
- $47,868
- Composite
- 36.82/100
- National rank
- #4565
- State rank
- #11 of 139 in TN
Livability — Yorkville
- Score
- 60/100
- State rank
- #273
- US rank
- #19262
Category grades
Schools grade is shown separately in the Schools card above.
Census & demographics
- City population
- 40
- Population (ZIP)
- 3,938
Population outlook (Gibson County) Hauer SSP2
- Today (2025)
- 48,793 people
- By 2030
- 48,221 · -1.2%
- By 2040
- 46,793 · -4.1%
- By 2050
- 44,909 · -8.0%
- By 2075
- 40,191 · -17.6%
- By 2100
- 33,574 · -31.2%
Race, ethnicity, and origin ACS 2023
- Neighborhood character
- Predominantly White (76%)
- Race & ethnicity
- White 76% Black 12% Two or more races 11% Hispanic / Latino 3%
- Common ancestry
- Romanian 4% Serbian 2% Lithuanian 1%
- Foreign-born
- 0%
- Languages at home
- 99% English-only · Spanish 1%
Political lean MEDSL · Gibson
- 2024 margin
- Solid R (+52.0) · D 23.6% · R 75.5%
- 2008→2024 swing
- -23.2pp toward R · 2008: -28.8pp · 2024: -52.0pp
- All cycles
- 2024: R+52.0 2020: R+47.0 2016: R+43.8 2012: R+32.1 2008: R+28.8
Not yet ingested
- Civics
- —
Market trends
- HPI YoY
- ▲ 1.58%
- Current HPI
- 184.9194
- Rent YoY
- —
- Metro
- —
- State GDP YoY
- ▲ 2.78%
- F500 in state
- 22
Industry mix (Fortune 500 HQ in TN)
| Industry | F500 HQs | Revenue |
|---|---|---|
| Healthcare | 3 | $91B |
|
||
| Retail | 3 | $72B |
|
||
| Transportation / Logistics | 1 | $88B |
|
||
| Paper / Packaging | 1 | $19B |
|
||
| Insurance | 1 | $13B |
|
||
| Energy | 1 | $12B |
|
||
Price history
1 event — show timeline
- 2026-03-25 Listed $97,500 CWTAR
Property tax history
+2.1%/yrLatest (2025): $664 · -17.7% YoY. Source: county tax records.
Cash-flow waterfall
monthlySold comps — $/sqft
last 12 mo · ≤1 miLoading sold comps…