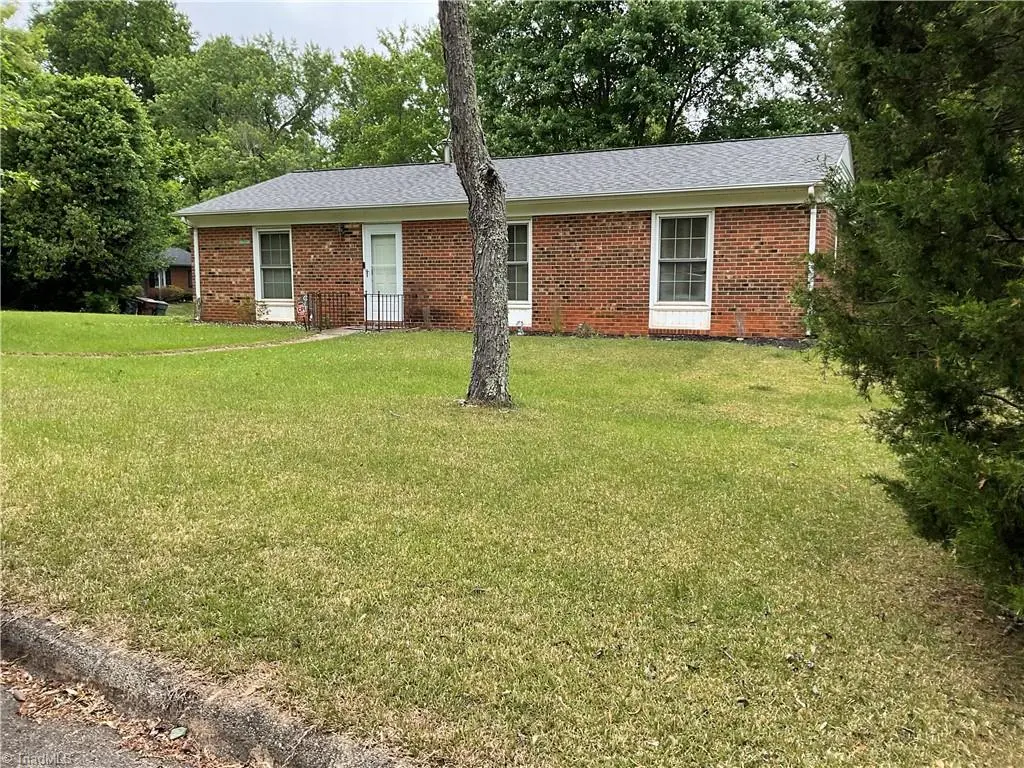
1 Tilley Ct · Greensboro, NC
Flood risk 1/10 · Minimal
- FEMA flood zone
- X (unshaded)
- Chance of flooding over 30 yrs
- 0.0%
- Est. flood insurance / yr
- $507 – $1,088
Fire risk 1/10 · Minimal
- Est. fire insurance / yr
- $906 – $1,684
Heat risk 5/10 · Moderate
- Hot days now (above 103°F)
- 7 days/yr
- Hot days in 30 yrs
- 18 days/yr
Wind risk 4/10 · Minor
- Chance of severe wind over 30 yrs
- 16.0%
Air-quality risk 2/10 · Minimal
- Unhealthy air days now
- 1 days/yr
- Unhealthy air days in 30 yrs
- 2 days/yr
Risk factors via First Street. Map © Google.
Why this score? — see what drove the B- grade
The composite is a weighted blend of 9 inputs, each scored 0–100. Each bar is that input's sub-score; the figure is the points it added to the 100-point composite (weight × sub-score).
- Cash flow +22.7/30.0
- ARV discount +15.0/15.0
- DSCR +7.3/10.0
- 1% rule +5.1/10.0
- Appreciation +5.0/10.0
- Livability +4.0/5.0
- Schools +3.6/10.0
- Rent growth +2.5/5.0
- Condition / age +2.5/5.0
$150,000
🖨 Deal sheet (PDF) 📄 Offer letter ✓ Due diligence
Listing remarks
This 4 bedroom, i 1/2 bath need some tender loving care. Conveniently located near the highway and bus line. An investor could put their skills to work. The owners are in the process of moving. Everything will be cleared within a week. To be SOLD AS IS!!!!
Key facts
- 0.23 acre lot
- Built 1973
- Listed 8 days
Property features AI
Finance
- Other: Located in the Summit Hills subdivision; Directions: North on Summit Ave, Right on Ludwick, Left on Vincent, Right on Tilley Ct
- HOA & community: No homeowners association (association listed as 'Greensboro' but association not active)
Exterior
- Parking: Driveway parking
- Utilities: Public sewer; Gas water heater
- Home design: Single-story house; Stick/site-built residential structure; Built in 1973; Existing structure
- Construction: Brick and vinyl siding exterior; Slab foundation
- Exterior features: Lot roughly 0.23 acres with irregular dimensions (83 x 113 x 92 x 117); Public-maintained road frontage; Public water source; No pool
Interior
- Bathrooms: One full bathroom; One half bathroom
- Heating & cooling: Forced-air heating (natural gas); No central cooling listed
- Interior features: Primary bedroom on the main level; Five total rooms
Neighborhood map
What this means for you Summary
Snapshot
- This is a 4-bed/1.5-bath single-family listed at $150k.
Deal economics
- At list price, monthly cash flow is $257 ($3k/yr) — positive.
- The deal already cash-flows at list — no discount required.
- Meets the 1% rule at list price ($2k rent vs $150k).
- Cap rate 8.3% vs local median 3.7% in Greensboro — top-decile yield for the area; either an underpriced asset or a hidden risk that comps aren't pricing in. Stress-test before assuming the spread holds.
Location & tenants
- Location reads 81/100 on livability (#12 in NC, #1,335 nationally) — a professional / high-income tenant draw. Strengths: amenities A+, commute A+, cost of living A+; Watch: employment D, crime F.
- Guilford County Schools (urban): math 39% / reading 45% proficiency, ranked #99 of 178 in NC (top 56%) — families likely to look elsewhere, expect single-tenant / working-renter base with shorter leases.
- Zoned schools: Brightwood Elementary (math 23% / reading 25%, grade F, #1,153 of 1,410 statewide, top 82%, 516 students, 99% FRL); Northeast Guilford Middle (math 15% / reading 26%, grade F, #427 of 475 statewide, top 90%, 780 students, 100% FRL); Northeast Guilford High (math 27% / reading 37%, grade F, #445 of 535 statewide, top 84%, 959 students, 100% FRL) — zoned schools average 99% FRL vs 52% district-wide (47 pts higher); higher-poverty schools than district average — tighter screening recommended.
- Zoned-school proficiency averages 26% at this address vs 42% district-wide (-16 pts) — the specific schools serving this property underperform the Guilford County Schools average; the district grade overstates school quality for this exact location.
- Market conditions: 1 active listings in the ZIP; 12 comparable units currently listed for rent nearby; rentals at typical pace (median 25d on market — plan ~3-4 weeks tenant-placement turnaround); 3,843 units permitted in Guilford County in 2024 (2,397 in 5+ unit buildings).
Forward outlook
- In year one you build about $6k of equity ($1k loan paydown + $4k appreciation (3.0% local appreciation)).
- Guilford County population projected at +26% by 2050 — long-run rental-demand tailwind backs the buy-and-hold thesis.
- At projected returns (3.0% appreciation + 3.0% rent growth), your $42k cash investment doubles in ~5 years — after that, you're playing with house money.
- By year 7, paydown + projected appreciation supports a ~$35k cash-out refi (75% LTV) — recoverable capital for the next deal without selling this one.
Negotiation context
- Only 8 days on market — expect competitive offers; lowballing is unlikely to land.
- Current owner paid $24k; list at $150k implies a 534% gain — meaningful room to come down on a strong offer.
Risks & watch-outs
- Climate carrying-cost: extreme-heat days projected 7→18/yr by 2055 (HVAC capex compounding) — expect insurance premiums to compound above CPI over the hold.
Questions for the listing agent
- Built in 1973 — when were the roof, HVAC, electrical panel, plumbing, and water heater last replaced?
- Is there a deadline driving the sale (1031 exchange, divorce, estate, relocation)? That informs how much negotiation room exists.
- Crime grade is F in this area — have there been break-ins, vandalism, or insurance claims at this property in the last 3 years? What carrier currently insures it and at what premium?
- What's the average days-on-market for RENTAL listings here right now (not sales)? A rising rental-DOM trend means longer vacancies and softer asking-rent achievability than the comps imply.
- What's the recent tenant-quality profile in this submarket — average credit score on applications, eviction rate, late-payment / NSF rate, and stable-employment percentage? A property-management company in the area should have these aggregated.
- How much new for-sale + rental construction is in the pipeline within 1–3 miles? Heavy new supply typically softens prices + rents 12–24 months out; constrained supply supports both.
Investment metrics
- 1% rule
- 1.01% ✓
- Cap rate
- 8.35%
- Cash-on-cash
- 7.34%
- DSCR
- 1.33
- GRM
- 8.2
CMA / ARV
- ARV (on-the-fly)
- $248,838
- Comps found
- 12
Show comp detail 12 sales within ~0.75 mi
| Address | Dist | Beds/Ba | Sqft | Sold | Price | $/sf | Match |
|---|---|---|---|---|---|---|---|
| 3708 Murchie St | 0.32mi | 3/1.5 (-1) | 1,255 (+1%) | 1mo | $214,525 | $171 | 77 |
| 4402 Southern Webbing Mill Rd | 0.15mi | 3/2.0 (-1) | 1,240 (+0%) | 12mo | $255,000 | $206 | 76 |
| 4507 Holland Rd | 0.30mi | 3/2.0 (-1) | 1,262 (+2%) | 1mo | $260,000 | $206 | 75 |
| 1718 Fern Hill Dr | 0.55mi | 3/2.0 (-1) | 1,240 (+0%) | 7mo | $202,000 | $163 | 61 |
| 4003 Martin Ave | 0.53mi | 3/2.0 (-1) | 1,248 (+1%) | 9mo | $219,900 | $176 | 60 |
| 4614 Southern Webbing Mill Rd | 0.27mi | 3/2.0 (-1) | 1,116 (-10%) | 8mo | $225,000 | $202 | 57 |
| 4803 Troxler Rd | 0.60mi | 3/2.5 (-1) | 1,238 (0%) | 9mo | $249,000 | $201 | 56 |
| 4530 Holland Rd | 0.35mi | 3/2.0 (-1) | 1,078 (-13%) | 6mo | $212,000 | $197 | 50 |
| 3562 Cherry Ln | 0.69mi | 3/2.0 (-1) | 1,125 (-9%) | 1mo | $259,999 | $231 | 45 |
| 1806 Glenside Dr | 0.60mi | 3/2.0 (-1) | 1,104 (-11%) | 3mo | $225,000 | $204 | 45 |
| 4102 Pineneedle Dr | 0.66mi | 3/2.0 (-1) | 1,356 (+10%) | 5mo | $218,900 | $161 | 42 |
| 9 Jans Ct | 0.55mi | 3/2.0 (-1) | 1,407 (+14%) | 6mo | $245,000 | $174 | 39 |
Match score weights: distance 35% · size 25% · config 20% · recency 20%. Top-matched comps best support the ARV.
Projected returns pro-forma
3.0% appreciation · 3.0% rent growth · sell at horizon
- IRR
- 14.3%
- Equity multiple
- 1.82×
- Total profit
- $34,389
- Equity at exit
- $67,446
- IRR
- 16.1%
- Equity multiple
- 3.37×
- Total profit
- $99,482
- Equity at exit
- $103,943
Cash invested: $42,000 (down + closing). Projections, not guarantees.
Landlord ↔ Tenant lean methodology
- Overall (STATE)
- 85 Strongly Landlord-Friendly
- State North Carolina
- 85 Strongly Landlord-Friendly · R+3
- County
- — inherits STATE
- City
- — inherits STATE
ZIP-level market 27402
- Active inventory
- 1
- Price-to-rent
- 8.2×
Monthly cashflow live
- Estimated rent
- $1,522 high interval (Pro) →
- Mortgage (P&I)
- −$787
- Tax from tax record
- −$97 /mo · $1,158/yr
- Insurance
- −$62
- HOA
- −$0
- Vacancy / Maint / Mgmt
- −$320
- Net cashflow
- $257
Break-even live
Sensitivity live
| Price | -10% $342 | -5% $299 | +0% $257 | +5% $214 | +10% $172 |
|---|---|---|---|---|---|
| Rent | -10% $136 | -5% $197 | +0% $257 | +5% $317 | +10% $377 |
| Rate | -1.0pp $332 | -0.5pp $295 | base $257 | +0.5pp $218 | +1.0pp $178 |
UW: 25.0% down · 7.5% · 30yr · 1.5% tax · 5.0% vac · 8.0% maint · 8.0% mgmt
Financing live
Cash to close
- Down payment
- $37,500
- Closing costs
- $4,500
- Reserves months
- —
- Total cash needed
- —
Loan-product check · same deal, 3 products live
Conventional
25% down · 7.5% · 30yr
- Down + closing
- —
- Monthly P&I
- —
- Monthly cashflow
- —
- DSCR
- —
- Eligible?
- —
Personal DTI + credit; lowest rate.
DSCR
20% down · 8.5% · 30yr
- Down + closing
- —
- Monthly P&I
- —
- Monthly cashflow
- —
- DSCR
- —
- Eligible?
- —
No personal income docs; deal must DSCR.
Hard money
10% down · 12.0% · 12mo
- Down + closing
- —
- Monthly P&I
- —
- Monthly cashflow
- —
- DSCR
- —
- Eligible?
- —
Short-term bridge; refi at stabilization.
Rent comps 12 comps
| Address | Beds | Baths | Sqft | Rent | $/sqft | DOM | Units | Dist |
|---|---|---|---|---|---|---|---|---|
| 1811 Cody Ave Greensboro, NC | 3.0 | 2.0 | 1200 | $1,600 | $1.33 | 20d | 1 | 0.33mi |
| 1811 Cody Ave Greensboro, NC | 3.0 | 2.0 | 1200 | $1,600 | $1.33 | 25d | 1 | 0.33mi |
| 2008 Glenside Dr Greensboro, NC | 3.0 | 1.5 | 1040 | $1,600 | $1.54 | 25d | 1 | 0.56mi |
| 1631 Glenside Dr Greensboro, NC | 1.0–3.0 | 1.0–1.5 | 888 | $1,099 | $1.24 | 16d | 3 | 0.78mi |
| 1631 Glenside Dr Greensboro, NC | 3.0 | 1.5 | 1200 | $1,099 | $0.92 | 25d | 1 | 0.78mi |
| 2100 Parks St Greensboro, NC | 4.0 | 2.0 | 1187 | $1,710 | $1.44 | 20d | 1 | 0.82mi |
| 3409 N O.Henry Blvd Greensboro, NC | 2.0–3.0 | 1.0–1.5 | 925 | $1,475 | $1.59 | 16d | 6 | 0.88mi |
| 3206 Spring St Greensboro, NC | 4.0 | 2.0 | 1200 | $1,500 | $1.25 | 23d | 1 | 1.11mi |
| 4100 US Highway 29 N Greensboro, NC | 1.0–3.0 | 1.0–2.0 | 928 | $1,529 | $1.65 | 25d | 1 | 1.24mi |
| 3128 Utah Pl Greensboro, NC | 1.0–3.0 | 1.0–2.0 | 1076 | $1,375 | $1.28 | 25d | 6 | 1.31mi |
| 1373 Lees Chapel Rd Greensboro, NC | 1.0–3.0 | 1.0–2.0 | 975 | $1,471 | $1.51 | 16d | 19 | 1.37mi |
| 109 Lemon Ln Greensboro, NC | 3.0 | 3.0 | 1418 | $2,000 | $1.41 | 25d | 1 | 1.39mi |
Listing history 3 events
-
2026-05-19status Pending
-
2026-05-11$150,000 Active
-
1977-06-01soldstatus $23,669
ⓘ Source: listings_history table (triggers on properties + properties_extension) + one-shot
backfill from property_details.listing_events for pre-trigger history.
Tax reassessment forecast NC · Resets to sale price
- Current annual tax
- $1,158 · $97/mo
- Projected year-2 tax
- $1,230 · $102/mo
- Expected delta
- +$72/yr (+$6/mo · 6.2%)
ⓘ Screening estimate from a state-policy table — verify with the county assessor before closing.
Climate risk First Street
- Flood 1/10 Low FEMA zone X (unshaded) · 0% chance over 30 yrs
- Wildfire 1/10 Low
- Heat 5/10 Major 7 d/yr ≥103°F today · 18 d/yr by 30 yrs out
- Wind 4/10 Moderate 16% chance of damaging wind over 30 yrs
- Air quality 2/10 Low 1 unhealthy d/yr today · 2 by 30 yrs out
Nearby sold comps map
Loading sold comps map…
Walkable amenities ~0.75 mi
Loading nearby amenities…
Taxation est. · year 1
- Rental income
- $18,264
- − Mortgage interest
- −$8,402
- − Property taxes
- −$1,158
- − Insurance
- −$750
- − Repairs & maintenance
- −$1,461
- − Management
- −$1,461
- − Depreciation
- −$4,364
- Taxable income
- $667
- Est. tax owed @ 24.0%
- −$160
- After-tax cash flow
- $2,921/yr
For passive investors: Depreciation is non-cash, so a rental often shows a tax loss while cash-flowing — sheltering income. Rental losses are passive: they offset passive income freely, and up to $25,000/yr can offset ordinary (W-2) income if you actively participate and your MAGI is under $100k (phasing out to $0 by $150k); unused losses carry forward. On sale, claimed depreciation is recaptured at up to 25%, and gains may owe capital-gains tax (a 1031 exchange can defer both). Figures are a year-1 estimate at your 24.0% rate — not tax advice; consult a CPA.
Schools (NCES district)
- District
- Guilford County Schools
- NCES district ID
- 3701920
- Math proficiency
- 39% ▲ 1.00%
- Reading proficiency
- 45% ▲ 1.00%
- Median HH income
- $46,315
- Composite
- 35.78/100
- National rank
- #4842
- State rank
- #99 of 178 in NC
Livability — Greensboro
- Score
- 81/100
- State rank
- #12
- US rank
- #1335
Category grades
Schools grade is shown separately in the Schools card above.
Census & demographics
- Census place
- Greensboro, NC
Population outlook (Guilford County) Hauer SSP2
- Today (2025)
- 584,596 people
- By 2030
- 616,851 · +5.5%
- By 2040
- 678,451 · +16.1%
- By 2050
- 734,788 · +25.7%
- By 2075
- 862,985 · +47.6%
- By 2100
- 948,704 · +62.3%
Not yet ingested
- Political lean
- —
- Race & ethnicity
- —
- Common origin
- —
- Civics
- —
Market trends
- HPI YoY
- —
- Current HPI
- —
- Rent YoY
- —
- Metro
- —
- State GDP YoY
- ▲ 3.28%
- F500 in state
- 26
Industry mix (Fortune 500 HQ in NC)
| Industry | F500 HQs | Revenue |
|---|---|---|
| Financial Services | 2 | $213B |
|
||
| Retail | 2 | $95B |
|
||
| Industrial Conglomerate | 1 | $38B |
|
||
| Metals / Steel | 1 | $35B |
|
||
| Utilities | 1 | $30B |
|
||
| Industrial Machinery | 1 | $19B |
|
||
Price history
+533.7% since first listed3 events — show timeline
- 2026-05-19 Pending — Triad MLS
- 2026-05-11 Listed $150,000 Triad MLS
- 1977-06-01 Sold (Public Records) $23,669 Public Records
Property tax history
+0.9%/yrLatest (2025): $1,158 · -1.0% YoY. Source: county tax records.
Cash-flow waterfall
monthlySold comps — $/sqft
last 12 mo · ≤1 miLoading sold comps…