12910 Cattle Rustler Rd · Mustang Ridge, TX
Flood risk 1/10 · Minimal
- FEMA flood zone
- X (unshaded)
- Chance of flooding over 30 yrs
- 0.0%
- Est. flood insurance / yr
- $507 – $1,088
Fire risk 6/10 · Moderate
- Est. fire insurance / yr
- $1,222 – $2,270
Heat risk 8/10 · Major
- Hot days now (above 108°F)
- 7 days/yr
- Hot days in 30 yrs
- 22 days/yr
Wind risk 8/10 · Major
- Chance of severe wind over 30 yrs
- 80.0%
Air-quality risk 1/10 · Minimal
- Unhealthy air days now
- 0 days/yr
- Unhealthy air days in 30 yrs
- 0 days/yr
Risk factors via First Street. Map © Google.
Why this score? — see what drove the D- grade
The composite is a weighted blend of 9 inputs, each scored 0–100. Each bar is that input's sub-score; the figure is the points it added to the 100-point composite (weight × sub-score).
- ARV discount +15.0/15.0
- Cash flow +8.1/30.0
- Livability +3.2/5.0
- 1% rule +2.8/10.0
- Condition / age +2.5/5.0
- DSCR +2.2/10.0
- Rent growth +2.1/5.0
- Schools +1.9/10.0
- Appreciation +0.0/10.0
$290,990
🖨 Deal sheet (PDF) 📄 Offer letter ✓ Due diligence
Listing remarks
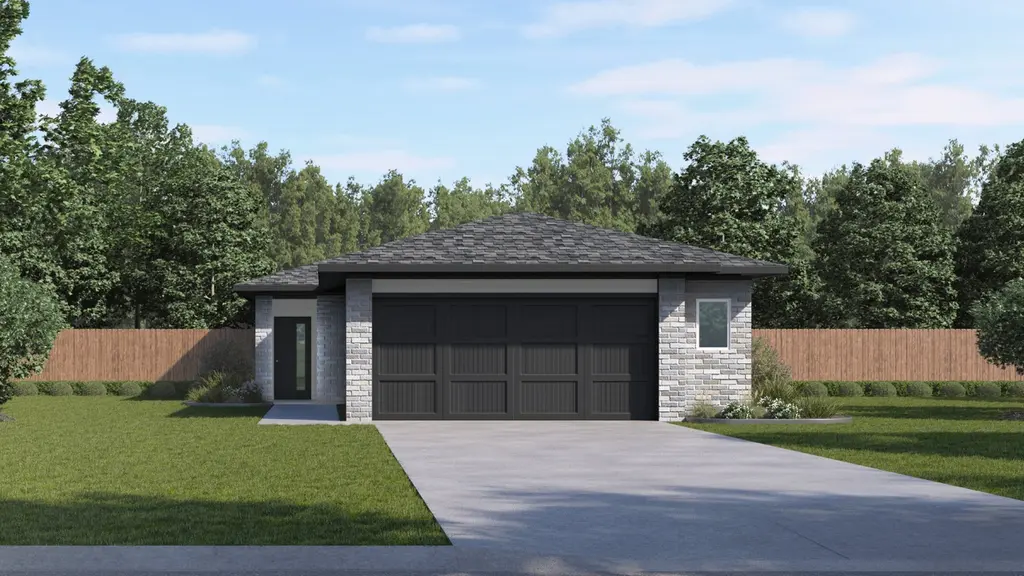
NEW COMMUNITY! NOW SELLING. Images representative of plan only and may vary when built. The Yellowstone II is a beautifully designed single-story home that masterfully maximizes its 1,670 square feet to accommodate 4 bedrooms and 2 bathrooms. This layout is a dream for those who love to host, as the home's heart features an oversized kitchen island that stays completely open to the dining and family rooms. The kitchen itself is a blend of style and high-end function, boasting elegant quartz countertops, a timeless tile backsplash, and premium stainless steel appliances that make every meal feel special. Privacy is at the forefront of the Yellowstone II’s design. The main bedroom is a
Key facts
- Large walk-in shower
- 4,791 sq ft lot
- 2 garage spots
Tags
Property features AI
Finance
- HOA & community: Homeowners association (Frontier) with monthly fee of $57; HOA covers common area maintenance; Community amenities include common grounds, playground, park, pool, sport courts, street lights, sidewalks and trails/paths
Exterior
- Parking: Attached garage facing front; Two covered parking spaces (garage)
- Security: Smoke detectors
- Utilities: Cable available; Electricity available; Natural gas available and connected; Water available (private); Private sewer (connected); Underground utilities
- Home design: Single-story new construction; Built by D.R. Horton; Southeast-facing; Slab foundation
- Construction: Brick construction; Composition shingle roof; Radiant barrier; New construction
- Exterior features: Private yard; Covered front porch and patio; Fenced backyard; Sprinklers in front, rear and side with rain sensor; Landscaped yard with small trees; Community pool
Interior
- Kitchen: Built-in range; Range; Microwave; Dishwasher; Disposal; Exhaust/vented fan; Refrigerator; Stainless steel appliances; Kitchen island; Pantry; Quartz countertops
- Bedrooms: Four main-level bedrooms; Main level primary bedroom
- Flooring: Carpet; Vinyl
- Bathrooms: Two full bathrooms; Double vanity in bath
- Heating & cooling: Central heating (natural gas); Central air conditioning
- Interior features: Open floorplan; Entrance foyer; Recessed lighting; Smart home features; Double vanity; Kitchen island; Pantry; Quartz counters; Walk-in closets; Double pane vinyl windows with screens
- Laundry & utility: Main-level laundry room; Gas dryer hookup
Neighborhood map
What this means for you Summary
Snapshot
- This is a 4-bed/2.0-bath single-family listed at $291k.
Deal economics
- At list price, monthly cash flow is $-280 ($-3k/yr) — negative.
- To cash-flow at today's rent, offer at most $250k (13.9% below list).
- To meet the 1% rule (rent ≥ 1% of price), the offer needs to be $226k (22.2% below list).
- Recommended offer: $226k (22.2% below list) — sets the bar for 1% rule.
- Cap rate 5.1% vs local median 4.3% in Mustang Ridge — meaningfully above typical; check what's discounted (condition, days-on-market, listing class) to confirm the premium yield is real.
Location & tenants
- Location reads 63/100 on livability (#854 in TX) — a middle-class / working-renter tenant base. Strengths: crime A+, employment A+, cost of living A+; Watch: schools F, amenities F, commute F.
- Del Valle ISD (rural): math 19% / reading 26% proficiency, ranked #749 of 826 in TX (top 91%) — low school quality limits family demand, transient renter base, plan for 1-2y turnover; 77% free/reduced lunch — lower-income household profile, screen leases tightly.
- Market conditions: Rents soft (-1.8%/yr); 1006 active listings in the ZIP; 6 comparable units currently listed for rent nearby; rentals at typical pace (median 18d on market — plan ~3-4 weeks tenant-placement turnaround); high-income renter base; 17,121 units permitted in Travis County in 2024 (11,963 in 5+ unit buildings).
Forward outlook
- Local home prices are declining (-3.0%/yr); year-one equity from $2k of loan paydown is wiped out by about $9k of value loss. Plan a longer hold.
- Travis County population projected at +60% by 2050 — long-run rental-demand tailwind backs the buy-and-hold thesis.
Negotiation context
- It's been on market 59 days — a 3% lower offer ($282k) is reasonable based on typical stale-listing flexibility.
Risks & watch-outs
- Climate carrying-cost: severe wind risk, 80% chance of damaging wind over 30y; major wildfire risk; extreme-heat days projected 7→22/yr by 2055 (HVAC capex compounding) — expect insurance premiums to compound above CPI over the hold.
Questions for the listing agent
- What do current leases actually rent for vs. the listed asking? Can we see a recent rent roll and the last 12 months of T-12 income?
- It's been on market 59 days. Have you received any prior offers? Is the seller open to a 22% concession, seller financing, or rate buy-down credit?
- What does the HOA fee cover, when was the last increase, and are there any pending special assessments or reserve-fund shortfalls?
- Is there a deadline driving the sale (1031 exchange, divorce, estate, relocation)? That informs how much negotiation room exists.
- Schools are F-rated, which usually means shorter tenancies and higher turnover. Who's the typical renter profile here, and what's been the actual vacancy rate?
- The area grade is low — what's the realistic commute time and amenity access for the typical tenant pool here? Any planned neighborhood developments (good or bad) we should know about?
- What's the average days-on-market for RENTAL listings here right now (not sales)? A rising rental-DOM trend means longer vacancies and softer asking-rent achievability than the comps imply.
- What's the recent tenant-quality profile in this submarket — average credit score on applications, eviction rate, late-payment / NSF rate, and stable-employment percentage? A property-management company in the area should have these aggregated.
- How much new for-sale + rental construction is in the pipeline within 1–3 miles? Heavy new supply typically softens prices + rents 12–24 months out; constrained supply supports both.
Investment metrics
- 1% rule
- 0.78% ✗
- Cap rate
- 5.14%
- Cash-on-cash
- -4.13%
- DSCR
- 0.82
- GRM
- 10.7
CMA / ARV
- ARV (median comp)
- $350,396
- List price
- $290,990
- Delta
- -16.95%
- Verdict
- UNDERPRICED
- Comps
- 10 within 1.0 mi
Show comp detail 1 sale within ~0.75 mi
| Address | Dist | Beds/Ba | Sqft | Sold | Price | $/sf | Match |
|---|---|---|---|---|---|---|---|
| 8562 Old Lockhart Hwy | 0.25mi | 4/2.5 | 1,848 (+11%) | 20mo | $365,000 | $198 | 52 |
Match score weights: distance 35% · size 25% · config 20% · recency 20%. Top-matched comps best support the ARV.
Projected returns pro-forma
-3.0% appreciation · 0.0% rent growth · sell at horizon
- IRR
- -26.7%
- Equity multiple
- 0.12×
- Total profit
- $-71,561
- Equity at exit
- $43,388
- IRR
- -39.7%
- Equity multiple
- -0.36×
- Total profit
- $-110,642
- Equity at exit
- $25,159
Cash invested: $81,477 (down + closing). Projections, not guarantees.
Landlord ↔ Tenant lean methodology
- Overall (STATE)
- 87 Strongly Landlord-Friendly
- State Texas
- 87 Strongly Landlord-Friendly · R+5
- County
- — inherits STATE
- City
- — inherits STATE
ZIP-level market 78610
- Rents YoY
- -1.8%
- Active inventory
- 1006
- Price-to-rent
- 10.7×
Monthly cashflow live
- Estimated rent
- $2,263 high interval (Pro) →
- Mortgage (P&I)
- −$1,526
- Tax est. 1.5%
- −$364 /mo · $4,365/yr
- Insurance
- −$121
- HOA
- −$57
- Vacancy / Maint / Mgmt
- −$475
- Net cashflow
- $-280
Break-even live
Sensitivity live
| Price | -10% $-79 | -5% $-180 | +0% $-280 | +5% $-381 | +10% $-481 |
|---|---|---|---|---|---|
| Rent | -10% $-459 | -5% $-370 | +0% $-280 | +5% $-191 | +10% $-101 |
| Rate | -1.0pp $-134 | -0.5pp $-206 | base $-280 | +0.5pp $-356 | +1.0pp $-432 |
UW: 25.0% down · 7.5% · 30yr · 1.5% tax · 5.0% vac · 8.0% maint · 8.0% mgmt
Financing live
Cash to close
- Down payment
- $72,748
- Closing costs
- $8,730
- Reserves months
- —
- Total cash needed
- —
Loan-product check · same deal, 3 products live
Conventional
25% down · 7.5% · 30yr
- Down + closing
- —
- Monthly P&I
- —
- Monthly cashflow
- —
- DSCR
- —
- Eligible?
- —
Personal DTI + credit; lowest rate.
DSCR
20% down · 8.5% · 30yr
- Down + closing
- —
- Monthly P&I
- —
- Monthly cashflow
- —
- DSCR
- —
- Eligible?
- —
No personal income docs; deal must DSCR.
Hard money
10% down · 12.0% · 12mo
- Down + closing
- —
- Monthly P&I
- —
- Monthly cashflow
- —
- DSCR
- —
- Eligible?
- —
Short-term bridge; refi at stabilization.
Rent comps 6 comps
| Address | Beds | Baths | Sqft | Rent | $/sqft | DOM | Units | Dist |
|---|---|---|---|---|---|---|---|---|
| 12104 Douglas Fir Cir Buda, TX | 3.0 | 2.0 | 1276 | $2,100 | $1.65 | 19d | 1 | 1.14mi |
| 12102 Douglas Fir Cir Buda, TX | 3.0 | 2.0 | 1470 | $2,200 | $1.50 | 3d | 1 | 1.15mi |
| 12309 Mustang Mesa Dr Buda, TX | 4.0 | 2.0 | 1568 | $1,790 | $1.14 | 17d | 1 | 1.30mi |
| 13405 Grays Peak Path Buda, TX | 4.0 | 2.0 | 1600 | $2,199 | $1.37 | 3d | 1 | 1.33mi |
| 13405 Grays Peak Path Buda, TX | 4.0 | 2.0 | 1600 | $2,100 | $1.31 | 45d | 1 | 1.34mi |
| 6915 Tiznow Ln Buda, TX | 3.0 | 2.5 | 1845 | $2,300 | $1.25 | 3d | 1 | 1.37mi |
HOA detail
- Monthly dues
- $57 · $684/yr
Listing history 16 events
-
2026-06-21days on market $290,990 Active 59 DOM
-
2026-06-18days on market $290,990 Active 56 DOM
-
2026-06-17days on market $290,990 Active 55 DOM
-
2026-06-16days on market $290,990 Active 54 DOM
-
2026-06-15days on market $290,990 Active 53 DOM
-
2026-06-13days on market $290,990 Active 51 DOM
-
2026-06-09days on market $290,990 Active 47 DOM
-
2026-06-08days on market $290,990 Active 46 DOM
-
2026-06-07days on market $290,990 Active 45 DOM
-
2026-06-04days on market $290,990 Active 42 DOM
-
2026-06-03days on market $290,990 Active 41 DOM
-
2026-06-02days on market $290,990 Active 40 DOM
-
2026-06-01days on market $290,990 Active 39 DOM
-
2026-05-31days on market $290,990 Active 38 DOM
-
2026-05-14price $290,990 1991-char remark
-
2026-04-23$286,990 Active 1991-char remark
ⓘ Source: listings_history table (triggers on properties + properties_extension) + one-shot
backfill from property_details.listing_events for pre-trigger history.
Climate risk First Street
- Flood 1/10 Low FEMA zone X (unshaded) · 0% chance over 30 yrs
- Wildfire 6/10 Major
- Heat 8/10 Severe 7 d/yr ≥108°F today · 22 d/yr by 30 yrs out
- Wind 8/10 Severe 80% chance of damaging wind over 30 yrs
- Air quality 1/10 Low 0 unhealthy d/yr today · 0 by 30 yrs out
Nearby sold comps map
Loading sold comps map…
Walkable amenities ~0.75 mi
Loading nearby amenities…
Taxation est. · year 1
- Rental income
- $27,156
- − Mortgage interest
- −$16,300
- − Property taxes
- −$4,365
- − Insurance
- −$1,455
- − Repairs & maintenance
- −$2,172
- − Management
- −$2,172
- − HOA
- −$684
- − Depreciation
- −$8,465
- Taxable loss
- −$8,458
- Est. tax savings @ 24.0%
- +$2,030
- After-tax cash flow
- $-1,332/yr
For passive investors: Depreciation is non-cash, so a rental often shows a tax loss while cash-flowing — sheltering income. Rental losses are passive: they offset passive income freely, and up to $25,000/yr can offset ordinary (W-2) income if you actively participate and your MAGI is under $100k (phasing out to $0 by $150k); unused losses carry forward. On sale, claimed depreciation is recaptured at up to 25%, and gains may owe capital-gains tax (a 1031 exchange can defer both). Figures are a year-1 estimate at your 24.0% rate — not tax advice; consult a CPA.
Schools (NCES district)
- District
- Del Valle ISD
- NCES district ID
- 4816620
- Math proficiency
- 19% ▼ -13.00%
- Reading proficiency
- 26% ▼ -2.00%
- Median HH income
- $41,322
- Composite
- 19.13/100
- National rank
- #8830
- State rank
- #749 of 826 in TX
Livability — Mustang Ridge
- Score
- 63/100
- State rank
- #854
- US rank
- #15380
Category grades
Schools grade is shown separately in the Schools card above.
Census & demographics
- Census place
- Mustang Ridge, TX
- County
- Hays County · 280,138 people
- Metro
- Austin-Round Rock-Georgetown, TX
- Population (ZIP)
- 48,319
- Household income
- $119,698
- Rent vs Own
- Severe rent burden
- 611.0
Population outlook (Travis County) Hauer SSP2
- Today (2025)
- 1,545,133 people
- By 2030
- 1,729,269 · +11.9%
- By 2040
- 2,097,596 · +35.8%
- By 2050
- 2,463,890 · +59.5%
- By 2075
- 3,249,374 · +110.3%
- By 2100
- 3,801,868 · +146.1%
Race, ethnicity, and origin ACS 2023
- Neighborhood character
- Diverse neighborhood (Simpson 0.58)
- Race & ethnicity
- White 49% Hispanic / Latino 42% Two or more races 17% Black 4% Asian 2%
- Hispanic origin (detail)
- Mexican 35%
- Common ancestry
- Italian 2% Romanian 2% Lithuanian 2%
- Foreign-born
- 10% · Canada, Jamaica, South Korea
- Languages at home
- 76% English-only · Spanish 20% Arabic 2% Other Indo-European 1%
Political lean MEDSL · Travis
- 2024 margin
- Solid D (+39.3) · D 68.8% · R 29.4% · Other 1.8%
- 2008→2024 swing
- +9.9pp toward D · 2008: 29.4pp · 2024: 39.3pp
- All cycles
- 2024: D+39.3 2020: D+45.0 2016: D+38.9 2012: D+23.9 2008: D+29.4
Not yet ingested
- Civics
- —
Market trends
- HPI YoY
- ▼ -161.50%
- Current HPI
- 220.6824
- Rent YoY
- ▼ -1.80%
- Metro
- Austin-Round Rock-Georgetown, TX
- State GDP YoY
- ▲ 3.95%
- F500 in state
- 110
Industry mix (Fortune 500 HQ in TX)
| Industry | F500 HQs | Revenue |
|---|---|---|
| Energy | 16 | $1,198B |
|
||
| Technology | 5 | $198B |
|
||
| Engineering / Construction | 4 | $72B |
|
||
| Energy Services | 3 | $60B |
|
||
| Utilities | 3 | $41B |
|
||
| Healthcare | 2 | $330B |
|
||
Price history
+1.4% since first listed2 events — show timeline
- 2026-05-14 Price Changed $290,990 Unlock MLS
- 2026-04-23 Listed $286,990 Unlock MLS
Cash-flow waterfall
monthlySold comps — $/sqft
last 12 mo · ≤1 miLoading sold comps…