6309 Sandpiper Ln · Wylie, TX
Flood risk No data
- FEMA flood zone
- —
- Chance of flooding over 30 yrs
- —
- Est. flood insurance / yr
- —
Fire risk No data
- Est. fire insurance / yr
- —
Heat risk No data
- Hot days now (above threshold)
- —
- Hot days in 30 yrs
- —
Wind risk No data
- Chance of severe wind over 30 yrs
- —
Air-quality risk No data
- Unhealthy air days now
- —
- Unhealthy air days in 30 yrs
- —
Risk factors via First Street. Map © Google.
Why this score? — see what drove the C grade
The composite is a weighted blend of 9 inputs, each scored 0–100. Each bar is that input's sub-score; the figure is the points it added to the 100-point composite (weight × sub-score).
- Cash flow +18.9/30.0
- ARV discount +15.0/15.0
- DSCR +6.0/10.0
- 1% rule +5.1/10.0
- Schools +4.2/10.0
- Condition / age +4.0/5.0
- Livability +3.5/5.0
- Rent growth +2.2/5.0
- Appreciation +0.0/10.0
$200,899
🖨 Deal sheet 📄 Offer letter ✓ Due diligence
Listing remarks
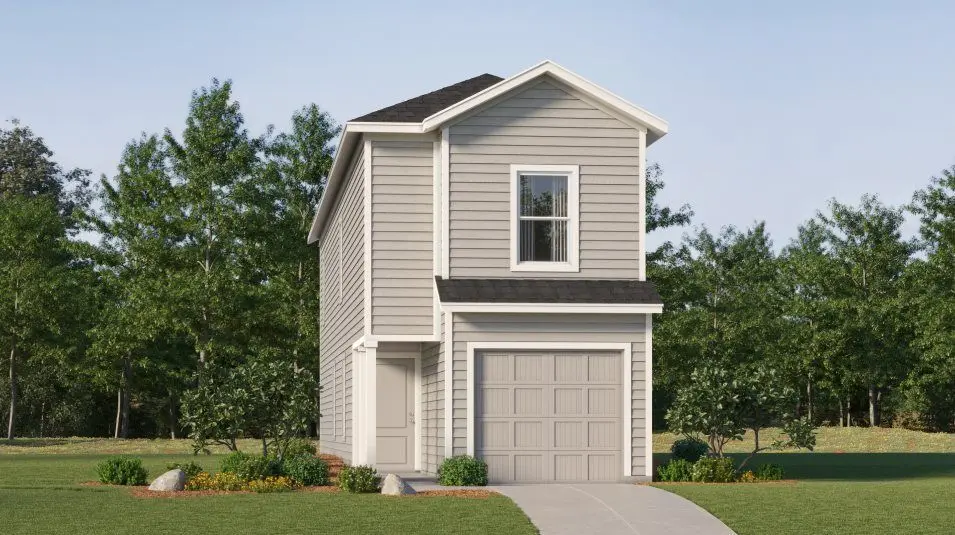
The first floor of this two-story home is host to an open floorplan that combines a fully-equipped kitchen with the living and dining areas to maximize the footprint of the home. There are four bedrooms located upstairs, including the luxe owner's suite, which is positioned at the back of the home for enhanced privacy and comfort.
Key facts
- Luxe owner's suite
- Open floorplan
- Enhanced privacy
Tags
Property features AI
Finance
- Other: Located at 6309 Sandpiper Ln, Princeton TX 75407
- Financial info: List price $200,899
Exterior
- Home design: Single-family home (Cibola plan); Active new-construction listing
- Construction: New construction (spec); Plan name: Cibola
- Exterior features: Living area approximately 1535 (interior size provided)
Interior
- Bedrooms: 4 bedrooms
- Bathrooms: 2 full bathrooms and 1 half bathroom (2.5 total)
- Interior features: Spec new construction (Cibola plan)
Neighborhood map
What this means for you Summary
Snapshot
- This is a 4-bed/2.5-bath single-family listed at $201k. Condition is rated good.
Deal economics
- At list price, monthly cash flow is $207 ($2k/yr) — positive.
- The deal already cash-flows at list — no discount required.
- Meets the 1% rule at list price ($2k rent vs $201k).
- Cap rate 7.5% vs local median 4.0% in Wylie — top-decile yield for the area; either an underpriced asset or a hidden risk that comps aren't pricing in. Stress-test before assuming the spread holds.
Location & tenants
- Location reads 69/100 on livability (#419 in TX) — a middle-class / working-renter tenant base. Strengths: crime A+, employment A+, housing A+; Watch: amenities F, commute F, health & safety F.
- Princeton ISD (suburban): math 51% / reading 47% proficiency, ranked #188 of 826 in TX (top 23%) — families likely to look elsewhere, expect single-tenant / working-renter base with shorter leases.
- Market conditions: Rents soft (-1.0%/yr); 1404 active listings in the ZIP; 40 comparable units currently listed for rent nearby; rentals at typical pace (median 25d on market — plan ~3-4 weeks tenant-placement turnaround); solid renter incomes; 19,194 units permitted in Collin County in 2024 (3,988 in 5+ unit buildings).
Forward outlook
- Local home prices are declining (-3.0%/yr); year-one equity from $1k of loan paydown is wiped out by about $6k of value loss. Plan a longer hold.
- Collin County population projected at +60% by 2050 — long-run rental-demand tailwind backs the buy-and-hold thesis.
Negotiation context
- Only 4 days on market — expect competitive offers; lowballing is unlikely to land.
Questions for the listing agent
- Is there a deadline driving the sale (1031 exchange, divorce, estate, relocation)? That informs how much negotiation room exists.
- Schools are B-rated — typically a magnet for longer-tenancy family renters. What's the average tenant stay here, and is there a school-zone premium baked into asking?
- What's the average days-on-market for RENTAL listings here right now (not sales)? A rising rental-DOM trend means longer vacancies and softer asking-rent achievability than the comps imply.
- What's the recent tenant-quality profile in this submarket — average credit score on applications, eviction rate, late-payment / NSF rate, and stable-employment percentage? A property-management company in the area should have these aggregated.
- How much new for-sale + rental construction is in the pipeline within 1–3 miles? Heavy new supply typically softens prices + rents 12–24 months out; constrained supply supports both.
Investment metrics
- 1% rule
- 1.01% ✓
- Cap rate
- 7.53%
- Cash-on-cash
- 4.43%
- DSCR
- 1.20
- GRM
- 8.3
CMA / ARV
- ARV (on-the-fly)
- $244,065
- Comps found
- 12
Show comp detail 12 sales within ~0.75 mi
| Address | Dist | Beds/Ba | Sqft | Sold | Price | $/sf | Match |
|---|---|---|---|---|---|---|---|
| 6314 Sandpiper Ln | 0.03mi | 4/2.5 | 1,535 (0%) | 1mo | $207,999 | $136 | 98 |
| 721 Wagtail Dr | 0.08mi | 4/2.5 | 1,535 (0%) | 1mo | $209,999 | $137 | 95 |
| 810 Wagtail Dr | 0.15mi | 4/2.5 | 1,535 (0%) | 1mo | $238,369 | $155 | 92 |
| 6100 Pinion Trl | 0.26mi | 4/2.5 | 1,549 (+1%) | 1mo | $237,490 | $153 | 86 |
| 6308 Sandpiper Ln | 0.03mi | 3/2.5 (-1) | 1,360 (-11%) | 1mo | $217,999 | $160 | 74 |
| 6110 Pinion Trl | 0.26mi | 3/2.5 (-1) | 1,419 (-8%) | 1mo | $229,990 | $162 | 70 |
| 6412 Longspur Ln | 0.21mi | 3/2.0 (-1) | 1,402 (-9%) | 0mo | $222,999 | $159 | 69 |
| 6413 Longspur Ln | 0.23mi | 3/2.0 (-1) | 1,411 (-8%) | 1mo | $215,000 | $152 | 68 |
| 6508 Glade St | 0.23mi | 3/2.0 (-1) | 1,402 (-9%) | 1mo | $222,999 | $159 | 67 |
| 416 Sandhill Crane Ln | 0.26mi | 3/2.0 (-1) | 1,402 (-9%) | 0mo | $221,999 | $158 | 66 |
| 6414 Willet Rd | 0.26mi | 3/2.0 (-1) | 1,402 (-9%) | 1mo | $252,999 | $180 | 65 |
| 403 Shearwater Ave | 0.32mi | 3/2.0 (-1) | 1,402 (-9%) | 1mo | $253,674 | $181 | 62 |
Match score weights: distance 35% · size 25% · config 20% · recency 20%. Top-matched comps best support the ARV.
Projected returns pro-forma
-3.0% appreciation · 0.0% rent growth · sell at horizon
- IRR
- -12.8%
- Equity multiple
- 0.55×
- Total profit
- $-25,230
- Equity at exit
- $29,955
- IRR
- -9.2%
- Equity multiple
- 0.51×
- Total profit
- $-27,709
- Equity at exit
- $17,370
Cash invested: $56,252 (down + closing). Projections, not guarantees.
Landlord ↔ Tenant lean methodology
- Overall (STATE)
- 87 Strongly Landlord-Friendly
- State Texas
- 87 Strongly Landlord-Friendly · R+5
- County
- — inherits STATE
- City
- — inherits STATE
ZIP-level market 75407
- Home prices YoY
- -30.3%
- Rents YoY
- -1.0%
- Active inventory
- 1404
- Price-to-rent
- 8.3×
Monthly cashflow live
- Estimated rent
- $2,020 high interval (Pro) →
- Mortgage (P&I)
- −$1,054
- Tax est. 1.5%
- −$251 /mo · $3,013/yr
- Insurance
- −$84
- HOA
- −$0
- Vacancy / Maint / Mgmt
- −$424
- Net cashflow
- $207
Break-even live
Sensitivity live
| Price | -10% $346 | -5% $277 | +0% $207 | +5% $138 | +10% $69 |
|---|---|---|---|---|---|
| Rent | -10% $48 | -5% $128 | +0% $207 | +5% $287 | +10% $367 |
| Rate | -1.0pp $309 | -0.5pp $259 | base $207 | +0.5pp $155 | +1.0pp $102 |
UW: 25.0% down · 7.5% · 30yr · 1.5% tax · 5.0% vac · 8.0% maint · 8.0% mgmt
Financing live
Cash to close
- Down payment
- $50,225
- Closing costs
- $6,027
- Reserves months
- —
- Total cash needed
- —
Loan-product check · same deal, 3 products live
Conventional
25% down · 7.5% · 30yr
- Down + closing
- —
- Monthly P&I
- —
- Monthly cashflow
- —
- DSCR
- —
- Eligible?
- —
Personal DTI + credit; lowest rate.
DSCR
20% down · 8.5% · 30yr
- Down + closing
- —
- Monthly P&I
- —
- Monthly cashflow
- —
- DSCR
- —
- Eligible?
- —
No personal income docs; deal must DSCR.
Hard money
10% down · 12.0% · 12mo
- Down + closing
- —
- Monthly P&I
- —
- Monthly cashflow
- —
- DSCR
- —
- Eligible?
- —
Short-term bridge; refi at stabilization.
Rent comps 40 comps
| Address | Beds | Baths | Sqft | Rent | $/sqft | DOM | Units | Dist |
|---|---|---|---|---|---|---|---|---|
| 6310 Sandpiper Ln Princeton, TX | 4.0 | 2.5 | 1549 | $2,030 | $1.31 | 12d | 1 | 0.03mi |
| 6311 Whimbrel Way Princeton, TX | 4.0 | 2.5 | 1535 | $1,795 | $1.17 | 10d | 1 | 0.04mi |
| 732 Sandhill Crane Ln Princeton, TX | 4.0 | 2.5 | 1570 | $1,875 | $1.19 | 12d | 1 | 0.08mi |
| 721 Wagtail Dr Princeton, TX | 4.0 | 2.5 | 1535 | $1,600 | $1.04 | 24d | 1 | 0.08mi |
| 6222 Sandpiper Ln Unit NA Princeton, TX | 3.0 | 2.5 | 1400 | $1,750 | $1.25 | 7d | 1 | 0.09mi |
| 600 Sandhill Crane Ln Princeton, TX | 3.0 | 2.0 | 1402 | $2,100 | $1.50 | 13d | 1 | 0.10mi |
| 724 Wagtail Dr Princeton, TX | 3.0 | 2.5 | 1360 | $1,675 | $1.23 | 3d | 1 | 0.11mi |
| 724 Wagtail Dr Princeton, TX | 3.0 | 2.5 | 1360 | $1,675 | $1.23 | 2d | 1 | 0.11mi |
| 801 Wagtail Dr , TX | 4.0 | 2.5 | 1535 | $1,975 | $1.29 | 7d | 1 | 0.14mi |
| 803 Wagtail Dr , TX | 3.0 | 2.5 | 1360 | $1,605 | $1.18 | 22d | 1 | 0.14mi |
| 812 Sandhill Crane Ln Princeton, TX | 3.0 | 2.5 | 1309 | $1,850 | $1.41 | 44d | 1 | 0.14mi |
| 6313 Kingfisher Way Princeton, TX | 3.0 | 3.0 | 1360 | $1,650 | $1.21 | 44d | 1 | 0.19mi |
| 6225 Kingfisher Way Princeton, TX | 3.0 | 2.5 | 1290 | $1,625 | $1.26 | 5d | 1 | 0.20mi |
| 904 Sandhill Crane Ln Princeton, TX | 4.0 | 2.5 | 1600 | $1,750 | $1.09 | 44d | 1 | 0.22mi |
| 911 Sandhill Crane Ln Princeton, TX | 3.0 | 2.5 | 1360 | $1,575 | $1.16 | 44d | 1 | 0.22mi |
| 905 Blue Heron Dr Princeton, TX | 4.0 | 2.5 | 1535 | $1,775 | $1.16 | 22d | 1 | 0.22mi |
| 905 Blue Heron Dr Princeton, TX | 4.0 | 2.5 | 1535 | $1,775 | $1.16 | 24d | 1 | 0.22mi |
| 914 Sandhill Crane Ln Princeton, TX | 3.0 | 2.5 | 1189 | $1,775 | $1.49 | 7d | 1 | 0.22mi |
| 6505 Glade St Princeton, TX | 4.0 | 2.0 | 1600 | $1,800 | $1.12 | 44d | 1 | 0.23mi |
| 935 Sandhill Crane Ln Princeton, TX | 3.0 | 2.5 | 1189 | $1,999 | $1.68 | 19d | 1 | 0.24mi |
| 623 Linden Rd Princeton, TX | 3.0 | 2.5 | 1419 | $1,650 | $1.16 | 44d | 1 | 0.24mi |
| 919 Blue Heron Dr Princeton, TX | 4.0 | 2.5 | 1535 | $1,775 | $1.16 | 44d | 1 | 0.26mi |
| 919 Blue Heron Dr Princeton, TX | 4.0 | 2.5 | 1535 | $1,700 | $1.11 | 18d | 1 | 0.26mi |
| 416 Finch CIR Princeton, TX | 3.0 | 2.0 | 1266 | $1,350 | $1.07 | 44d | 1 | 0.26mi |
| 6102 Pinion Trl , TX | 3.0 | 2.5 | 1419 | $1,600 | $1.13 | 44d | 1 | 0.28mi |
| 926 Wood Stork Way Princeton, TX | 3.0 | 2.5 | 1285 | $1,700 | $1.32 | 24d | 1 | 0.29mi |
| 6015 Pinion Trl , TX | 4.0 | 2.5 | 1615 | $1,950 | $1.21 | 44d | 1 | 0.29mi |
| 6018 Primrose Rd , TX | 3.0–4.0 | 2.5 | 1484 | $1,875 | $1.26 | 3d | 5 | 0.31mi |
| 613 Holleman Dr , TX | 3.0 | 2.0 | 1260 | $2,000 | $1.59 | 24d | 1 | 0.31mi |
| 427 Bower DR Princeton, TX | 4.0 | 2.0 | 1600 | $1,850 | $1.16 | 24d | 1 | 0.31mi |
| 6234 Sanderling St Princeton, TX | 4.0 | 2.5 | 1535 | $1,725 | $1.12 | 44d | 1 | 0.32mi |
| 545 Holleman Dr Princeton, TX | 3.0 | 2.0 | 1474 | $1,750 | $1.19 | 44d | 1 | 0.33mi |
| 538 Montclair Ave Princeton, TX | 3.0 | 2.0 | 1260 | $1,775 | $1.41 | 10d | 1 | 0.35mi |
| 656 Waymaker Way Princeton, TX | 4.0 | 3.0 | 2015 | $2,175 | $1.08 | 12d | 1 | 0.38mi |
| 639 Montclair Ave , TX | 4.0 | 2.0 | 1707 | $2,100 | $1.23 | 44d | 1 | 0.39mi |
| 639 Montclair Ave , TX | 4.0 | 2.0 | 1707 | $1,850 | $1.08 | 7d | 1 | 0.39mi |
| 402 Harvest St Princeton, TX | 3.0 | 2.0 | 1433 | $1,665 | $1.16 | 13d | 1 | 0.44mi |
| 6744 Teal Cir Princeton, TX | 3.0 | 2.0 | 1474 | $1,790 | $1.21 | 21d | 1 | 0.47mi |
| 241 Boxberry Way Princeton, TX | 3.0 | 2.0 | 1411 | $1,725 | $1.22 | 44d | 1 | 0.48mi |
| 214 Wheatgrass Ln Princeton, TX | 3.0 | 2.0 | 1407 | $1,699 | $1.21 | 44d | 1 | 0.51mi |
Nearby sold comps map
Loading sold comps map…
Walkable amenities ~0.75 mi
Loading nearby amenities…
Taxation est. · year 1
- Rental income
- $24,241
- − Mortgage interest
- −$11,253
- − Property taxes
- −$3,013
- − Insurance
- −$1,004
- − Repairs & maintenance
- −$1,939
- − Management
- −$1,939
- − Depreciation
- −$5,844
- Taxable loss
- −$754
- Est. tax savings @ 24.0%
- +$181
- After-tax cash flow
- $2,671/yr
For passive investors: Depreciation is non-cash, so a rental often shows a tax loss while cash-flowing — sheltering income. Rental losses are passive: they offset passive income freely, and up to $25,000/yr can offset ordinary (W-2) income if you actively participate and your MAGI is under $100k (phasing out to $0 by $150k); unused losses carry forward. On sale, claimed depreciation is recaptured at up to 25%, and gains may owe capital-gains tax (a 1031 exchange can defer both). Figures are a year-1 estimate at your 24.0% rate — not tax advice; consult a CPA.
Condition & rehab AI · 22 photos
This two-story home features a modern open floor plan with four bedrooms, including a luxurious owner's suite. The home is in good condition with minimal repairs needed, making it a great investment opportunity.
Value-add opportunities
- Resale Paint the exterior siding — Fresh paint can enhance curb appeal and home value.
- Resale Replace the front door — A new front door can improve the home's curb appeal and security.
- Rental Clean the gutters — Clean gutters can prevent water damage and improve the home's overall appearance.
Renovation cost estimate screening
Value-add ROI direction
- Resale Paint the exterior siding — Fresh paint can enhance curb appeal and home value. ↑
- Resale Replace the front door — A new front door can improve the home's curb appeal and security. ↑
- Rental Clean the gutters — Clean gutters can prevent water damage and improve the home's overall appearance. ↑
ⓘ Cost ranges are severity-bucket heuristics (US national rule-of-thumb). Get contractor quotes + a written scope before underwriting a rehab budget.
Schools (NCES district)
- District
- Princeton ISD
- NCES district ID
- 4835850
- Math proficiency
- 51% ▼ -8.00%
- Reading proficiency
- 47% ▬ 0.00%
- Median HH income
- $54,827
- Composite
- 42.44/100
- National rank
- #3226
- State rank
- #188 of 826 in TX
Livability — Wylie
- Score
- 69/100
- State rank
- #419
- US rank
- #8623
Category grades
Schools grade is shown separately in the Schools card above.
Census & demographics
- County
- Collin County · 1,159,394 people
- City population
- 69,325
- Metro
- Dallas-Fort Worth-Arlington, TX
- Population (ZIP)
- 34,171
- Household income
- $100,037
- Rent vs Own
- Severe rent burden
- 368.0
Population outlook (Collin County) Hauer SSP2
- Today (2025)
- 1,210,074 people
- By 2030
- 1,358,201 · +12.2%
- By 2040
- 1,654,061 · +36.7%
- By 2050
- 1,937,359 · +60.1%
- By 2075
- 2,567,039 · +112.1%
- By 2100
- 2,952,048 · +144.0%
Race, ethnicity, and origin ACS 2023
- Neighborhood character
- Diverse neighborhood (Simpson 0.66)
- Race & ethnicity
- White 47% Hispanic / Latino 30% Black 17% Two or more races 10% Asian 4% Native American 1%
- Hispanic origin (detail)
- Mexican 26%
- Common ancestry
- Lithuanian 2% Romanian 1% Russian 1%
- Foreign-born
- 15% · Canada, China, Mexico
- Languages at home
- 70% English-only · Spanish 22% Other Indo-European 2% Other Asian/Pacific 1%
Political lean MEDSL · Collin
- 2024 margin
- R (+11.1) · D 43.1% · R 54.3% · Other 2.6%
- 2008→2024 swing
- +14.4pp toward D · 2008: -25.6pp · 2024: -11.1pp
- All cycles
- 2024: R+11.1 2020: R+4.3 2016: R+17.0 2012: R+31.6 2008: R+25.6
Not yet ingested
- Civics
- —
Market trends
- HPI YoY
- ▼ -103.99%
- Current HPI
- 238.9373
- Rent YoY
- ▼ -1.02%
- Metro
- Dallas-Fort Worth-Arlington, TX
- State GDP YoY
- ▲ 3.95%
- F500 in state
- 110
Industry mix (Fortune 500 HQ in TX)
| Industry | F500 HQs | Revenue |
|---|---|---|
| Energy | 16 | $1,198B |
|
||
| Technology | 5 | $198B |
|
||
| Engineering / Construction | 4 | $72B |
|
||
| Energy Services | 3 | $60B |
|
||
| Utilities | 3 | $41B |
|
||
| Healthcare | 2 | $330B |
|
||
Cash-flow waterfall
monthlySold comps — $/sqft
last 12 mo · ≤1 miLoading sold comps…