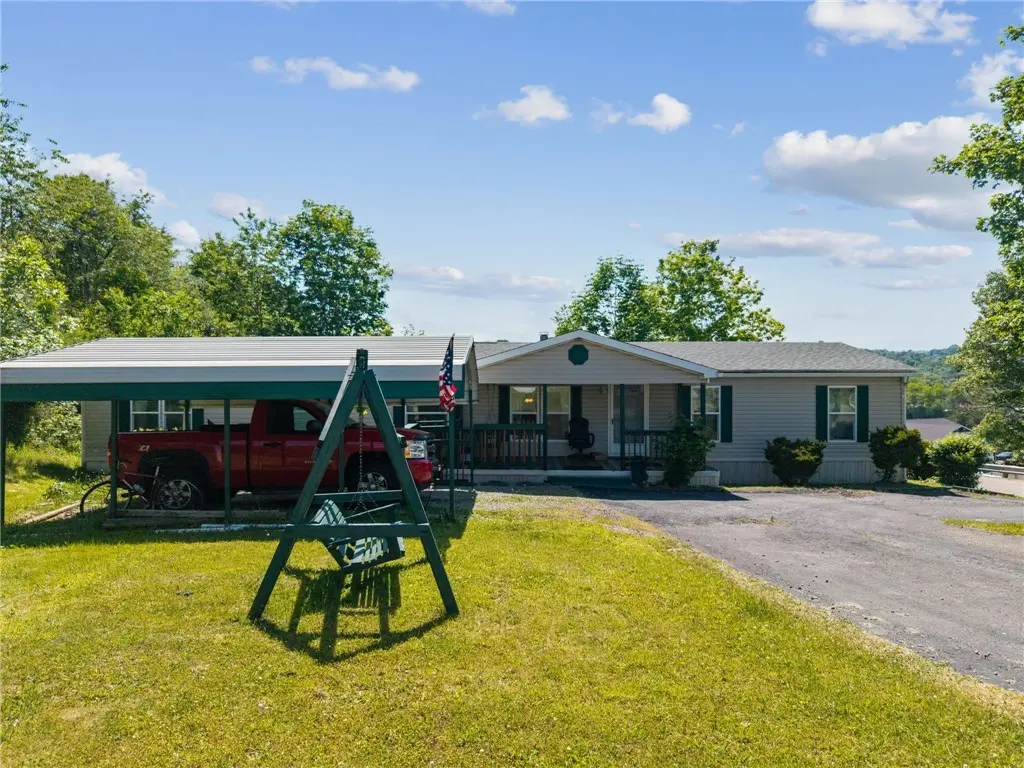
597 Valley View Dr · Donegal, PA
Flood risk No data
- FEMA flood zone
- —
- Chance of flooding over 30 yrs
- —
- Est. flood insurance / yr
- —
Fire risk No data
- Est. fire insurance / yr
- —
Heat risk No data
- Hot days now (above threshold)
- —
- Hot days in 30 yrs
- —
Wind risk No data
- Chance of severe wind over 30 yrs
- —
Air-quality risk No data
- Unhealthy air days now
- —
- Unhealthy air days in 30 yrs
- —
Risk factors via First Street. Map © Google.
Why this score? — see what drove the D- grade
The composite is a weighted blend of 9 inputs, each scored 0–100. Each bar is that input's sub-score; the figure is the points it added to the 100-point composite (weight × sub-score).
- 1% rule +8.1/10.0
- ARV discount +7.5/15.0
- Appreciation +5.9/10.0
- Cash flow +3.8/30.0
- Schools +3.2/10.0
- Livability +2.7/5.0
- Rent growth +2.5/5.0
- Condition / age +2.5/5.0
- DSCR +0.0/10.0
$80,500
🖨 Deal sheet (PDF) 📄 Offer letter ✓ Due diligence
Listing remarks MLS
Here is your new permanent residence or mountain getaway to the Laurel Highlands. This well maintained 4 bedroom, 2 bath home on a nice lot is waiting for you! Large kitchen with island and plenty of cupboards and counter space is open to the living room. Gas fireplace in the family room. Included with this house are the refrigerator, dishwasher, stove, microwave, washer and dryer! Paved driveway leads to the carport. Nice front porch with swing to sit and relax. Shed on back of lot is included too. Easy access to the PA turnpike. This home is on a leased lot in the Laurel Highlands Campland.
Key facts
- Propane fireplace
- Open concept design
- Skylight
Tags
Property features AI
Finance
- HOA & community: Association fee of $454 per month
Exterior
- Parking: Covered parking for 2 vehicles
- Utilities: Public water; Public sewer
- Home design: Single-story home; Vinyl siding; Asphalt roof; Resale property
- Construction: Vinyl siding construction; Asphalt roof; Has home warranty
- Exterior features: On a leased lot; Private pool
Interior
- Kitchen: Refrigerator; Stove; Dishwasher; Microwave; Kitchen island
- Bedrooms: Bedroom 2 — Main level (approx. 12x10); Bedroom 3 — Main level (approx. 12x10); Bedroom 4 — Main level (approx. 10x10)
- Flooring: Carpet; Vinyl
- Bathrooms: 2 full bathrooms
- Heating & cooling: Electric forced-air heating; Central air conditioning
- Interior features: Kitchen island; Propane fireplace (1)
- Laundry & utility: Washer; Dryer; Main-level laundry (approx. 12x7)
Neighborhood map
What this means for you Summary
Snapshot
- This is a 4-bed/2.0-bath manufactured listed at $80k.
Deal economics
- At list price, monthly cash flow is $-231 ($-3k/yr) — negative.
- To cash-flow at today's rent, offer at most $40k (50.8% below list).
- Meets the 1% rule at list price ($1k rent vs $80k).
- Recommended offer: $40k (50.8% below list) — sets the bar for cash-flow.
Location & tenants
- Location reads 53/100 on livability (#1,681 in PA) — a working-class tenant base; expect higher turnover. Strengths: cost of living A+; Watch: housing D, amenities F, commute F.
- Mount Pleasant Area SD (suburban): math 25% / reading 51% proficiency, ranked #378 of 539 in PA (top 70%) — families likely to look elsewhere, expect single-tenant / working-renter base with shorter leases.
- Zoned schools: Mount Pleasant Area Hs (math 42%, 594 students, 28% FRL).
- Market conditions: 6 active listings in the ZIP; 415 units permitted in Westmoreland County in 2024 (10 in 5+ unit buildings).
Forward outlook
- In year one you build about $2k of equity ($557 loan paydown + $1k appreciation (1.8% local appreciation)).
- Westmoreland County population projected at -19% by 2050 — secular population decline; favor cash flow + early exit over multi-decade hold.
Negotiation context
- It's been on market 15 days — a 2% lower offer ($79k) is reasonable based on typical stale-listing flexibility.
- 2 sale attempts since 7y ago with the ask held roughly flat each time — persistent listings suggest the price (not the market) is what's stuck; bring a comps-based counter.
Risks & watch-outs
- Watch-outs: HOA is 43% of rent.
Questions for the listing agent
- What do current leases actually rent for vs. the listed asking? Can we see a recent rent roll and the last 12 months of T-12 income?
- What does the HOA fee cover, when was the last increase, and are there any pending special assessments or reserve-fund shortfalls?
- Is there a deadline driving the sale (1031 exchange, divorce, estate, relocation)? That informs how much negotiation room exists.
- Schools are F-rated, which usually means shorter tenancies and higher turnover. Who's the typical renter profile here, and what's been the actual vacancy rate?
- The area grade is low — what's the realistic commute time and amenity access for the typical tenant pool here? Any planned neighborhood developments (good or bad) we should know about?
- What's the average days-on-market for RENTAL listings here right now (not sales)? A rising rental-DOM trend means longer vacancies and softer asking-rent achievability than the comps imply.
- What's the recent tenant-quality profile in this submarket — average credit score on applications, eviction rate, late-payment / NSF rate, and stable-employment percentage? A property-management company in the area should have these aggregated.
- How much new for-sale + rental construction is in the pipeline within 1–3 miles? Heavy new supply typically softens prices + rents 12–24 months out; constrained supply supports both.
Investment metrics
- 1% rule
- 1.31% ✓
- Cap rate
- 2.84%
- Cash-on-cash
- -12.32%
- DSCR
- 0.45
- GRM
- 6.3
CMA / ARV
No comps found within radius.
Projected returns pro-forma
1.77% appreciation · 3.0% rent growth · sell at horizon
- IRR
- -8.2%
- Equity multiple
- 0.56×
- Total profit
- $-9,835
- Equity at exit
- $30,749
- IRR
- -2.3%
- Equity multiple
- 0.68×
- Total profit
- $-7,183
- Equity at exit
- $43,522
Cash invested: $22,540 (down + closing). Projections, not guarantees.
Landlord ↔ Tenant lean methodology
- Overall (STATE)
- 62 Landlord-Friendly
- State Pennsylvania
- 62 Landlord-Friendly · EVEN
- County
- — inherits STATE
- City
- — inherits STATE
ZIP-level market 15628
- Home prices YoY
- 1.7%
- Active inventory
- 6
- Price-to-rent
- 6.3×
Monthly cashflow live
- Estimated rent
- $1,058 medium interval (Pro) →
- Mortgage (P&I)
- −$422
- Tax from tax record
- −$157 /mo · $1,887/yr
- Insurance
- −$34
- HOA
- −$454
- Lot rent leased land?
- −$0
- Vacancy / Maint / Mgmt
- −$222
- Net cashflow
- $-231
Break-even live
Sensitivity live
| Price | -10% $-186 | -5% $-209 | +0% $-231 | +5% $-254 | +10% $-277 |
|---|---|---|---|---|---|
| Rent | -10% $-315 | -5% $-273 | +0% $-231 | +5% $-190 | +10% $-148 |
| Rate | -1.0pp $-191 | -0.5pp $-211 | base $-231 | +0.5pp $-252 | +1.0pp $-274 |
UW: 25.0% down · 7.5% · 30yr · 1.5% tax · 5.0% vac · 8.0% maint · 8.0% mgmt
Financing live
Cash to close
- Down payment
- $20,125
- Closing costs
- $2,415
- Reserves months
- —
- Total cash needed
- —
Loan-product check · same deal, 3 products live
Conventional
25% down · 7.5% · 30yr
- Down + closing
- —
- Monthly P&I
- —
- Monthly cashflow
- —
- DSCR
- —
- Eligible?
- —
Personal DTI + credit; lowest rate.
DSCR
20% down · 8.5% · 30yr
- Down + closing
- —
- Monthly P&I
- —
- Monthly cashflow
- —
- DSCR
- —
- Eligible?
- —
No personal income docs; deal must DSCR.
Hard money
10% down · 12.0% · 12mo
- Down + closing
- —
- Monthly P&I
- —
- Monthly cashflow
- —
- DSCR
- —
- Eligible?
- —
Short-term bridge; refi at stabilization.
HOA detail
- Monthly dues
- $454 · $5,448/yr
- Likely covers
- gas
Listing history 10 events
-
2026-06-22days on market $80,500 Active 15 DOM
-
2026-06-21days on market $80,500 Active 14 DOM
-
2026-06-18days on market $80,500 Active 11 DOM
-
2026-06-17days on market $80,500 Active 10 DOM
-
2026-06-16days on market $80,500 Active 9 DOM
-
2026-06-15days on market $80,500 Active 8 DOM
-
2026-06-13days on market $80,500 Active 6 DOM
-
2026-06-09days on market $80,500 Active 2 DOM
-
2026-06-08remarks 699-char remark
-
2026-06-08$80,500 Active 1 DOM
ⓘ Source: listings_history table (triggers on properties + properties_extension) + one-shot
backfill from property_details.listing_events for pre-trigger history.
Tax reassessment forecast PA · Partial reset (capped growth)
- Current annual tax
- $1,887 · $157/mo
- Projected year-2 tax
- $1,887 · $157/mo
- Expected delta
- $0/yr ($0/mo · 0.0%)
ⓘ Screening estimate from a state-policy table — verify with the county assessor before closing.
Nearby sold comps map
Loading sold comps map…
Walkable amenities ~0.75 mi
Loading nearby amenities…
Taxation est. · year 1
- Rental income
- $12,690
- − Mortgage interest
- −$4,509
- − Property taxes
- −$1,887
- − Insurance
- −$402
- − Repairs & maintenance
- −$1,015
- − Management
- −$1,015
- − HOA
- −$5,448
- − Depreciation
- −$2,342
- Taxable loss
- −$3,928
- Est. tax savings @ 24.0%
- +$943
- After-tax cash flow
- $-1,835/yr
For passive investors: Depreciation is non-cash, so a rental often shows a tax loss while cash-flowing — sheltering income. Rental losses are passive: they offset passive income freely, and up to $25,000/yr can offset ordinary (W-2) income if you actively participate and your MAGI is under $100k (phasing out to $0 by $150k); unused losses carry forward. On sale, claimed depreciation is recaptured at up to 25%, and gains may owe capital-gains tax (a 1031 exchange can defer both). Figures are a year-1 estimate at your 24.0% rate — not tax advice; consult a CPA.
Schools (NCES district)
- District
- Mount Pleasant Area SD
- NCES district ID
- 4216170
- Math proficiency
- 25% ▼ -19.00%
- Reading proficiency
- 51% ▼ -12.00%
- Median HH income
- $47,175
- Composite
- 32.46/100
- National rank
- #5716
- State rank
- #378 of 539 in PA
Livability — Donegal
- Score
- 53/100
- State rank
- #1681
- US rank
- #24633
Category grades
Schools grade is shown separately in the Schools card above.
Census & demographics
- Population (ZIP)
- 423
Population outlook (Westmoreland County) Hauer SSP2
- Today (2025)
- 342,555 people
- By 2030
- 331,717 · -3.2%
- By 2040
- 304,976 · -11.0%
- By 2050
- 277,444 · -19.0%
- By 2075
- 224,607 · -34.4%
- By 2100
- 171,084 · -50.1%
Race, ethnicity, and origin ACS 2023
- Neighborhood character
- Predominantly White (95%)
- Race & ethnicity
- White 95% Two or more races 5%
- Common ancestry
- Romanian 6% Lithuanian 4% Slovak 1%
Political lean MEDSL · Westmoreland
- 2024 margin
- Strong R (+28.4) · D 35.4% · R 63.9%
- 2008→2024 swing
- -11.7pp toward R · 2008: -16.7pp · 2024: -28.4pp
- All cycles
- 2024: R+28.4 2020: R+28.3 2016: R+31.3 2012: R+23.7 2008: R+16.7
Not yet ingested
- Civics
- —
Market trends
- HPI YoY
- ▲ 1.77%
- Current HPI
- 105.3959
- Rent YoY
- —
- Metro
- —
- State GDP YoY
- ▲ 1.68%
- F500 in state
- 34
Industry mix (Fortune 500 HQ in PA)
| Industry | F500 HQs | Revenue |
|---|---|---|
| Healthcare | 2 | $309B |
|
||
| Insurance | 2 | $27B |
|
||
| Telecommunications / Media | 1 | $124B |
|
||
| Industrial Distribution | 1 | $22B |
|
||
| Financial Services | 1 | $20B |
|
||
| Chemicals / Materials | 1 | $18B |
|
||
Price history
+45.0% since first listed3 events — show timeline
- 2026-06-06 Listed $80,500 West Penn MLS
- 2019-05-20 Delisted — West Penn MLS
- 2019-04-03 Listed $55,500 West Penn MLS
Property tax history
+1.5%/yrLatest (2026): $1,887 · -0.5% YoY. Source: county tax records.
Cash-flow waterfall
monthlySold comps — $/sqft
last 12 mo · ≤1 miLoading sold comps…