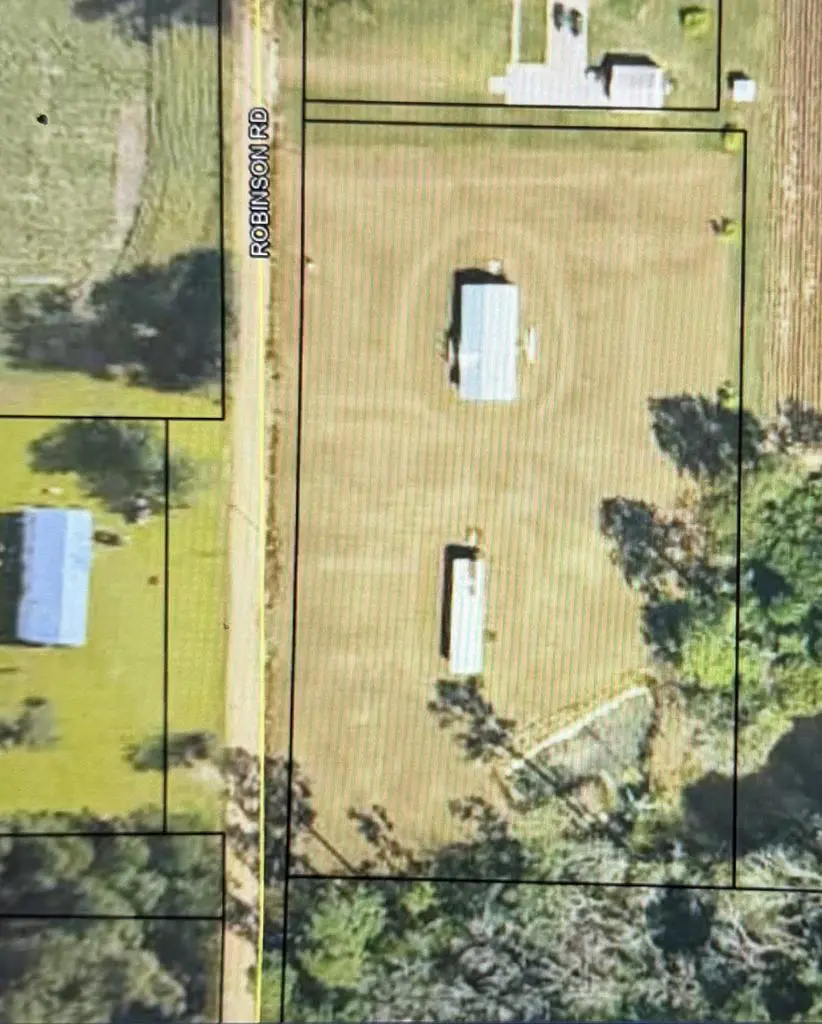
916 NE Robinson Rd - Tract 2 Rd · Morven, GA
Flood risk No data
- FEMA flood zone
- —
- Chance of flooding over 30 yrs
- —
- Est. flood insurance / yr
- —
Fire risk No data
- Est. fire insurance / yr
- —
Heat risk No data
- Hot days now (above threshold)
- —
- Hot days in 30 yrs
- —
Wind risk No data
- Chance of severe wind over 30 yrs
- —
Air-quality risk No data
- Unhealthy air days now
- —
- Unhealthy air days in 30 yrs
- —
Risk factors via First Street. Map © Google.
Why this score? — see what drove the B grade
The composite is a weighted blend of 9 inputs, each scored 0–100. Each bar is that input's sub-score; the figure is the points it added to the 100-point composite (weight × sub-score).
- Cash flow +28.2/30.0
- DSCR +10.0/10.0
- Appreciation +8.9/10.0
- ARV discount +7.5/15.0
- 1% rule +7.1/10.0
- Livability +2.8/5.0
- Rent growth +2.5/5.0
- Condition / age +2.5/5.0
- Schools +1.2/10.0
$85,000
🖨 Deal sheet (PDF) 📄 Offer letter ✓ Due diligence
Listing remarks
Enjoy the open floor plan of this 954 sq. ft. 3 bedroom / 2 bath home in a quaint, quiet and peaceful setting on 1.4 acres. . Added BONUS is the pond in the back.
Key facts
- Open floor plan
- Pond in the back
- 1.4 acre lot
Tags
Property features AI
Exterior
- Utilities: Private well water; Septic tank
- Home design: Single-story residential mobile home; Zoned R4; Facing direction not specified
- Construction: Vinyl siding; Built as a mobile home
- Exterior features: Shingle roof; Irregular lot
Interior
- Flooring: Carpet; Laminate
- Bathrooms: 2 full bathrooms
- Interior features: Carpet and laminate flooring
Neighborhood map
What this means for you Summary
Snapshot
- This is a 3-bed/2.0-bath other listed at $85k.
Deal economics
- At list price, monthly cash flow is $270 ($3k/yr) — positive.
- The deal already cash-flows at list — no discount required.
- Meets the 1% rule at list price ($1k rent vs $85k).
- Recommended offer: $82k (3.0% below list) — sets the bar for market timing.
Location & tenants
- Location reads 55/100 on livability (#528 in GA) — a working-class tenant base; expect higher turnover. Strengths: cost of living A+; Watch: housing D+, health & safety D, crime F.
- Brooks County (rural): math 15% / reading 15% proficiency, ranked #160 of 174 in GA (top 92%) — low school quality limits family demand, transient renter base, plan for 1-2y turnover; 75% free/reduced lunch — lower-income household profile, screen leases tightly.
- Zoned schools: North Brooks Elementary School (math 22% / reading 17%, grade F, #878 of 1,228 statewide, top 75%, 361 students, 97% FRL); Brooks County Middle School (math 11% / reading 19%, grade F, #397 of 470 statewide, top 85%, 465 students, 97% FRL) — zoned schools average 97% FRL vs 75% district-wide (22 pts higher); higher-poverty schools than district average — tighter screening recommended.
- Market conditions: 8 active listings in the ZIP; 39 units permitted in Brooks County in 2024 (0 in 5+ unit buildings).
Forward outlook
- In year one you build about $7k of equity ($588 loan paydown + $7k appreciation (7.8% local appreciation)).
- Brooks County population projected at -30% by 2050 — secular population decline; favor cash flow + early exit over multi-decade hold.
- At projected returns (7.8% appreciation + 3.0% rent growth), your $24k cash investment doubles in ~3 years — after that, you're playing with house money.
- By year 5, paydown + projected appreciation supports a ~$32k cash-out refi (75% LTV) — recoverable capital for the next deal without selling this one.
Negotiation context
- It's been on market 41 days — a 3% lower offer ($82k) is reasonable based on typical stale-listing flexibility.
- 2 sale attempts with the ask held roughly flat each time — persistent listings suggest the price (not the market) is what's stuck; bring a comps-based counter.
Questions for the listing agent
- It's been on market 41 days. Have you received any prior offers? Is the seller open to a 3% concession, seller financing, or rate buy-down credit?
- Is there a deadline driving the sale (1031 exchange, divorce, estate, relocation)? That informs how much negotiation room exists.
- Schools are F-rated, which usually means shorter tenancies and higher turnover. Who's the typical renter profile here, and what's been the actual vacancy rate?
- Crime grade is F in this area — have there been break-ins, vandalism, or insurance claims at this property in the last 3 years? What carrier currently insures it and at what premium?
- What's the average days-on-market for RENTAL listings here right now (not sales)? A rising rental-DOM trend means longer vacancies and softer asking-rent achievability than the comps imply.
- What's the recent tenant-quality profile in this submarket — average credit score on applications, eviction rate, late-payment / NSF rate, and stable-employment percentage? A property-management company in the area should have these aggregated.
- How much new for-sale + rental construction is in the pipeline within 1–3 miles? Heavy new supply typically softens prices + rents 12–24 months out; constrained supply supports both.
Investment metrics
- 1% rule
- 1.21% ✓
- Cap rate
- 10.10%
- Cash-on-cash
- 13.60%
- DSCR
- 1.60
- GRM
- 6.9
CMA / ARV
No comps found within radius.
Projected returns pro-forma
7.75% appreciation · 3.0% rent growth · sell at horizon
- IRR
- 30.1%
- Equity multiple
- 3.14×
- Total profit
- $50,838
- Equity at exit
- $63,149
- IRR
- 27.0%
- Equity multiple
- 6.66×
- Total profit
- $134,689
- Equity at exit
- $124,011
Cash invested: $23,800 (down + closing). Projections, not guarantees.
Landlord ↔ Tenant lean methodology
- Overall (STATE)
- 90 Strongly Landlord-Friendly
- State Georgia
- 90 Strongly Landlord-Friendly · R+3
- County
- — inherits STATE
- City
- — inherits STATE
ZIP-level market 31625
- Home prices YoY
- 3.7%
- Active inventory
- 8
- Price-to-rent
- 6.9×
Monthly cashflow live
- Estimated rent
- $1,031 medium interval (Pro) →
- Mortgage (P&I)
- −$446
- Tax from tax record
- −$64 /mo · $765/yr
- Insurance
- −$35
- HOA
- −$0
- Vacancy / Maint / Mgmt
- −$217
- Net cashflow
- $270
Break-even live
Sensitivity live
| Price | -10% $318 | -5% $294 | +0% $270 | +5% $246 | +10% $222 |
|---|---|---|---|---|---|
| Rent | -10% $188 | -5% $229 | +0% $270 | +5% $310 | +10% $351 |
| Rate | -1.0pp $312 | -0.5pp $291 | base $270 | +0.5pp $248 | +1.0pp $225 |
UW: 25.0% down · 7.5% · 30yr · 1.5% tax · 5.0% vac · 8.0% maint · 8.0% mgmt
Financing live
Cash to close
- Down payment
- $21,250
- Closing costs
- $2,550
- Reserves months
- —
- Total cash needed
- —
Loan-product check · same deal, 3 products live
Conventional
25% down · 7.5% · 30yr
- Down + closing
- —
- Monthly P&I
- —
- Monthly cashflow
- —
- DSCR
- —
- Eligible?
- —
Personal DTI + credit; lowest rate.
DSCR
20% down · 8.5% · 30yr
- Down + closing
- —
- Monthly P&I
- —
- Monthly cashflow
- —
- DSCR
- —
- Eligible?
- —
No personal income docs; deal must DSCR.
Hard money
10% down · 12.0% · 12mo
- Down + closing
- —
- Monthly P&I
- —
- Monthly cashflow
- —
- DSCR
- —
- Eligible?
- —
Short-term bridge; refi at stabilization.
Listing history 22 events
-
2026-06-21days on market $85,000 Active 41 DOM
-
2026-06-19days on market $85,000 Active 39 DOM
-
2026-06-18days on market $85,000 Active 38 DOM
-
2026-06-17days on market $85,000 Active 37 DOM
-
2026-06-16days on market $85,000 Active 36 DOM
-
2026-06-15days on market $85,000 Active 35 DOM
-
2026-06-14days on market $85,000 Active 33 DOM
-
2026-06-13days on market $85,000 Active 32 DOM
-
2026-06-10days on market $85,000 Active 30 DOM
-
2026-06-09days on market $85,000 Active 29 DOM
-
2026-06-08days on market $85,000 Active 28 DOM
-
2026-06-07days on market $85,000 Active 27 DOM
-
2026-06-05days on market $85,000 Active 24 DOM
-
2026-06-03days on market $85,000 Active 23 DOM
-
2026-06-02days on market $85,000 Active 22 DOM
-
2026-06-01days on market $85,000 Active 21 DOM
-
2026-05-31days on market $85,000 Active 20 DOM
-
2026-05-30days on market $85,000 Active 19 DOM
-
2026-05-11$85,000 Active 163-char remark
-
2025-11-30historical
-
2025-08-25price $179,900
-
2025-07-02$235,000 New
ⓘ Source: listings_history table (triggers on properties + properties_extension) + one-shot
backfill from property_details.listing_events for pre-trigger history.
Tax reassessment forecast GA · Resets to sale price
- Current annual tax
- $765 · $64/mo
- Projected year-2 tax
- $782 · $65/mo
- Expected delta
- +$17/yr (+$1/mo · 2.2%)
ⓘ Screening estimate from a state-policy table — verify with the county assessor before closing.
Nearby sold comps map
Loading sold comps map…
Walkable amenities ~0.75 mi
Loading nearby amenities…
Taxation est. · year 1
- Rental income
- $12,374
- − Mortgage interest
- −$4,761
- − Property taxes
- −$765
- − Insurance
- −$425
- − Repairs & maintenance
- −$990
- − Management
- −$990
- − Depreciation
- −$2,473
- Taxable income
- $1,970
- Est. tax owed @ 24.0%
- −$473
- After-tax cash flow
- $2,763/yr
For passive investors: Depreciation is non-cash, so a rental often shows a tax loss while cash-flowing — sheltering income. Rental losses are passive: they offset passive income freely, and up to $25,000/yr can offset ordinary (W-2) income if you actively participate and your MAGI is under $100k (phasing out to $0 by $150k); unused losses carry forward. On sale, claimed depreciation is recaptured at up to 25%, and gains may owe capital-gains tax (a 1031 exchange can defer both). Figures are a year-1 estimate at your 24.0% rate — not tax advice; consult a CPA.
Schools (NCES district)
- District
- Brooks County
- NCES district ID
- 1300540
- Math proficiency
- 15% ▼ -7.00%
- Reading proficiency
- 15% ▼ -8.00%
- Median HH income
- $35,963
- Composite
- 12.43/100
- National rank
- #9628
- State rank
- #160 of 174 in GA
Livability — Morven
- Score
- 55/100
- State rank
- #528
- US rank
- #23654
Category grades
Schools grade is shown separately in the Schools card above.
Census & demographics
- Population (ZIP)
- 972
Population outlook (Brooks County) Hauer SSP2
- Today (2025)
- 14,339 people
- By 2030
- 13,497 · -5.9%
- By 2040
- 11,787 · -17.8%
- By 2050
- 10,100 · -29.6%
- By 2075
- 6,878 · -52.0%
- By 2100
- 5,056 · -64.7%
Race, ethnicity, and origin ACS 2023
- Neighborhood character
- Predominantly White (68%)
- Race & ethnicity
- White 68% Two or more races 16% Asian 9% Black 6%
- Common ancestry
- Lithuanian 4% German 4% Italian 1%
- Foreign-born
- 13% · Canada
Political lean MEDSL · Brooks
- 2024 margin
- Strong R (+26.8) · D 36.5% · R 63.2%
- 2008→2024 swing
- -13.3pp toward R · 2008: -13.5pp · 2024: -26.8pp
- All cycles
- 2024: R+26.8 2020: R+20.7 2016: R+18.7 2012: R+6.3 2008: R+13.5
Not yet ingested
- Civics
- —
Market trends
- HPI YoY
- ▲ 7.75%
- Current HPI
- 215.115
- Rent YoY
- —
- Metro
- —
- State GDP YoY
- ▲ 2.66%
- F500 in state
- 28
Industry mix (Fortune 500 HQ in GA)
| Industry | F500 HQs | Revenue |
|---|---|---|
| Paper / Packaging | 2 | $29B |
|
||
| Retail | 1 | $160B |
|
||
| Transportation / Logistics | 1 | $91B |
|
||
| Airlines | 1 | $62B |
|
||
| Consumer Goods | 1 | $47B |
|
||
| Utilities | 1 | $25B |
|
||
Price history
-63.8% since first listed4 events — show timeline
- 2026-05-11 Listed $85,000 SGMLS
- 2025-11-30 Listing Removed — GAMLS
- 2025-08-25 Price Changed $179,900 GAMLS
- 2025-07-02 Listed $235,000 GAMLS
Property tax history
+14.7%/yrLatest (2025): $765 · +5.1% YoY. Source: county tax records.
Cash-flow waterfall
monthlySold comps — $/sqft
last 12 mo · ≤1 miLoading sold comps…