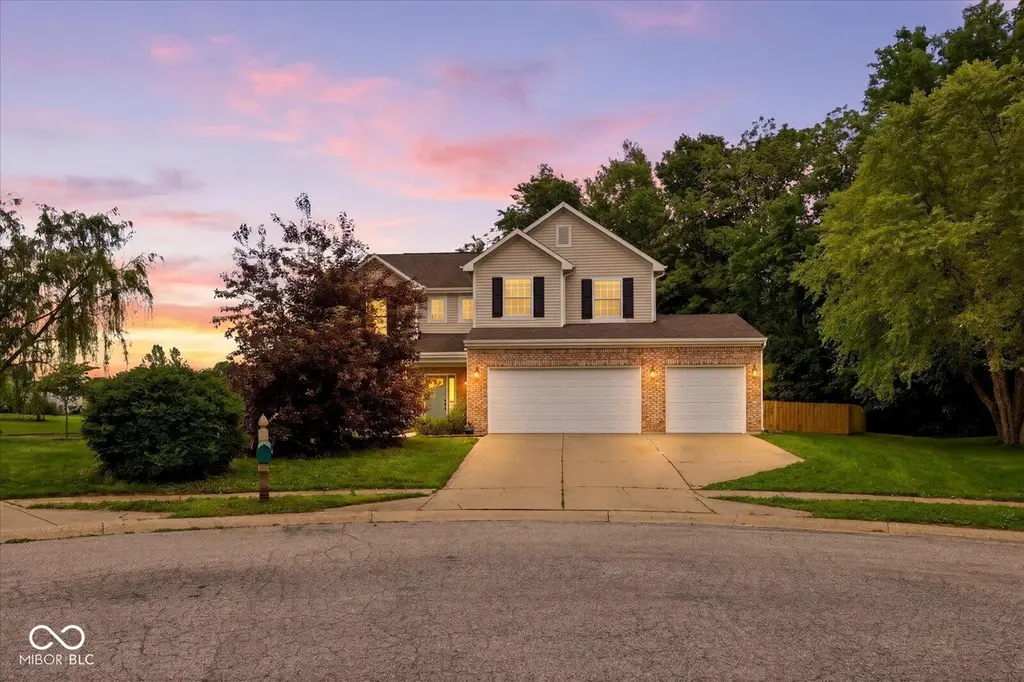
1909 Acorn Ct · Avon, IN
Flood risk 1/10 · Minimal
- FEMA flood zone
- X (unshaded)
- Chance of flooding over 30 yrs
- 0.0%
- Est. flood insurance / yr
- $507 – $1,088
Fire risk 1/10 · Minimal
- Est. fire insurance / yr
- $717 – $1,331
Heat risk 3/10 · Minor
- Hot days now (above 101°F)
- 7 days/yr
- Hot days in 30 yrs
- 19 days/yr
Wind risk 2/10 · Minimal
- Chance of severe wind over 30 yrs
- 1.0%
Air-quality risk 3/10 · Minor
- Unhealthy air days now
- 2 days/yr
- Unhealthy air days in 30 yrs
- 3 days/yr
Risk factors via First Street. Map © Google.
Why this score? — see what drove the F grade
The composite is a weighted blend of 9 inputs, each scored 0–100. Each bar is that input's sub-score; the figure is the points it added to the 100-point composite (weight × sub-score).
- ARV discount +9.4/15.0
- Cash flow +7.2/30.0
- Schools +4.7/10.0
- Livability +3.7/5.0
- Rent growth +3.2/5.0
- Condition / age +2.5/5.0
- 1% rule +1.4/10.0
- DSCR +1.4/10.0
- Appreciation +0.0/10.0
$354,500
🖨 Deal sheet (PDF) 📄 Offer letter ✓ Due diligence
Listing remarks MLS
THIS ONE HAS IT ALL! OPEN CONCEPT BOASTING FIVE BEDROOMS, OFFICE/GUEST ROOM ON MAIN, HUGE GREAT ROOM, RAISED CEILINGS, SUPER KITCHEN WITH STAINLESS APPLIANCES, ISLAND AND BREAKFAST BAR...ALL DESIGNED TO ENTERTAIN. MASTER SUITE WITH CATHEDRAL CEILING, GARDEN TUB AND WALK-IN CLOSET, 3 CAR GARAGE, & FENCED YARD. ALL THIS ON A TREE LINED CUL-DE-SAC LOT OVERLOOKING THE STOCKED POND. A GREAT HOUSE, ON A GREAT LOT, IN A GREAT LOCATION.
Key facts
- Wooded tree line
- Private cul-de-sac
- 0.32 acre lot
Tags
Property features AI
Finance
- Other: Lot approximately 0.32 acre
- HOA & community: HOA with an annual fee of $240
Exterior
- Parking: Attached concrete garage with automatic opener; 3-car garage
- Utilities: Public water; Municipal sewer connected
- Home design: Single-family residence in a planned unit development; Two levels; Entry foyer on main level
- Construction: Built by Arbor Homes LLC; Brick and vinyl siding exterior; Slab foundation
- Exterior features: Basketball court; Playset; Storage shed
Interior
- Kitchen: Dishwasher; Disposal; Exhaust fan; Microwave; Electric oven; Refrigerator; Water heater
- Bedrooms: 5 bedrooms on the upper level; Total of 11 rooms
- Bathrooms: 2 full bathrooms (upper); 1 half bathroom (main)
- Heating & cooling: Forced-air heating; Heat pump; Central air conditioning
- Interior features: Attic access; Breakfast bar; Vaulted ceilings; Kitchen island; Eat-in kitchen; Pantry; Smart thermostat; Walk-in closets
- Laundry & utility: Main-level laundry room
Neighborhood map
What this means for you Summary
Snapshot
- This is a 3-bed/2.5-bath single-family listed at $354k.
Deal economics
- At list price, monthly cash flow is $-483 ($-6k/yr) — negative.
- To cash-flow at today's rent, offer at most $269k (24.1% below list).
- To meet the 1% rule (rent ≥ 1% of price), the offer needs to be $225k (36.5% below list).
- Recommended offer: $225k (36.5% below list) — sets the bar for 1% rule.
- Cap rate 4.7% vs local median 3.8% in Avon — meaningfully above typical; check what's discounted (condition, days-on-market, listing class) to confirm the premium yield is real.
Location & tenants
- Location reads 74/100 on livability (#75 in IN, #4,686 nationally) — a middle-class / working-renter tenant base. Strengths: employment A+, cost of living A+, housing A+; Watch: amenities F, commute F.
- Avon Community School Corporation (suburban): math 51% / reading 53% proficiency, ranked #32 of 301 in IN (top 11%) — acceptable for families but not a draw, mixed tenant base, ~2y average lease; only 20% free/reduced lunch — higher-income household profile.
- Market conditions: Rents rising (+3.0%/yr); 380 active listings in the ZIP; 8 comparable units currently listed for rent nearby; rentals lingering (median 44d on market — plan ~5-8 weeks vacancy on turnover, expect pricing pressure); 50% of comp listings sitting > 30 days — soft ceiling on asking rent; solid renter incomes; 1,294 units permitted in Hendricks County in 2024 (18 in 5+ unit buildings).
Forward outlook
- Local home prices are declining (-3.0%/yr); year-one equity from $2k of loan paydown is wiped out by about $11k of value loss. Plan a longer hold.
- Hendricks County population projected at +35% by 2050 — long-run rental-demand tailwind backs the buy-and-hold thesis.
Negotiation context
- Only 4 days on market — expect competitive offers; lowballing is unlikely to land.
- 5 sale attempts since 20y ago with the ask held roughly flat each time — persistent listings suggest the price (not the market) is what's stuck; bring a comps-based counter.
- Current owner paid $243k; 46% above their basis — modest negotiation headroom, anchor on the comps not their cost.
Questions for the listing agent
- What do current leases actually rent for vs. the listed asking? Can we see a recent rent roll and the last 12 months of T-12 income?
- What does the HOA fee cover, when was the last increase, and are there any pending special assessments or reserve-fund shortfalls?
- Is there a deadline driving the sale (1031 exchange, divorce, estate, relocation)? That informs how much negotiation room exists.
- Schools are A-rated — typically a magnet for longer-tenancy family renters. What's the average tenant stay here, and is there a school-zone premium baked into asking?
- The area grade is low — what's the realistic commute time and amenity access for the typical tenant pool here? Any planned neighborhood developments (good or bad) we should know about?
- What's the average days-on-market for RENTAL listings here right now (not sales)? A rising rental-DOM trend means longer vacancies and softer asking-rent achievability than the comps imply.
- What's the recent tenant-quality profile in this submarket — average credit score on applications, eviction rate, late-payment / NSF rate, and stable-employment percentage? A property-management company in the area should have these aggregated.
- How much new for-sale + rental construction is in the pipeline within 1–3 miles? Heavy new supply typically softens prices + rents 12–24 months out; constrained supply supports both.
Investment metrics
- 1% rule
- 0.64% ✗
- Cap rate
- 4.66%
- Cash-on-cash
- -5.84%
- DSCR
- 0.74
- GRM
- 13.1
CMA / ARV
- ARV (on-the-fly)
- $370,279
- Comps found
- 12
Show comp detail 12 sales within ~0.75 mi
| Address | Dist | Beds/Ba | Sqft | Sold | Price | $/sf | Match |
|---|---|---|---|---|---|---|---|
| 1951 Tawney Ln | 0.09mi | 3/2.5 | 2,170 (-1%) | 8mo | $327,900 | $151 | 88 |
| 2068 S Avon Ave | 0.29mi | 4/2.0 (+1) | 2,161 (-1%) | 10mo | $374,000 | $173 | 69 |
| 7440 Oakview Dr | 0.23mi | 3/2.0 | 1,947 (-11%) | 0mo | $330,000 | $169 | 68 |
| 6670 Woodcrest Dr | 0.62mi | 3/2.5 | 2,241 (+2%) | 2mo | $396,515 | $177 | 65 |
| 2233 Burgundy Way | 0.43mi | 4/2.5 (+1) | 2,304 (+5%) | 11mo | $349,900 | $152 | 57 |
| 2434 Burgundy Way | 0.60mi | 4/2.5 (+1) | 2,299 (+5%) | 4mo | $360,000 | $157 | 55 |
| 2234 Burgundy Way | 0.44mi | 4/2.5 (+1) | 2,342 (+7%) | 11mo | $340,000 | $145 | 53 |
| 6915 Todd Rd | 0.56mi | 4/2.0 (+1) | 1,984 (-9%) | 4mo | $277,950 | $140 | 48 |
| 2339 Pine Valley Dr | 0.66mi | 4/3.0 (+1) | 2,278 (+4%) | 10mo | $407,000 | $179 | 47 |
| 2254 Oakmont Dr | 0.49mi | 4/3.0 (+1) | 1,961 (-10%) | 8mo | $404,900 | $206 | 46 |
| 7808 Grande Oaks Dr | 0.57mi | 4/3.0 (+1) | 1,961 (-10%) | 9mo | $390,000 | $199 | 42 |
| 6754 E County Road 150 S | 0.72mi | 2/2.0 (-1) | 1,944 (-11%) | 3mo | $275,000 | $141 | 38 |
Match score weights: distance 35% · size 25% · config 20% · recency 20%. Top-matched comps best support the ARV.
Projected returns pro-forma
-3.0% appreciation · 2.98% rent growth · sell at horizon
- IRR
- -26.4%
- Equity multiple
- 0.11×
- Total profit
- $-88,327
- Equity at exit
- $52,857
- IRR
- -23.6%
- Equity multiple
- -0.18×
- Total profit
- $-117,034
- Equity at exit
- $30,651
Cash invested: $99,260 (down + closing). Projections, not guarantees.
Landlord ↔ Tenant lean methodology
- Overall (STATE)
- 90 Strongly Landlord-Friendly
- State Indiana
- 90 Strongly Landlord-Friendly · R+11
- County
- — inherits STATE
- City
- — inherits STATE
ZIP-level market 46123
- Home prices YoY
- -21.3%
- Rents YoY
- 3.0%
- Active inventory
- 380
- Price-to-rent
- 13.1×
Monthly cashflow live
- Estimated rent
- $2,251 high interval (Pro) →
- Mortgage (P&I)
- −$1,859
- Tax from tax record
- −$233 /mo · $2,793/yr
- Insurance
- −$148
- HOA
- −$22
- Vacancy / Maint / Mgmt
- −$473
- Net cashflow
- $-483
Break-even live
Sensitivity live
| Price | -10% $-282 | -5% $-383 | +0% $-483 | +5% $-583 | +10% $-684 |
|---|---|---|---|---|---|
| Rent | -10% $-661 | -5% $-572 | +0% $-483 | +5% $-394 | +10% $-305 |
| Rate | -1.0pp $-304 | -0.5pp $-393 | base $-483 | +0.5pp $-575 | +1.0pp $-668 |
UW: 25.0% down · 7.5% · 30yr · 1.5% tax · 5.0% vac · 8.0% maint · 8.0% mgmt
Financing live
Cash to close
- Down payment
- $88,625
- Closing costs
- $10,635
- Reserves months
- —
- Total cash needed
- —
Loan-product check · same deal, 3 products live
Conventional
25% down · 7.5% · 30yr
- Down + closing
- —
- Monthly P&I
- —
- Monthly cashflow
- —
- DSCR
- —
- Eligible?
- —
Personal DTI + credit; lowest rate.
DSCR
20% down · 8.5% · 30yr
- Down + closing
- —
- Monthly P&I
- —
- Monthly cashflow
- —
- DSCR
- —
- Eligible?
- —
No personal income docs; deal must DSCR.
Hard money
10% down · 12.0% · 12mo
- Down + closing
- —
- Monthly P&I
- —
- Monthly cashflow
- —
- DSCR
- —
- Eligible?
- —
Short-term bridge; refi at stabilization.
Rent comps 8 comps
| Address | Beds | Baths | Sqft | Rent | $/sqft | DOM | Units | Dist |
|---|---|---|---|---|---|---|---|---|
| 7147 Governors Row Avon, IN | 3.0 | 3.5 | 2130 | $1,999 | $0.94 | 44d | 1 | 0.54mi |
| 6762 Auburn Ln Plainfield, IN | 4.0 | 2.5 | 2276 | $2,411 | $1.06 | 3d | 1 | 0.66mi |
| 8140 Elsen Rdg Avon, IN | 3.0 | 2.0 | 1506 | $2,049 | $1.36 | 22d | 1 | 1.02mi |
| 8325 Bluestem Ln Plainfield, IN | 4.0 | 2.5 | 2160 | $2,495 | $1.16 | 22d | 1 | 1.10mi |
| 8060 Clarks Creek Ct Avon, IN | 3.0 | 2.0 | 1643 | $2,125 | $1.29 | 44d | 1 | 1.10mi |
| 8060 Clarks Creek Ct Avon, IN | 3.0 | 2.0 | 1643 | $2,125 | $1.29 | 45d | 1 | 1.10mi |
| 8151 Lupine Dr Plainfield, IN | 3.0 | 2.5 | 2003 | $2,450 | $1.22 | 44d | 1 | 1.15mi |
| 6879 Merritt Ridge Way Avon, IN | 3.0 | 2.5 | 2857 | $2,210 | $0.77 | 24d | 1 | 1.33mi |
HOA detail
- Monthly dues
- $22 · $264/yr
Listing history 17 events
-
2026-06-03status $354,500 Pending 4 DOM
-
2026-06-02days on market $354,500 Active 4 DOM
-
2026-06-01days on market $354,500 Active 3 DOM
-
2026-05-31days on market $354,500 Active 2 DOM
-
2026-05-29$354,500 Active
-
2019-06-21soldstatus $243,000 Sold 437-char remark
Show marketing remark (437 chars)
THIS ONE HAS IT ALL! OPEN CONCEPT BOASTING FIVE BEDROOMS, OFFICE/GUEST ROOM ON MAIN, HUGE GREAT ROOM, RAISED CEILINGS, SUPER KITCHEN WITH STAINLESS APPLIANCES, ISLAND AND BREAKFAST BAR...ALL DESIGNED TO ENTERTAIN. MASTER SUITE WITH CATHEDRAL CEILING, GARDEN TUB AND WALK-IN CLOSET, 3 CAR GARAGE, & FENCED YARD. ALL THIS ON A TREE LINED CUL-DE-SAC LOT OVERLOOKING THE STOCKED POND. A GREAT HOUSE, ON A GREAT LOT, IN A GREAT LOCATION.
-
2019-05-17status Pending 437-char remark
Show marketing remark (437 chars)
THIS ONE HAS IT ALL! OPEN CONCEPT BOASTING FIVE BEDROOMS, OFFICE/GUEST ROOM ON MAIN, HUGE GREAT ROOM, RAISED CEILINGS, SUPER KITCHEN WITH STAINLESS APPLIANCES, ISLAND AND BREAKFAST BAR...ALL DESIGNED TO ENTERTAIN. MASTER SUITE WITH CATHEDRAL CEILING, GARDEN TUB AND WALK-IN CLOSET, 3 CAR GARAGE, & FENCED YARD. ALL THIS ON A TREE LINED CUL-DE-SAC LOT OVERLOOKING THE STOCKED POND. A GREAT HOUSE, ON A GREAT LOT, IN A GREAT LOCATION.
-
2019-05-06$244,900 Active 437-char remark
Show marketing remark (437 chars)
THIS ONE HAS IT ALL! OPEN CONCEPT BOASTING FIVE BEDROOMS, OFFICE/GUEST ROOM ON MAIN, HUGE GREAT ROOM, RAISED CEILINGS, SUPER KITCHEN WITH STAINLESS APPLIANCES, ISLAND AND BREAKFAST BAR...ALL DESIGNED TO ENTERTAIN. MASTER SUITE WITH CATHEDRAL CEILING, GARDEN TUB AND WALK-IN CLOSET, 3 CAR GARAGE, & FENCED YARD. ALL THIS ON A TREE LINED CUL-DE-SAC LOT OVERLOOKING THE STOCKED POND. A GREAT HOUSE, ON A GREAT LOT, IN A GREAT LOCATION.
-
2017-09-28soldstatus $220,000 Sold 498-char remark
Show marketing remark (498 chars)
You will love this move-in ready, 5 BR home with 3-car garage! This home sits at the end of a cul-de-sac, so NO TRAFFIC to be concerned with. You will love the fenced-in rear yard, complete with a mini-barn, a great view of the pond (stocked with fish) and mature trees. Large master BR with cathedral ceilings, garden tub and his/her walk-in closet. Large kitchen, dining room and family room. Office/bonus room and laundry room conveniently located downstairs. This is a rare find in Avon!!
-
2017-09-15status Pending 498-char remark
Show marketing remark (498 chars)
You will love this move-in ready, 5 BR home with 3-car garage! This home sits at the end of a cul-de-sac, so NO TRAFFIC to be concerned with. You will love the fenced-in rear yard, complete with a mini-barn, a great view of the pond (stocked with fish) and mature trees. Large master BR with cathedral ceilings, garden tub and his/her walk-in closet. Large kitchen, dining room and family room. Office/bonus room and laundry room conveniently located downstairs. This is a rare find in Avon!!
-
2017-08-23historical Active with Contingency 498-char remark
Show marketing remark (498 chars)
You will love this move-in ready, 5 BR home with 3-car garage! This home sits at the end of a cul-de-sac, so NO TRAFFIC to be concerned with. You will love the fenced-in rear yard, complete with a mini-barn, a great view of the pond (stocked with fish) and mature trees. Large master BR with cathedral ceilings, garden tub and his/her walk-in closet. Large kitchen, dining room and family room. Office/bonus room and laundry room conveniently located downstairs. This is a rare find in Avon!!
-
2017-08-21$220,000 Active 498-char remark
Show marketing remark (498 chars)
You will love this move-in ready, 5 BR home with 3-car garage! This home sits at the end of a cul-de-sac, so NO TRAFFIC to be concerned with. You will love the fenced-in rear yard, complete with a mini-barn, a great view of the pond (stocked with fish) and mature trees. Large master BR with cathedral ceilings, garden tub and his/her walk-in closet. Large kitchen, dining room and family room. Office/bonus room and laundry room conveniently located downstairs. This is a rare find in Avon!!
-
2011-05-23historical
-
2011-05-20soldstatus $166,300
-
2010-10-15$169,900
-
2006-05-12soldstatus $115,000
-
2006-02-03$120,000
ⓘ Source: listings_history table (triggers on properties + properties_extension) + one-shot
backfill from property_details.listing_events for pre-trigger history.
Tax reassessment forecast IN · Partial reset (capped growth)
- Current annual tax
- $2,793 · $233/mo
- Projected year-2 tax
- $2,903 · $242/mo
- Expected delta
- +$110/yr (+$9/mo · 3.9%)
ⓘ Screening estimate from a state-policy table — verify with the county assessor before closing.
Climate risk First Street
- Flood 1/10 Low FEMA zone X (unshaded) · 0% chance over 30 yrs
- Wildfire 1/10 Low
- Heat 3/10 Moderate 7 d/yr ≥101°F today · 19 d/yr by 30 yrs out
- Wind 2/10 Low 100% chance of damaging wind over 30 yrs
- Air quality 3/10 Moderate 2 unhealthy d/yr today · 3 by 30 yrs out
Nearby sold comps map
Loading sold comps map…
Walkable amenities ~0.75 mi
Loading nearby amenities…
Taxation est. · year 1
- Rental income
- $27,017
- − Mortgage interest
- −$19,858
- − Property taxes
- −$2,793
- − Insurance
- −$1,772
- − Repairs & maintenance
- −$2,161
- − Management
- −$2,161
- − HOA
- −$264
- − Depreciation
- −$10,313
- Taxable loss
- −$12,306
- Est. tax savings @ 24.0%
- +$2,953
- After-tax cash flow
- $-2,841/yr
For passive investors: Depreciation is non-cash, so a rental often shows a tax loss while cash-flowing — sheltering income. Rental losses are passive: they offset passive income freely, and up to $25,000/yr can offset ordinary (W-2) income if you actively participate and your MAGI is under $100k (phasing out to $0 by $150k); unused losses carry forward. On sale, claimed depreciation is recaptured at up to 25%, and gains may owe capital-gains tax (a 1031 exchange can defer both). Figures are a year-1 estimate at your 24.0% rate — not tax advice; consult a CPA.
Schools (NCES district)
- District
- Avon Community School Corporation
- NCES district ID
- 1800270
- Math proficiency
- 51% ▼ -8.00%
- Reading proficiency
- 53% ▼ -8.00%
- Median HH income
- $75,987
- Composite
- 46.93/100
- National rank
- #2362
- State rank
- #32 of 301 in IN
Livability — Avon
- Score
- 74/100
- State rank
- #75
- US rank
- #4686
Category grades
Schools grade is shown separately in the Schools card above.
Census & demographics
- County
- Hendricks County · 143,373 people
- City population
- 43,353
- Metro
- Indianapolis-Carmel-Anderson, IN
- Population (ZIP)
- 43,353
- Household income
- $103,485
- Rent vs Own
- Severe rent burden
- 529.0
Population outlook (Hendricks County) Hauer SSP2
- Today (2025)
- 187,418 people
- By 2030
- 201,494 · +7.5%
- By 2040
- 228,487 · +21.9%
- By 2050
- 253,068 · +35.0%
- By 2075
- 308,920 · +64.8%
- By 2100
- 336,510 · +79.6%
Race, ethnicity, and origin ACS 2023
- Neighborhood character
- Predominantly White (74%)
- Race & ethnicity
- White 74% Black 12% Hispanic / Latino 7% Two or more races 6% Asian 4%
- Hispanic origin (detail)
- Mexican 2%
- Common ancestry
- Slovak 3% Romanian 2% Italian 1%
- Foreign-born
- 6% · Canada, South Korea
- Languages at home
- 92% English-only · Spanish 4% Other Indo-European 2%
Political lean MEDSL · Hendricks
- 2024 margin
- Strong R (+21.5) · D 38.4% · R 59.9% · Other 1.7%
- 2008→2024 swing
- +1.9pp toward D · 2008: -23.4pp · 2024: -21.5pp
- All cycles
- 2024: R+21.5 2020: R+23.9 2016: R+34.2 2012: R+34.9 2008: R+23.4
Not yet ingested
- Civics
- —
Market trends
- HPI YoY
- ▼ -55.05%
- Current HPI
- 203.9226
- Rent YoY
- ▲ 2.98%
- Metro
- Indianapolis-Carmel-Anderson, IN
- State GDP YoY
- ▲ 2.90%
- F500 in state
- 18
Industry mix (Fortune 500 HQ in IN)
| Industry | F500 HQs | Revenue |
|---|---|---|
| Industrial Machinery | 2 | $37B |
|
||
| Healthcare | 1 | $177B |
|
||
| Pharmaceuticals | 1 | $45B |
|
||
| Metals / Steel | 1 | $18B |
|
||
| Agriculture | 1 | $17B |
|
||
| Packaging | 1 | $12B |
|
||
Price history
+195.4% since first listed13 events — show timeline
- 2026-05-29 Listed $354,500 MIBOR as Distributed by MLS Grid
- 2019-06-21 Sold (MLS) $243,000 MIBOR as Distributed by MLS Grid
- 2019-05-17 Pending — MIBOR as Distributed by MLS Grid
- 2019-05-06 Listed $244,900 MIBOR as Distributed by MLS Grid
- 2017-09-28 Sold (MLS) $220,000 MIBOR as Distributed by MLS Grid
- 2017-09-15 Pending — MIBOR as Distributed by MLS Grid
- 2017-08-23 Contingent — MIBOR as Distributed by MLS Grid
- 2017-08-21 Listed $220,000 MIBOR as Distributed by MLS Grid
- 2011-05-23 Listing Removed — MIBOR as Distributed by MLS Grid
- 2011-05-20 Sold (MLS) $166,300 MIBOR as Distributed by MLS Grid
- 2010-10-15 Listed $169,900 MIBOR as Distributed by MLS Grid
- 2006-05-12 Sold (MLS) $115,000 MIBOR as Distributed by MLS Grid
- 2006-02-03 Listed $120,000 MIBOR as Distributed by MLS Grid
Property tax history
+5.2%/yrLatest (2025): $2,793 · +6.6% YoY. Source: county tax records.
Cash-flow waterfall
monthlySold comps — $/sqft
last 12 mo · ≤1 miLoading sold comps…