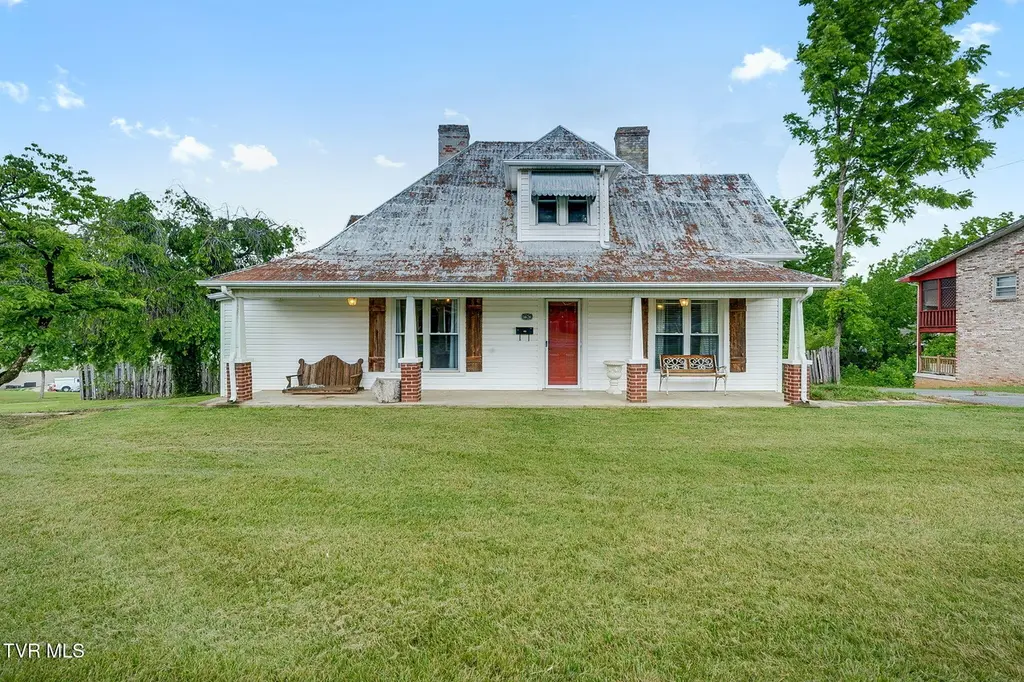
1404 Skyline Dr · Johnson City, TN
Flood risk 1/10 · Minimal
- FEMA flood zone
- X (unshaded)
- Chance of flooding over 30 yrs
- 0.0%
- Est. flood insurance / yr
- $507 – $1,088
Fire risk 1/10 · Minimal
- Est. fire insurance / yr
- $949 – $1,763
Heat risk 4/10 · Minor
- Hot days now (above 98°F)
- 7 days/yr
- Hot days in 30 yrs
- 20 days/yr
Wind risk 2/10 · Minimal
- Chance of severe wind over 30 yrs
- —
Air-quality risk 2/10 · Minimal
- Unhealthy air days now
- 1 days/yr
- Unhealthy air days in 30 yrs
- 1 days/yr
Risk factors via First Street. Map © Google.
Why this score? — see what drove the C- grade
The composite is a weighted blend of 9 inputs, each scored 0–100. Each bar is that input's sub-score; the figure is the points it added to the 100-point composite (weight × sub-score).
- Cash flow +15.7/30.0
- ARV discount +15.0/15.0
- DSCR +4.8/10.0
- Schools +3.9/10.0
- Livability +3.8/5.0
- 1% rule +3.2/10.0
- Rent growth +2.9/5.0
- Condition / age +2.5/5.0
- Appreciation +0.0/10.0
$225,000
🖨 Deal sheet (PDF) 📄 Offer letter ✓ Due diligence
Listing remarks
Welcome Home to this 3 bedroom, 2 bath home in a central Johnson City location. Primary bedroom and bath on the main level, a side room that would make a great office or hobby/craft room, and a gorgeous over sized screened in porch make this a must see! Covered front porch and a huge detached garage with space above for a man-cave or storage means there is room for everyone. Home is being sold AS IS. All herein deemed reliable but not guaranteed. Buyer/Buyer's agent to verify.
Key facts
- Covered front porch
- Detached garage
- 0.38 acre lot
Tags
Property features AI
Finance
- HOA & community: Landscaping maintained by association
Exterior
- Parking: Detached concrete garage; 2 garage spaces
- Utilities: Public water; Public sewer
- Home design: Single-family house; Two levels; Residential property; Zoned R-4
- Construction: Frame and plaster construction
- Exterior features: Covered front and rear porches; Screened porch; Back yard fencing; Metal roof; Level lot; 110 x 150 lot dimensions; Garage(s) and storage structures
Interior
- Kitchen: Dishwasher; Gas range; Microwave; Refrigerator
- Flooring: Carpet; Hardwood
- Bathrooms: Two full bathrooms
- Heating & cooling: Central heating; Central air conditioning
- Interior features: Eat-in kitchen; Laminate countertops; Pantry; Double-pane windows; Window treatments
Neighborhood map
What this means for you Summary
Snapshot
- This is a 3-bed/1.0-bath single-family listed at $225k.
Deal economics
- At list price, monthly cash flow is $97 ($1k/yr) — positive.
- The deal already cash-flows at list — no discount required.
- To meet the 1% rule (rent ≥ 1% of price), the offer needs to be $185k (17.8% below list).
- Recommended offer: $185k (17.8% below list) — sets the bar for 1% rule.
- Cap rate 6.8% vs local median 3.1% in Johnson City — top-decile yield for the area; either an underpriced asset or a hidden risk that comps aren't pricing in. Stress-test before assuming the spread holds.
Location & tenants
- Location reads 76/100 on livability (#8 in TN, #3,349 nationally) — a middle-class / working-renter tenant base. Strengths: amenities A+, cost of living A+, health & safety A; Watch: crime D, commute F, employment F.
- Johnson City (urban): math 46% / reading 47% proficiency, ranked #9 of 139 in TN (top 6%) — families likely to look elsewhere, expect single-tenant / working-renter base with shorter leases.
- Zoned schools: Woodland Elementary (math 52% / reading 62%, grade C+, #75 of 952 statewide, top 8%, 522 students, 0% FRL); Liberty Bell Middle School (math 43% / reading 38%, grade F, #42 of 333 statewide, top 13%, 898 students, 0% FRL); Science Hill High School (math 37% / reading 60%, grade D, #13 of 332 statewide, top 4%, 2,401 students, 0% FRL) — zoned schools average 0% FRL vs 44% district-wide (44 pts lower); this property's tenant base skews higher-income than the district average.
- Market conditions: Rents rising (+1.5%/yr); 208 active listings in the ZIP; 4 comparable units currently listed for rent nearby; rentals lingering (median 46d on market — plan ~5-8 weeks vacancy on turnover, expect pricing pressure); 75% of comp listings sitting > 30 days — soft ceiling on asking rent; 1,155 units permitted in Washington County in 2024 (437 in 5+ unit buildings).
- This rent runs 42% of the median local income ($52k/yr) — at the standard rent-burdened threshold; future hikes will face affordability resistance.
Forward outlook
- Local home prices are declining (-3.0%/yr); year-one equity from $2k of loan paydown is wiped out by about $7k of value loss. Plan a longer hold.
- Washington County population projected at +9% by 2050 — modest demand growth; plan on rents tracking national, not racing it.
Negotiation context
- Only 4 days on market — expect competitive offers; lowballing is unlikely to land.
- Current owner paid $136k; list at $225k implies a 66% gain — meaningful room to come down on a strong offer.
Risks & watch-outs
- Watch-outs: built in 1935 — expect roof / HVAC / electrical / plumbing capex.
Questions for the listing agent
- Built in 1935 — when were the roof, HVAC, electrical panel, plumbing, and water heater last replaced?
- Is there a deadline driving the sale (1031 exchange, divorce, estate, relocation)? That informs how much negotiation room exists.
- Crime grade is D in this area — have there been break-ins, vandalism, or insurance claims at this property in the last 3 years? What carrier currently insures it and at what premium?
- What's the average days-on-market for RENTAL listings here right now (not sales)? A rising rental-DOM trend means longer vacancies and softer asking-rent achievability than the comps imply.
- What's the recent tenant-quality profile in this submarket — average credit score on applications, eviction rate, late-payment / NSF rate, and stable-employment percentage? A property-management company in the area should have these aggregated.
- How much new for-sale + rental construction is in the pipeline within 1–3 miles? Heavy new supply typically softens prices + rents 12–24 months out; constrained supply supports both.
Investment metrics
- 1% rule
- 0.82% ✗
- Cap rate
- 6.81%
- Cash-on-cash
- 1.85%
- DSCR
- 1.08
- GRM
- 10.1
CMA / ARV
- ARV (on-the-fly)
- $322,168
- Comps found
- 5
Show comp detail 5 sales within ~0.75 mi
| Address | Dist | Beds/Ba | Sqft | Sold | Price | $/sf | Match |
|---|---|---|---|---|---|---|---|
| 818 Guaranda Dr #202 | 0.47mi | 3/2.0 | 2,078 (-1%) | 1mo | $610,000 | $294 | 72 |
| 1721 Skyline Dr #303 | 0.35mi | 3/3.0 | 2,112 (+1%) | 10mo | $285,000 | $135 | 65 |
| 604 Willowood Dr. Dr | 0.74mi | 3/2.5 | 1,987 (-5%) | 4mo | $330,000 | $166 | 48 |
| 1804 Indian Ridge Rd | 0.29mi | 4/2.0 (+1) | 1,799 (-14%) | 24mo | $270,000 | $150 | 34 |
| 1022 Knob Creek Rd. Rd | 0.68mi | 4/2.0 (+1) | 1,821 (-13%) | 16mo | $280,000 | $154 | 24 |
Match score weights: distance 35% · size 25% · config 20% · recency 20%. Top-matched comps best support the ARV.
Projected returns pro-forma
-3.0% appreciation · 1.51% rent growth · sell at horizon
- IRR
- -14.9%
- Equity multiple
- 0.47×
- Total profit
- $-33,086
- Equity at exit
- $33,548
- IRR
- -8.7%
- Equity multiple
- 0.49×
- Total profit
- $-32,078
- Equity at exit
- $19,454
Cash invested: $63,000 (down + closing). Projections, not guarantees.
Landlord ↔ Tenant lean methodology
- Overall (STATE)
- 87 Strongly Landlord-Friendly
- State Tennessee
- 87 Strongly Landlord-Friendly · R+13
- County
- — inherits STATE
- City
- — inherits STATE
ZIP-level market 37604
- Home prices YoY
- -26.1%
- Rents YoY
- 1.5%
- Active inventory
- 208
- Price-to-rent
- 10.1×
Monthly cashflow live
- Estimated rent
- $1,850 medium interval (Pro) →
- Mortgage (P&I)
- −$1,180
- Tax from tax record
- −$91 /mo · $1,088/yr
- Insurance
- −$94
- HOA
- −$0
- Vacancy / Maint / Mgmt
- −$389
- Net cashflow
- $97
Break-even live
Sensitivity live
| Price | -10% $225 | -5% $161 | +0% $97 | +5% $34 | +10% $-30 |
|---|---|---|---|---|---|
| Rent | -10% $-49 | -5% $24 | +0% $97 | +5% $170 | +10% $243 |
| Rate | -1.0pp $211 | -0.5pp $155 | base $97 | +0.5pp $39 | +1.0pp $-20 |
UW: 25.0% down · 7.5% · 30yr · 1.5% tax · 5.0% vac · 8.0% maint · 8.0% mgmt
Financing live
Cash to close
- Down payment
- $56,250
- Closing costs
- $6,750
- Reserves months
- —
- Total cash needed
- —
Loan-product check · same deal, 3 products live
Conventional
25% down · 7.5% · 30yr
- Down + closing
- —
- Monthly P&I
- —
- Monthly cashflow
- —
- DSCR
- —
- Eligible?
- —
Personal DTI + credit; lowest rate.
DSCR
20% down · 8.5% · 30yr
- Down + closing
- —
- Monthly P&I
- —
- Monthly cashflow
- —
- DSCR
- —
- Eligible?
- —
No personal income docs; deal must DSCR.
Hard money
10% down · 12.0% · 12mo
- Down + closing
- —
- Monthly P&I
- —
- Monthly cashflow
- —
- DSCR
- —
- Eligible?
- —
Short-term bridge; refi at stabilization.
Rent comps 4 comps
| Address | Beds | Baths | Sqft | Rent | $/sqft | DOM | Units | Dist |
|---|---|---|---|---|---|---|---|---|
| 901 Johnson Ave Johnson City, TN | 3.0 | 2.0 | 1670 | $1,850 | $1.11 | 22d | 1 | 0.69mi |
| 700 Antioch Rd Johnson City, TN | 3.0 | 2.0 | 1500 | $1,900 | $1.27 | 45d | 1 | 1.36mi |
| 2802 W Walnut St #5 Johnson City, TN | 2.0 | 2.5 | 1500 | $1,900 | $1.27 | 45d | 1 | 1.36mi |
| 2802 W Walnut St #6 Johnson City, TN | 2.0 | 3.0 | 1500 | $1,800 | $1.20 | 45d | 1 | 1.36mi |
Listing history 8 events
-
2026-06-01statusdays on market $225,000 Pending 4 DOM
-
2026-05-31days on market $225,000 Active 3 DOM
-
2026-05-30days on market $225,000 Active 2 DOM
-
2026-05-28$225,000 Active
-
2011-10-25soldstatus $135,900
-
2008-06-16soldstatus $119,900
-
1981-06-15soldstatus $23,500
-
1981-06-01soldstatus $28,000
ⓘ Source: listings_history table (triggers on properties + properties_extension) + one-shot
backfill from property_details.listing_events for pre-trigger history.
Tax reassessment forecast TN · Resets to sale price
- Current annual tax
- $1,088 · $91/mo
- Projected year-2 tax
- $1,598 · $133/mo
- Expected delta
- +$510/yr (+$42/mo · 46.8%)
ⓘ Screening estimate from a state-policy table — verify with the county assessor before closing.
Climate risk First Street
- Flood 1/10 Low FEMA zone X (unshaded) · 0% chance over 30 yrs
- Wildfire 1/10 Low
- Heat 4/10 Moderate 7 d/yr ≥98°F today · 20 d/yr by 30 yrs out
- Wind 2/10 Low
- Air quality 2/10 Low 1 unhealthy d/yr today · 1 by 30 yrs out
Nearby sold comps map
Loading sold comps map…
Walkable amenities ~0.75 mi
Loading nearby amenities…
Taxation est. · year 1
- Rental income
- $22,202
- − Mortgage interest
- −$12,603
- − Property taxes
- −$1,088
- − Insurance
- −$1,125
- − Repairs & maintenance
- −$1,776
- − Management
- −$1,776
- − Depreciation
- −$6,545
- Taxable loss
- −$2,712
- Est. tax savings @ 24.0%
- +$651
- After-tax cash flow
- $1,818/yr
For passive investors: Depreciation is non-cash, so a rental often shows a tax loss while cash-flowing — sheltering income. Rental losses are passive: they offset passive income freely, and up to $25,000/yr can offset ordinary (W-2) income if you actively participate and your MAGI is under $100k (phasing out to $0 by $150k); unused losses carry forward. On sale, claimed depreciation is recaptured at up to 25%, and gains may owe capital-gains tax (a 1031 exchange can defer both). Figures are a year-1 estimate at your 24.0% rate — not tax advice; consult a CPA.
Schools (NCES district)
- District
- Johnson City
- NCES district ID
- 4702130
- Math proficiency
- 46% ▼ -14.00%
- Reading proficiency
- 47% ▼ -2.00%
- Median HH income
- $37,514
- Composite
- 38.69/100
- National rank
- #4143
- State rank
- #9 of 139 in TN
Livability — Johnson City
- Score
- 76/100
- State rank
- #8
- US rank
- #3349
Category grades
Schools grade is shown separately in the Schools card above.
Census & demographics
- Census place
- Johnson City, TN
- County
- Washington County · 129,006 people
- City population
- 99,926
- Metro
- Johnson City, TN
- Population (ZIP)
- 39,097
- Household income
- $52,345
- Rent vs Own
- Severe rent burden
- 2254.0
Population outlook (Washington County) Hauer SSP2
- Today (2025)
- 132,816 people
- By 2030
- 135,823 · +2.3%
- By 2040
- 140,897 · +6.1%
- By 2050
- 145,073 · +9.2%
- By 2075
- 156,386 · +17.7%
- By 2100
- 159,893 · +20.4%
Race, ethnicity, and origin ACS 2023
- Neighborhood character
- Predominantly White (83%)
- Race & ethnicity
- White 83% Hispanic / Latino 6% Black 6% Two or more races 5% Asian 1%
- Hispanic origin (detail)
- Mexican 3%
- Common ancestry
- Slovak 3% Serbian 3% Italian 3%
- Foreign-born
- 4% · Canada
- Languages at home
- 94% English-only · Spanish 4% Other Indo-European 1%
Political lean MEDSL · Washington
- 2024 margin
- Solid R (+39.5) · D 29.6% · R 69.1% · Other 1.3%
- 2008→2024 swing
- -6.0pp toward R · 2008: -33.5pp · 2024: -39.5pp
- All cycles
- 2024: R+39.5 2020: R+36.2 2016: R+42.9 2012: R+38.5 2008: R+33.5
Not yet ingested
- Civics
- —
Market trends
- HPI YoY
- ▼ -97.73%
- Current HPI
- 277.1137
- Rent YoY
- ▲ 1.51%
- Metro
- Johnson City, TN
- State GDP YoY
- ▲ 2.78%
- F500 in state
- 22
Industry mix (Fortune 500 HQ in TN)
| Industry | F500 HQs | Revenue |
|---|---|---|
| Healthcare | 3 | $91B |
|
||
| Retail | 3 | $72B |
|
||
| Transportation / Logistics | 1 | $88B |
|
||
| Paper / Packaging | 1 | $19B |
|
||
| Insurance | 1 | $13B |
|
||
| Energy | 1 | $12B |
|
||
Price history
+703.6% since first listed5 events — show timeline
- 2026-05-28 Listed $225,000 TVRMLS
- 2011-10-25 Sold (Public Records) $135,900 Public Records
- 2008-06-16 Sold (Public Records) $119,900 Public Records
- 1981-06-15 Sold (Public Records) $23,500 Public Records
- 1981-06-01 Sold (Public Records) $28,000 Public Records
Property tax history
-0.1%/yrLatest (2025): $1,088 · +0.0% YoY. Source: county tax records.
Cash-flow waterfall
monthlySold comps — $/sqft
last 12 mo · ≤1 miLoading sold comps…