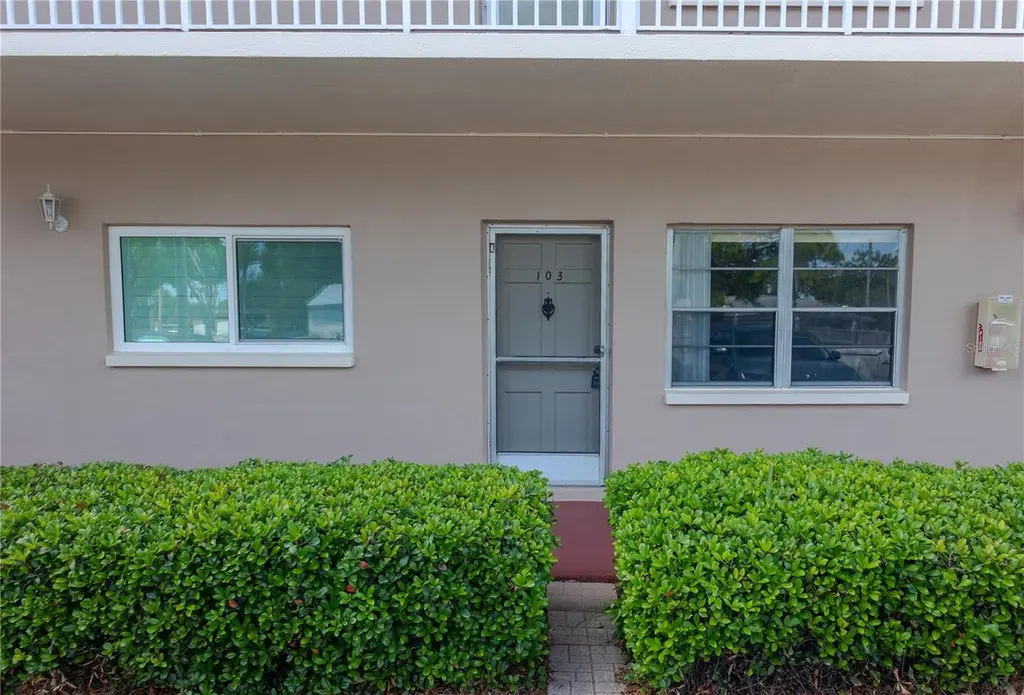
6645 1st Ave N #103 · St. Petersburg, FL
Flood risk 1/10 · Minimal
- FEMA flood zone
- X (unshaded)
- Chance of flooding over 30 yrs
- 0.0%
- Est. flood insurance / yr
- $507 – $1,088
Fire risk 1/10 · Minimal
- Est. fire insurance / yr
- $947 – $1,759
Heat risk 10/10 · Severe
- Hot days now (above 106°F)
- 7 days/yr
- Hot days in 30 yrs
- 25 days/yr
Wind risk 10/10 · Severe
- Chance of severe wind over 30 yrs
- 99.0%
Air-quality risk 4/10 · Minor
- Unhealthy air days now
- 4 days/yr
- Unhealthy air days in 30 yrs
- 4 days/yr
Risk factors via First Street. Map © Google.
Why this score? — see what drove the B- grade
The composite is a weighted blend of 9 inputs, each scored 0–100. Each bar is that input's sub-score; the figure is the points it added to the 100-point composite (weight × sub-score).
- Cash flow +30.0/30.0
- 1% rule +10.0/10.0
- DSCR +10.0/10.0
- ARV discount +7.5/15.0
- Schools +4.3/10.0
- Livability +2.5/5.0
- Condition / age +2.5/5.0
- Rent growth +2.4/5.0
- Appreciation +0.0/10.0
$85,000
🖨 Deal sheet 📄 Offer letter ✓ Due diligence
Listing remarks
WELCOME HOME! Rare opportunity to own in a highly desirable West St. Pete location just minutes to the Gulf beaches & vibrant Downtown St. Petersburg! This 1st-floor condo offers ultimate convenience with easy access & a comfortable layout, ready for your personal updates & design touches. Located in a quiet, well-maintained 55+ community with low HOA dues, this is the perfect option for year-round living or a seasonal retreat. Enjoy a central “hub” location close to shopping, dining, & everyday essentials. Whether you’re looking for affordability, proximity to the beach, or a peaceful lifestyle—this home checks all the boxes. Water is included
Key facts
- Gulf beaches
- Central hub location
- 1st floor condo
Tags
Property features AI
Finance
- Other: Irrigation equipment; Third-party listing
- Financial info: Lease restrictions apply
- HOA & community: Monthly condo fee of $559; Annual association fees approximately $6,708; Association approval required; Association name: Condominium Manager; Senior community; No pets allowed; Condo fees paid monthly
Exterior
- Utilities: Public water; Public sewer; Cable available; Electricity connected; Natural gas available; Public utilities
- Home design: Condominium; Single-story; Faces east; Floor 1
- Construction: Block construction; Other roof; Block foundation; Built as part of Parc Vendome
- Exterior features: Outdoor grill; Private mailbox; Sidewalk; Storage
Interior
- Kitchen: Convection oven; Dishwasher; Range; Refrigerator
- Bedrooms: 1 bedroom
- Flooring: Carpet
- Bathrooms: 1 full bathroom
- Heating & cooling: Central heating; Central air conditioning
- Interior features: Eat-in kitchen; Walk-in closet(s); Other interior features
- Laundry & utility: Common area laundry
Neighborhood map
What this means for you Summary
Snapshot
- This is a 1-bed/1.0-bath condo listed at $85k.
Deal economics
- At list price, monthly cash flow is $470 ($6k/yr) — positive.
- The deal already cash-flows at list — no discount required.
- Meets the 1% rule at list price ($2k rent vs $85k).
- Recommended offer: $82k (3.0% below list) — sets the bar for market timing.
- Cap rate 12.9% vs local median 2.6% in St. Petersburg — top-decile yield for the area; either an underpriced asset or a hidden risk that comps aren't pricing in. Stress-test before assuming the spread holds.
Location & tenants
- Location reads: area grade B — affects rentability + tenant quality, not the cash-flow math above.
- Pinellas (suburban): math 51% / reading 51% proficiency, ranked #31 of 73 in FL (top 42%) — acceptable for families but not a draw, mixed tenant base, ~2y average lease.
- Zoned schools: Azalea Elementary School (math 57% / reading 52%, grade C, #892 of 2,144 statewide, top 44%, 507 students, 60% FRL); Boca Ciega High School (math 24% / reading 33%, grade F, #458 of 667 statewide, top 69%, 1,423 students, 64% FRL).
- Market conditions: Rents soft (-0.5%/yr); 313 active listings in the ZIP; 40 comparable units currently listed for rent nearby; rentals at typical pace (median 14d on market — plan ~3-4 weeks tenant-placement turnaround); solid renter incomes; 2,676 units permitted in Pinellas County in 2024 (1,422 in 5+ unit buildings).
Forward outlook
- Local home prices are declining (-3.0%/yr); year-one equity from $588 of loan paydown is wiped out by about $3k of value loss. Plan a longer hold.
- Pinellas County population projected at +14% by 2050 — modest demand growth; plan on rents tracking national, not racing it.
- At projected returns (-3.0% appreciation + 0.0% rent growth), your $24k cash investment doubles in ~7 years — after that, you're playing with house money.
Negotiation context
- It's been on market 52 days — a 3% lower offer ($82k) is reasonable based on typical stale-listing flexibility.
- Current owner paid $30k; list at $85k implies a 184% gain — meaningful room to come down on a strong offer.
Risks & watch-outs
- Watch-outs: HOA is 23% of rent.
- Climate carrying-cost: severe wind risk, 99% chance of damaging wind over 30y; extreme-heat days projected 7→25/yr by 2055 (HVAC capex compounding) — expect insurance premiums to compound above CPI over the hold.
Questions for the listing agent
- It's been on market 52 days. Have you received any prior offers? Is the seller open to a 3% concession, seller financing, or rate buy-down credit?
- Built in 1967 — when were the roof, HVAC, electrical panel, plumbing, and water heater last replaced?
- What does the HOA fee cover, when was the last increase, and are there any pending special assessments or reserve-fund shortfalls?
- Any open or pending special assessments — roof, HVAC, plumbing, elevator, façade? What's the per-unit balance and payoff schedule, and is the seller paying it off at close or rolling it to the buyer?
- Is there a deadline driving the sale (1031 exchange, divorce, estate, relocation)? That informs how much negotiation room exists.
- What's the average days-on-market for RENTAL listings here right now (not sales)? A rising rental-DOM trend means longer vacancies and softer asking-rent achievability than the comps imply.
- What's the recent tenant-quality profile in this submarket — average credit score on applications, eviction rate, late-payment / NSF rate, and stable-employment percentage? A property-management company in the area should have these aggregated.
- How much new apartment / multifamily construction is in the pipeline within 1–3 miles? Heavy new supply (>2% of stock underway) typically softens rents 12–24 months out; light construction supports rent growth.
Investment metrics
- 1% rule
- 2.02% ✓
- Cap rate
- 12.93%
- Cash-on-cash
- 23.71%
- DSCR
- 2.05
- GRM
- 4.1
CMA / ARV
No comps found within radius.
Projected returns pro-forma
-3.0% appreciation · 0.0% rent growth · sell at horizon
- IRR
- 12.6%
- Equity multiple
- 1.48×
- Total profit
- $11,345
- Equity at exit
- $12,674
- IRR
- 18.3%
- Equity multiple
- 2.25×
- Total profit
- $29,815
- Equity at exit
- $7,349
Cash invested: $23,800 (down + closing). Projections, not guarantees.
Landlord ↔ Tenant lean methodology
- Overall (STATE)
- 87 Strongly Landlord-Friendly
- State Florida
- 87 Strongly Landlord-Friendly · R+3
- County
- — inherits STATE
- City
- — inherits STATE
ZIP-level market 33710
- Rents YoY
- -0.5%
- Active inventory
- 313
- Price-to-rent
- 4.1×
Monthly cashflow live
- Estimated rent
- $1,721 high interval (Pro) →
- Mortgage (P&I)
- −$446
- Tax from tax record
- −$15 /mo · $178/yr
- Insurance
- −$35
- HOA
- −$393
- Vacancy / Maint / Mgmt
- −$361
- Net cashflow
- $470
Break-even live
UW: 25.0% down · 7.5% · 30yr · 1.5% tax · 5.0% vac · 8.0% maint · 8.0% mgmt
Financing live
Cash to close
- Down payment
- $21,250
- Closing costs
- $2,550
- Reserves months
- —
- Total cash needed
- —
Loan-product check · same deal, 3 products live
Conventional
25% down · 7.5% · 30yr
- Down + closing
- —
- Monthly P&I
- —
- Monthly cashflow
- —
- DSCR
- —
- Eligible?
- —
Personal DTI + credit; lowest rate.
DSCR
20% down · 8.5% · 30yr
- Down + closing
- —
- Monthly P&I
- —
- Monthly cashflow
- —
- DSCR
- —
- Eligible?
- —
No personal income docs; deal must DSCR.
Hard money
10% down · 12.0% · 12mo
- Down + closing
- —
- Monthly P&I
- —
- Monthly cashflow
- —
- DSCR
- —
- Eligible?
- —
Short-term bridge; refi at stabilization.
Rent comps 40 comps
| Address | Beds | Baths | Sqft | Rent | $/sqft | DOM | Units | Dist |
|---|---|---|---|---|---|---|---|---|
| 6700 1st Ave S #211 Saint Petersburg, FL | 2.0 | 1.0 | 755 | $1,575 | $2.09 | 24d | 1 | 0.23mi |
| 6565 5th Ave S Saint Petersburg, FL | 1.0–2.0 | 1.0–2.0 | 730 | $1,495 | $2.05 | 24d | 1 | 0.38mi |
| 6256 3rd Ave S Saint Petersburg, FL | 1.0 | 1.0 | 600 | $1,749 | $2.92 | 24d | 1 | 0.54mi |
| 7321 Central Ave #202 Saint Petersburg, FL | 1.0 | 1.0 | 765 | $1,650 | $2.16 | 3d | 1 | 0.67mi |
| 555 62nd St S Unit 103 St. Petersburg, FL | 1.0 | 1.0 | 640 | $1,375 | $2.15 | 24d | 1 | 0.67mi |
| 555 62nd St S Unit 110 St. Petersburg, FL | 2.0 | 2.0 | 960 | $1,735 | $1.81 | 14d | 1 | 0.67mi |
| 555 62nd St S Unit 102 St. Petersburg, FL | 1.0 | 1.0 | 640 | $1,300 | $2.03 | 14d | 1 | 0.67mi |
| 6262 Emerson Ave S Saint Petersburg, FL | 2.0 | 2.0 | 960 | $1,500 | $1.56 | 14d | 1 | 0.67mi |
| 1100 70th St N Unit 4 St. Petersburg, FL | 1.0 | 1.0 | 700 | $1,125 | $1.61 | 3d | 1 | 0.86mi |
| 5919 4th Ave N Saint Petersburg, FL | 2.0 | 1.0 | 1053 | $2,650 | $2.52 | 4d | 1 | 0.90mi |
| 6931 Hibiscus Ave S Unit 3 South Pasadena, FL | 2.0 | 1.0 | 789 | $1,800 | $2.28 | 24d | 1 | 0.90mi |
| 1240 70th St N Unit 7 St. Petersburg, FL | 1.0 | 1.0 | 725 | $1,300 | $1.79 | 24d | 1 | 0.94mi |
| 1240 70th St N #9 St. Petersburg, FL | 1.0 | 1.0 | 725 | $1,275 | $1.76 | 20d | 1 | 0.94mi |
| 1260 70th St N Unit 3 St. Petersburg, FL | 1.0 | 1.0 | 725 | $1,275 | $1.76 | 14d | 1 | 0.96mi |
| 1260 70th St N Unit 3 St. Petersburg, FL | 1.0 | 1.0 | 725 | $1,275 | $1.76 | 14d | 1 | 0.96mi |
| 5991 Fairfield Ave S Unit 4 St. Petersburg, FL | 1.0 | 1.0 | 690 | $1,600 | $2.32 | 24d | 1 | 0.97mi |
| 641 Folsom St S Saint Petersburg, FL | 2.0 | 1.0 | 852 | $2,250 | $2.64 | 22d | 1 | 0.97mi |
| 1153 Rue des Rois Unit 1B South Pasadena, FL | 2.0 | 2.0 | 960 | $2,200 | $2.29 | 24d | 1 | 1.03mi |
| 1140 Rue des Rois #1140 South Pasadena, FL | 2.0 | 1.5 | 1045 | $1,995 | $1.91 | 24d | 1 | 1.04mi |
| 5762 2nd Ave N Saint Petersburg, FL | 2.0 | 1.0 | 843 | $2,000 | $2.37 | 4d | 1 | 1.04mi |
| 810 Tyrone Blvd N Unit G-2 St. Petersburg, FL | 1.0 | 1.0 | 600 | $1,195 | $1.99 | 24d | 1 | 1.05mi |
| 1308 70th St N Unit 1308 St. Petersburg, FL | 2.0 | 1.5 | 1100 | $2,500 | $2.27 | 24d | 1 | 1.06mi |
| 1130 Rue Des Chateaux South Pasadena, FL | 2.0 | 2.0 | 960 | $1,949 | $2.03 | 7d | 1 | 1.06mi |
| 1130 Rue Des Chateaux South Pasadena, FL | 2.0 | 2.0 | 960 | $1,949 | $2.03 | 11d | 1 | 1.06mi |
| 1195 Rue des Chateaux Unit 1B South Pasadena, FL | 1.0 | 1.0 | 720 | $1,850 | $2.57 | 4d | 1 | 1.08mi |
| 6950 Avenue des Palais Unit 2A South Pasadena, FL | 1.0 | 1.0 | 720 | $1,650 | $2.29 | 22d | 1 | 1.12mi |
| 1316 Pasadena Ave S #202 South Pasadena, FL | 2.0 | 2.0 | 1030 | $2,300 | $2.23 | 4d | 1 | 1.13mi |
| 1316 Pasadena Ave S #204 South Pasadena, FL | 1.0 | 1.5 | 875 | $1,900 | $2.17 | 4d | 1 | 1.13mi |
| 5821 8th Ave N Unit 203 St. Petersburg, FL | 1.0 | 1.0 | 635 | $1,195 | $1.88 | 24d | 1 | 1.14mi |
| 1320 Pasadena Ave S #203 South Pasadena, FL | 2.0 | 2.0 | 1030 | $2,600 | $2.52 | 4d | 1 | 1.15mi |
| 1699 68th St N Saint Petersburg, FL | 3.0 | 1.0–2.0 | 775 | $1,661 | $2.14 | 2d | 43 | 1.16mi |
| 6810 Stones Throw Cir N #13203 Saint Petersburg, FL | 2.0 | 2.0 | 905 | $2,100 | $2.32 | 4d | 1 | 1.20mi |
| 1324 Pasadena Ave S #205 South Pasadena, FL | 1.0 | 1.5 | 875 | $1,695 | $1.94 | 4d | 1 | 1.20mi |
| 6908 Stones Throw Cir N #10208 Saint Petersburg, FL | 2.0 | 1.5 | 730 | $1,900 | $2.60 | 14d | 1 | 1.24mi |
| 5545 3rd Ave N Saint Petersburg, FL | 2.0 | 1.0 | 962 | $2,400 | $2.49 | 4d | 1 | 1.24mi |
| 1328 Pasadena Ave S #206 South Pasadena, FL | 2.0 | 2.0 | 1100 | $2,700 | $2.45 | 24d | 1 | 1.25mi |
| 7125 14th Ave S South Pasadena, FL | 2.0 | 2.0 | 1000 | $2,000 | $2.00 | 4d | 1 | 1.29mi |
| 5521 5th Ave N Saint Petersburg, FL | 2.0 | 1.0 | 952 | $1,750 | $1.84 | 4d | 1 | 1.30mi |
| 430 55th St N Saint Petersburg, FL | 2.0 | 1.5 | 735 | $1,850 | $2.52 | 7d | 1 | 1.30mi |
| 6939 Stones Throw Cir N #6207 Saint Petersburg, FL | 1.0 | 1.0 | 680 | $1,595 | $2.35 | 24d | 1 | 1.33mi |
HOA detail condo
- Monthly dues
- $393 · $4,716/yr
- Likely covers
- water
- Assessments
- None detected in remarks — confirm with the listing agent.
Listing history 17 events
-
2026-06-18days on market $85,000 Active 52 DOM
-
2026-06-17days on market $85,000 Active 51 DOM
-
2026-06-16days on market $85,000 Active 50 DOM
-
2026-06-15days on market $85,000 Active 49 DOM
-
2026-06-13pricedays on market $85,000 Active 47 DOM
-
2026-06-09days on market $97,900 Active 43 DOM
-
2026-06-08days on market $97,900 Active 42 DOM
-
2026-06-07days on market $97,900 Active 41 DOM
-
2026-06-04days on market $97,900 Active 38 DOM
-
2026-06-03days on market $97,900 Active 37 DOM
-
2026-06-01days on market $97,900 Active 35 DOM
-
2026-05-31days on market $97,900 Active 34 DOM
-
2026-05-14price $97,900
-
2026-05-14price $979,000
-
2026-04-16$100,000 Active
-
1998-12-18soldstatus $29,900
-
1996-08-02soldstatus $27,000
ⓘ Source: listings_history table (triggers on properties + properties_extension) + one-shot
backfill from property_details.listing_events for pre-trigger history.
Tax reassessment forecast FL · Resets to sale price
- Current annual tax
- $178 · $15/mo
- Projected year-2 tax
- $706 · $59/mo
- Expected delta
- +$527/yr (+$44/mo · 295.8%)
ⓘ Screening estimate from a state-policy table — verify with the county assessor before closing.
Climate risk First Street
- Flood 1/10 Low FEMA zone X (unshaded) · 0% chance over 30 yrs
- Wildfire 1/10 Low
- Heat 10/10 Extreme 7 d/yr ≥106°F today · 25 d/yr by 30 yrs out
- Wind 10/10 Extreme 99% chance of damaging wind over 30 yrs
- Air quality 4/10 Moderate 4 unhealthy d/yr today · 4 by 30 yrs out
Nearby sold comps map
Loading sold comps map…
Walkable amenities ~0.75 mi
Loading nearby amenities…
Taxation est. · year 1
- Rental income
- $20,647
- − Mortgage interest
- −$4,761
- − Property taxes
- −$178
- − Insurance
- −$425
- − Repairs & maintenance
- −$1,652
- − Management
- −$1,652
- − HOA
- −$4,716
- − Depreciation
- −$2,473
- Taxable income
- $4,790
- Est. tax owed @ 24.0%
- −$1,150
- After-tax cash flow
- $4,493/yr
For passive investors: Depreciation is non-cash, so a rental often shows a tax loss while cash-flowing — sheltering income. Rental losses are passive: they offset passive income freely, and up to $25,000/yr can offset ordinary (W-2) income if you actively participate and your MAGI is under $100k (phasing out to $0 by $150k); unused losses carry forward. On sale, claimed depreciation is recaptured at up to 25%, and gains may owe capital-gains tax (a 1031 exchange can defer both). Figures are a year-1 estimate at your 24.0% rate — not tax advice; consult a CPA.
Schools (NCES district)
- District
- Pinellas
- NCES district ID
- 1201560
- Math proficiency
- 51% ▼ -5.00%
- Reading proficiency
- 51% ▼ -3.00%
- Median HH income
- $46,270
- Composite
- 43.27/100
- National rank
- #3046
- State rank
- #31 of 73 in FL
Livability — St. Petersburg
No livability data for this city. (Only ~50 U.S. cities are tracked.)
Census & demographics
- Census place
- St. Petersburg, FL
- County
- Pinellas County · 939,478 people
- City population
- 249,151
- Metro
- Tampa-St. Petersburg-Clearwater, FL
- Population (ZIP)
- 33,796
- Household income
- $78,611
- Rent vs Own
- Severe rent burden
- 542.0
Population outlook (Pinellas County) Hauer SSP2
- Today (2025)
- 1,027,532 people
- By 2030
- 1,063,586 · +3.5%
- By 2040
- 1,125,020 · +9.5%
- By 2050
- 1,168,637 · +13.7%
- By 2075
- 1,265,188 · +23.1%
- By 2100
- 1,260,357 · +22.7%
Race, ethnicity, and origin ACS 2023
- Neighborhood character
- Predominantly White (77%)
- Race & ethnicity
- White 77% Two or more races 10% Hispanic / Latino 9% Asian 5% Black 4%
- Hispanic origin (detail)
- Mexican 1% Puerto Rican 2% Cuban 2%
- Common ancestry
- Lithuanian 3% Romanian 3% Slovak 2%
- Foreign-born
- 12% · Canada, Vietnam, China
- Languages at home
- 85% English-only · Spanish 7% Other Indo-European 2% Russian/Polish/Slavic 2%
Political lean MEDSL · Pinellas
- 2024 margin
- Lean R (+5.2) · D 46.9% · R 52.1%
- 2008→2024 swing
- -13.5pp toward R · 2008: 8.3pp · 2024: -5.2pp
- All cycles
- 2024: R+5.2 2020: D+0.2 2016: R+1.1 2012: D+5.6 2008: D+8.3
Not yet ingested
- Civics
- —
Market trends
- HPI YoY
- ▼ -547.31%
- Current HPI
- 405.0731
- Rent YoY
- ▼ -0.48%
- Metro
- Tampa-St. Petersburg-Clearwater, FL
- State GDP YoY
- ▲ 3.28%
- F500 in state
- 36
Industry mix (Fortune 500 HQ in FL)
| Industry | F500 HQs | Revenue |
|---|---|---|
| Industrial Technology | 2 | $29B |
|
||
| Insurance | 2 | $17B |
|
||
| Retail | 1 | $60B |
|
||
| Technology Distribution | 1 | $58B |
|
||
| Homebuilding | 1 | $35B |
|
||
| Technology Manufacturing | 1 | $35B |
|
||
Price history
+262.6% since first listed5 events — show timeline
- 2026-05-14 Price Changed $97,900 Stellar MLS as Distributed by MLS Grid
- 2026-05-14 Price Changed $979,000 Stellar MLS as Distributed by MLS Grid
- 2026-04-16 Listed $100,000 Stellar MLS as Distributed by MLS Grid
- 1998-12-18 Sold (Public Records) $29,900 Public Records
- 1996-08-02 Sold (Public Records) $27,000 Public Records
Property tax history
-9.4%/yrLatest (2025): $178 · +14.3% YoY. Source: county tax records.
Cash-flow waterfall
monthlySold comps — $/sqft
last 12 mo · ≤1 miLoading sold comps…