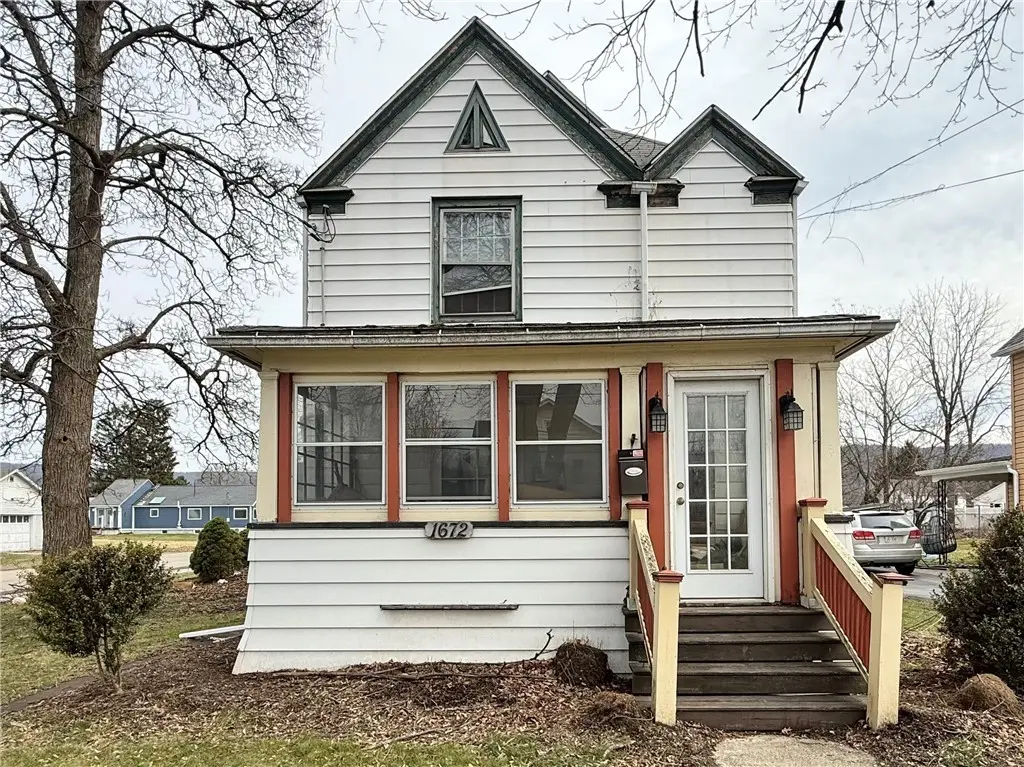
1672 Grand Central Ave · Elmira Heights, NY
Flood risk 4/10 · Minor
- FEMA flood zone
- X
- Chance of flooding over 30 yrs
- 0.22%
- Est. flood insurance / yr
- $473 – $860
Fire risk 3/10 · Minor
- Est. fire insurance / yr
- $691 – $1,283
Heat risk 3/10 · Minor
- Hot days now (above 96°F)
- 7 days/yr
- Hot days in 30 yrs
- 16 days/yr
Wind risk 2/10 · Minimal
- Chance of severe wind over 30 yrs
- 1.0%
Air-quality risk 1/10 · Minimal
- Unhealthy air days now
- 0 days/yr
- Unhealthy air days in 30 yrs
- 0 days/yr
Risk factors via First Street. Map © Google.
Why this score? — see what drove the B+ grade
The composite is a weighted blend of 9 inputs, each scored 0–100. Each bar is that input's sub-score; the figure is the points it added to the 100-point composite (weight × sub-score).
- Cash flow +30.0/30.0
- 1% rule +10.0/10.0
- DSCR +10.0/10.0
- ARV discount +7.5/15.0
- Appreciation +6.9/10.0
- Schools +3.6/10.0
- Livability +3.6/5.0
- Rent growth +2.5/5.0
- Condition / age +2.5/5.0
$59,900
🖨 Deal sheet (PDF) 📄 Offer letter ✓ Due diligence
Listing remarks
Opportunity awaits in Elmira Heights. This 3 bedroom, 1- bath, two story home sits on a desirable corner lot and offers great potential for investors or buyers looking to build equity. Spacious backyard and detached garage. Inside, the home is ready for your personal touch and updates. Bring your vision and transform this property into something special.
Key facts
- Spacious backyard
- Corner lot
- Detached garage
Tags
Property features AI
Exterior
- Parking: Detached garage; 1 garage space
- Utilities: Public water connected; Sewer connected
- Home design: 2-story existing residence; Poured foundation
- Construction: Vinyl siding; Poured foundation; Existing structure
- Exterior features: Dirt driveway; Rectangular residential lot (48 x 120); City street frontage
Interior
- Kitchen: Gas cooktop
- Bedrooms: Den listed as a room
- Flooring: Carpet; Vinyl; Varied flooring
- Bathrooms: 1 full bathroom
- Heating & cooling: Gas forced-air heating
- Interior features: Den; Other interior features — see remarks
- Laundry & utility: Gas water heater
Neighborhood map
What this means for you Summary
Snapshot
- This is a 3-bed/1.0-bath single-family listed at $60k.
Deal economics
- At list price, monthly cash flow is $544 ($7k/yr) — positive.
- The deal already cash-flows at list — no discount required.
- Meets the 1% rule at list price ($1k rent vs $60k).
- Recommended offer: $59k (1.5% below list) — sets the bar for market timing.
Location & tenants
- Location reads 72/100 on livability (#338 in NY) — a middle-class / working-renter tenant base. Strengths: cost of living A+, housing A+, health & safety A+; Watch: employment D, amenities F, commute F.
- Elmira Heights Central School District (suburban): math 39% / reading 46% proficiency, ranked #496 of 590 in NY (top 84%) — families likely to look elsewhere, expect single-tenant / working-renter base with shorter leases.
- Zoned schools: Cohen Elementary School (math 42% / reading 52%, grade D-, #1,195 of 2,108 statewide, top 60%, 494 students, 58% FRL); Cohen Middle School (math 22% / reading 42%, grade F, #511 of 729 statewide, top 71%, 230 students, 53% FRL); Thomas A Edison High School (math 95%, 321 students, 52% FRL).
- Market conditions: 27 active listings in the ZIP; 2 comparable units currently listed for rent nearby; 91 units permitted in Chemung County in 2024 (63 in 5+ unit buildings).
Forward outlook
- In year one you build about $3k of equity ($414 loan paydown + $2k appreciation (3.8% local appreciation)).
- Chemung County population projected at -17% by 2050 — secular population decline; favor cash flow + early exit over multi-decade hold.
- At projected returns (3.8% appreciation + 3.0% rent growth), your $17k cash investment doubles in ~2 years — after that, you're playing with house money.
Negotiation context
- It's been on market 27 days — a 2% lower offer ($59k) is reasonable based on typical stale-listing flexibility.
- Current owner paid $27k; list at $60k implies a 122% gain — meaningful room to come down on a strong offer.
Risks & watch-outs
- Watch-outs: built in 1920 — expect roof / HVAC / electrical / plumbing capex.
Questions for the listing agent
- Built in 1920 — when were the roof, HVAC, electrical panel, plumbing, and water heater last replaced?
- Is there a deadline driving the sale (1031 exchange, divorce, estate, relocation)? That informs how much negotiation room exists.
- What's the average days-on-market for RENTAL listings here right now (not sales)? A rising rental-DOM trend means longer vacancies and softer asking-rent achievability than the comps imply.
- What's the recent tenant-quality profile in this submarket — average credit score on applications, eviction rate, late-payment / NSF rate, and stable-employment percentage? A property-management company in the area should have these aggregated.
- How much new for-sale + rental construction is in the pipeline within 1–3 miles? Heavy new supply typically softens prices + rents 12–24 months out; constrained supply supports both.
Investment metrics
- 1% rule
- 2.02% ✓
- Cap rate
- 17.19%
- Cash-on-cash
- 38.91%
- DSCR
- 2.73
- GRM
- 4.1
CMA / ARV
- ARV (on-the-fly)
- $153,792
- Comps found
- 12
Show comp detail 12 sales within ~0.75 mi
| Address | Dist | Beds/Ba | Sqft | Sold | Price | $/sf | Match |
|---|---|---|---|---|---|---|---|
| 2003 Lake Rd | 0.32mi | 3/1.0 | 1,440 (+1%) | 1mo | $37,000 | $26 | 82 |
| 160 Mccauley Ave | 0.26mi | 3/1.5 | 1,440 (+1%) | 2mo | $180,000 | $125 | 82 |
| 1703 Grand Central Ave | 0.15mi | 3/1.0 | 1,300 (-9%) | 18mo | $55,200 | $42 | 63 |
| 119 Verona St | 0.54mi | 3/1.5 | 1,390 (-2%) | 10mo | $160,000 | $115 | 61 |
| 224 Kingsbury Ave | 0.67mi | 3/1.5 | 1,404 (-1%) | 6mo | $160,000 | $114 | 60 |
| 207 Birchwood Ave | 0.43mi | 4/1.0 (+1) | 1,568 (+10%) | 3mo | $140,000 | $89 | 55 |
| 236 Kendall Pl | 0.67mi | 3/1.0 | 1,457 (+2%) | 13mo | $223,000 | $153 | 54 |
| 208 Crete Ave | 0.63mi | 3/1.0 | 1,287 (-10%) | 4mo | $176,000 | $137 | 51 |
| 253 Elmwood Ave | 0.65mi | 3/1.0 | 1,296 (-9%) | 6mo | $140,000 | $108 | 50 |
| 244 Devonshire Dr | 0.58mi | 4/1.5 (+1) | 1,332 (-6%) | 15mo | $132,000 | $99 | 43 |
| 118 Oakwood Ave | 0.58mi | 3/2.0 | 1,576 (+11%) | 18mo | $152,000 | $96 | 36 |
| 98 Oakwood Ave | 0.63mi | 4/2.0 (+1) | 1,636 (+15%) | 18mo | $150,000 | $92 | 21 |
Match score weights: distance 35% · size 25% · config 20% · recency 20%. Top-matched comps best support the ARV.
Projected returns pro-forma
3.8% appreciation · 3.0% rent growth · sell at horizon
- IRR
- 45.6%
- Equity multiple
- 3.65×
- Total profit
- $44,444
- Equity at exit
- $29,672
- IRR
- 44.6%
- Equity multiple
- 7.36×
- Total profit
- $106,633
- Equity at exit
- $47,981
Cash invested: $16,772 (down + closing). Projections, not guarantees.
Landlord ↔ Tenant lean methodology
- Overall (STATE)
- 15 Strongly Tenant-Friendly
- State New York
- 15 Strongly Tenant-Friendly · D+10
- County
- — inherits STATE
- City
- — inherits STATE
ZIP-level market 14903
- Home prices YoY
- 1.6%
- Active inventory
- 27
- Price-to-rent
- 4.1×
Monthly cashflow live
- Estimated rent
- $1,212 medium interval (Pro) →
- Mortgage (P&I)
- −$314
- Tax est. 1.5%
- −$75 /mo · $898/yr
- Insurance
- −$25
- HOA
- −$0
- Vacancy / Maint / Mgmt
- −$255
- Net cashflow
- $544
Break-even live
Sensitivity live
| Price | -10% $585 | -5% $565 | +0% $544 | +5% $523 | +10% $502 |
|---|---|---|---|---|---|
| Rent | -10% $448 | -5% $496 | +0% $544 | +5% $592 | +10% $640 |
| Rate | -1.0pp $574 | -0.5pp $559 | base $544 | +0.5pp $528 | +1.0pp $513 |
UW: 25.0% down · 7.5% · 30yr · 1.5% tax · 5.0% vac · 8.0% maint · 8.0% mgmt
Financing live
Cash to close
- Down payment
- $14,975
- Closing costs
- $1,797
- Reserves months
- —
- Total cash needed
- —
Loan-product check · same deal, 3 products live
Conventional
25% down · 7.5% · 30yr
- Down + closing
- —
- Monthly P&I
- —
- Monthly cashflow
- —
- DSCR
- —
- Eligible?
- —
Personal DTI + credit; lowest rate.
DSCR
20% down · 8.5% · 30yr
- Down + closing
- —
- Monthly P&I
- —
- Monthly cashflow
- —
- DSCR
- —
- Eligible?
- —
No personal income docs; deal must DSCR.
Hard money
10% down · 12.0% · 12mo
- Down + closing
- —
- Monthly P&I
- —
- Monthly cashflow
- —
- DSCR
- —
- Eligible?
- —
Short-term bridge; refi at stabilization.
Rent comps 2 comps
| Address | Beds | Baths | Sqft | Rent | $/sqft | DOM | Units | Dist |
|---|---|---|---|---|---|---|---|---|
| 258 E 14th St Elmira, NY | 2.0 | 1.0 | 1100 | $1,200 | $1.09 | 45d | 1 | 0.48mi |
| 263 W 13th St Unit Lower Elmira Heights, NY | 3.0 | 1.0 | 900 | $1,241 | $1.38 | 45d | 1 | 0.91mi |
Listing history 3 events
-
2026-04-23status Pending
-
2026-03-27$59,900 Active
-
1998-02-10soldstatus $27,000
ⓘ Source: listings_history table (triggers on properties + properties_extension) + one-shot
backfill from property_details.listing_events for pre-trigger history.
Climate risk First Street
- Flood 4/10 Moderate FEMA zone X · 22% chance over 30 yrs
- Wildfire 3/10 Moderate
- Heat 3/10 Moderate 7 d/yr ≥96°F today · 16 d/yr by 30 yrs out
- Wind 2/10 Low 100% chance of damaging wind over 30 yrs
- Air quality 1/10 Low 0 unhealthy d/yr today · 0 by 30 yrs out
Nearby sold comps map
Loading sold comps map…
Walkable amenities ~0.75 mi
Loading nearby amenities…
Taxation est. · year 1
- Rental income
- $14,549
- − Mortgage interest
- −$3,355
- − Property taxes
- −$898
- − Insurance
- −$300
- − Repairs & maintenance
- −$1,164
- − Management
- −$1,164
- − Depreciation
- −$1,743
- Taxable income
- $5,925
- Est. tax owed @ 24.0%
- −$1,422
- After-tax cash flow
- $5,104/yr
For passive investors: Depreciation is non-cash, so a rental often shows a tax loss while cash-flowing — sheltering income. Rental losses are passive: they offset passive income freely, and up to $25,000/yr can offset ordinary (W-2) income if you actively participate and your MAGI is under $100k (phasing out to $0 by $150k); unused losses carry forward. On sale, claimed depreciation is recaptured at up to 25%, and gains may owe capital-gains tax (a 1031 exchange can defer both). Figures are a year-1 estimate at your 24.0% rate — not tax advice; consult a CPA.
Schools (NCES district)
- District
- Elmira Heights Central School District
- NCES district ID
- 3610590
- Math proficiency
- 39% ▼ -10.00%
- Reading proficiency
- 46% ▲ 7.00%
- Median HH income
- $42,753
- Composite
- 35.85/100
- National rank
- #4821
- State rank
- #496 of 590 in NY
Livability — Elmira Heights
- Score
- 72/100
- State rank
- #338
- US rank
- #5747
Category grades
Schools grade is shown separately in the Schools card above.
Census & demographics
- Census place
- Elmira Heights, NY
- Population (ZIP)
- 7,140
Population outlook (Chemung County) Hauer SSP2
- Today (2025)
- 82,931 people
- By 2030
- 80,356 · -3.1%
- By 2040
- 74,745 · -9.9%
- By 2050
- 69,012 · -16.8%
- By 2075
- 55,689 · -32.8%
- By 2100
- 41,428 · -50.0%
Race, ethnicity, and origin ACS 2023
- Neighborhood character
- Predominantly White (81%)
- Race & ethnicity
- White 81% Black 7% Two or more races 6% Hispanic / Latino 5% Asian 1%
- Common ancestry
- Romanian 5% Slovak 2% Lithuanian 2%
- Foreign-born
- 3% · Canada
- Languages at home
- 97% English-only · Spanish 1% Other Asian/Pacific 1%
Political lean MEDSL · Chemung
- 2024 margin
- R (+16.8) · D 41.6% · R 58.4%
- 2008→2024 swing
- -15.6pp toward R · 2008: -1.2pp · 2024: -16.8pp
- All cycles
- 2024: R+16.8 2020: R+13.4 2016: R+20.0 2012: R+2.9 2008: R+1.2
Not yet ingested
- Civics
- —
Market trends
- HPI YoY
- ▲ 3.80%
- Current HPI
- 234.7884
- Rent YoY
- —
- Metro
- —
- State GDP YoY
- ▲ 2.60%
- F500 in state
- 92
Industry mix (Fortune 500 HQ in NY)
| Industry | F500 HQs | Revenue |
|---|---|---|
| Financial Services | 10 | $950B |
|
||
| Consumer Goods | 9 | $162B |
|
||
| Insurance | 4 | $225B |
|
||
| Telecommunications | 2 | $144B |
|
||
| Pharmaceuticals | 2 | $112B |
|
||
| Media / Entertainment | 2 | $69B |
|
||
Price history
+121.9% since first listed3 events — show timeline
- 2026-04-23 Pending — UNYREIS
- 2026-03-27 Listed $59,900 UNYREIS
- 1998-02-10 Sold (Public Records) $27,000 Public Records
Property tax history
+1.3%/yrLatest (2025): $3,815 · +2.5% YoY. Source: county tax records.
Cash-flow waterfall
monthlySold comps — $/sqft
last 12 mo · ≤1 miLoading sold comps…