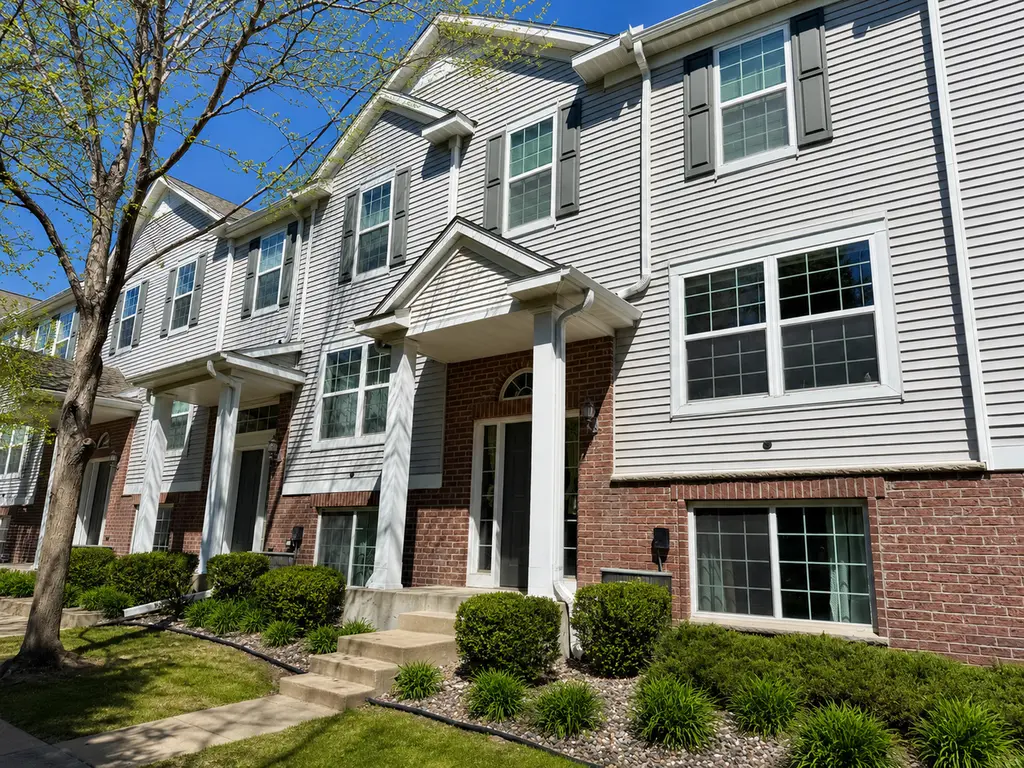
932 Ledgestone Dr · Mahtomedi, MN
Flood risk 1/10 · Minimal
- FEMA flood zone
- X (unshaded)
- Chance of flooding over 30 yrs
- 0.0%
- Est. flood insurance / yr
- $473 – $860
Fire risk 1/10 · Minimal
- Est. fire insurance / yr
- $888 – $1,650
Heat risk 2/10 · Minimal
- Hot days now (above 99°F)
- 7 days/yr
- Hot days in 30 yrs
- 14 days/yr
Wind risk 2/10 · Minimal
- Chance of severe wind over 30 yrs
- —
Air-quality risk 3/10 · Minor
- Unhealthy air days now
- 2 days/yr
- Unhealthy air days in 30 yrs
- 2 days/yr
Risk factors via First Street. Map © Google.
Why this score? — see what drove the D+ grade
The composite is a weighted blend of 9 inputs, each scored 0–100. Each bar is that input's sub-score; the figure is the points it added to the 100-point composite (weight × sub-score).
- Cash flow +13.4/30.0
- ARV discount +7.5/15.0
- Schools +6.2/10.0
- 1% rule +5.2/10.0
- DSCR +4.0/10.0
- Livability +3.9/5.0
- Rent growth +2.5/5.0
- Condition / age +2.5/5.0
- Appreciation +0.0/10.0
$269,000
🖨 Deal sheet (PDF) 📄 Offer letter ✓ Due diligence
Listing remarks
Welcome to 932 Ledgestone Dr in highly desirable Mahtomedi! This 3-bedroom, 2-bathroom home with a 2-car garage offers an incredible opportunity to own in a sought-after location at an attractive price point. The home features a functional open-concept layout with a spacious kitchen complete with center island and island. Enjoy the convenience of main-level laundry, a generous primary bedroom with walk-in closet, and a private deck perfect for relaxing outdoors. This property offers strong potential with just a few cosmetic updates needed, including carpet and paint, making it a great opportunity for buyers looking to build equity and personalize the home to their taste. Being sold As-Is. S
Key facts
- Private deck
- Walk-in closet
- Spacious kitchen
Tags
Property features AI
Finance
- HOA & community: Ledgestone Townhome Association with monthly fee of $385; HOA covers hazard insurance, lawn care, grounds maintenance, professional management, and snow removal
Exterior
- Parking: Tuck-under 2-car garage (approximately 21x21)
- Utilities: City water; City sewer; Natural gas
- Home design: Attached residential property; More than 2 stories; Entry level: Main
- Construction: Finished below-grade area; Foundation type: Other; Below-grade finished area present
- Exterior features: Vinyl exterior; Patio; No fencing
Interior
- Kitchen: Cooktop; Range; Microwave; Refrigerator; Kitchen island
- Bedrooms: 3 bedrooms (one on lower level, two on upper level)
- Bathrooms: 1 full bathroom (upper level); 1 half bathroom
- Heating & cooling: Forced air heating; Central air conditioning
- Interior features: Vaulted ceilings; Kitchen with center island and window; Finished basement; Gas fireplace; Stainless steel appliances
- Laundry & utility: Washer and dryer included; Gas dryer hookup on main level; Washer/Dryer hookup
Neighborhood map
What this means for you Summary
Snapshot
- This is a 2-bed/2.5-bath townhouse listed at $269k.
Deal economics
- At list price, monthly cash flow is $4 ($42/yr) — positive.
- The deal already cash-flows at list — no discount required.
- Meets the 1% rule at list price ($3k rent vs $269k).
- Recommended offer: $261k (3.0% below list) — sets the bar for market timing.
- Cap rate 6.3% vs local median 1.9% in Mahtomedi — top-decile yield for the area; either an underpriced asset or a hidden risk that comps aren't pricing in. Stress-test before assuming the spread holds.
Location & tenants
- Location reads 78/100 on livability (#116 in MN, #2,658 nationally) — a middle-class / working-renter tenant base. Strengths: schools A+, crime A+, employment A+; Watch: commute D+, amenities F, cost of living F.
- Mahtomedi Public School District (suburban): math 67% / reading 68% proficiency, ranked #12 of 301 in MN (top 4%) — acceptable for families but not a draw, mixed tenant base, ~2y average lease; only 7% free/reduced lunch — higher-income household profile.
- Market conditions: 58 active listings in the ZIP; 2 comparable units currently listed for rent nearby; 1,405 units permitted in Washington County in 2024 (121 in 5+ unit buildings).
Forward outlook
- Local home prices are declining (-3.0%/yr); year-one equity from $2k of loan paydown is wiped out by about $8k of value loss. Plan a longer hold.
- Washington County population projected at +16% by 2050 — long-run rental-demand tailwind backs the buy-and-hold thesis.
Negotiation context
- It's been on market 44 days — a 3% lower offer ($261k) is reasonable based on typical stale-listing flexibility.
Questions for the listing agent
- It's been on market 44 days. Have you received any prior offers? Is the seller open to a 3% concession, seller financing, or rate buy-down credit?
- What does the HOA fee cover, when was the last increase, and are there any pending special assessments or reserve-fund shortfalls?
- Is there a deadline driving the sale (1031 exchange, divorce, estate, relocation)? That informs how much negotiation room exists.
- Schools are A-rated — typically a magnet for longer-tenancy family renters. What's the average tenant stay here, and is there a school-zone premium baked into asking?
- The area grade is low — what's the realistic commute time and amenity access for the typical tenant pool here? Any planned neighborhood developments (good or bad) we should know about?
- What's the average days-on-market for RENTAL listings here right now (not sales)? A rising rental-DOM trend means longer vacancies and softer asking-rent achievability than the comps imply.
- What's the recent tenant-quality profile in this submarket — average credit score on applications, eviction rate, late-payment / NSF rate, and stable-employment percentage? A property-management company in the area should have these aggregated.
- How much new for-sale + rental construction is in the pipeline within 1–3 miles? Heavy new supply typically softens prices + rents 12–24 months out; constrained supply supports both.
Investment metrics
- 1% rule
- 1.02% ✓
- Cap rate
- 6.31%
- Cash-on-cash
- 0.06%
- DSCR
- 1.00
- GRM
- 8.2
CMA / ARV
No comps found within radius.
Projected returns pro-forma
-3.0% appreciation · 3.0% rent growth · sell at horizon
- IRR
- -16.1%
- Equity multiple
- 0.43×
- Total profit
- $-43,135
- Equity at exit
- $40,109
- IRR
- -7.6%
- Equity multiple
- 0.52×
- Total profit
- $-36,337
- Equity at exit
- $23,258
Cash invested: $75,320 (down + closing). Projections, not guarantees.
Landlord ↔ Tenant lean methodology
- Overall (STATE)
- 46 Balanced
- State Minnesota
- 46 Balanced · D+2
- County
- — inherits STATE
- City
- — inherits STATE
ZIP-level market 55115
- Home prices YoY
- -31.0%
- Active inventory
- 58
- Price-to-rent
- 8.2×
Monthly cashflow live
- Estimated rent
- $2,746 medium interval (Pro) →
- Mortgage (P&I)
- −$1,411
- Tax from tax record
- −$258 /mo · $3,100/yr
- Insurance
- −$112
- HOA
- −$385
- Vacancy / Maint / Mgmt
- −$577
- Net cashflow
- $4
Break-even live
Sensitivity live
| Price | -10% $156 | -5% $80 | +0% $4 | +5% $-73 | +10% $-149 |
|---|---|---|---|---|---|
| Rent | -10% $-213 | -5% $-105 | +0% $4 | +5% $112 | +10% $220 |
| Rate | -1.0pp $139 | -0.5pp $72 | base $4 | +0.5pp $-66 | +1.0pp $-137 |
UW: 25.0% down · 7.5% · 30yr · 1.5% tax · 5.0% vac · 8.0% maint · 8.0% mgmt
Financing live
Cash to close
- Down payment
- $67,250
- Closing costs
- $8,070
- Reserves months
- —
- Total cash needed
- —
Loan-product check · same deal, 3 products live
Conventional
25% down · 7.5% · 30yr
- Down + closing
- —
- Monthly P&I
- —
- Monthly cashflow
- —
- DSCR
- —
- Eligible?
- —
Personal DTI + credit; lowest rate.
DSCR
20% down · 8.5% · 30yr
- Down + closing
- —
- Monthly P&I
- —
- Monthly cashflow
- —
- DSCR
- —
- Eligible?
- —
No personal income docs; deal must DSCR.
Hard money
10% down · 12.0% · 12mo
- Down + closing
- —
- Monthly P&I
- —
- Monthly cashflow
- —
- DSCR
- —
- Eligible?
- —
Short-term bridge; refi at stabilization.
Rent comps 2 comps
| Address | Beds | Baths | Sqft | Rent | $/sqft | DOM | Units | Dist |
|---|---|---|---|---|---|---|---|---|
| 5680 Hadley Ave N Saint Paul, MN | 2.0 | 1.0–2.0 | 960 | $2,137 | $2.22 | 0d | 6 | 0.48mi |
| 2515 Jansen Ave White Bear Lake, MN | 3.0 | 3.0 | 1742 | $3,400 | $1.95 | 0d | 1 | 0.94mi |
HOA detail
- Monthly dues
- $385 · $4,620/yr
Listing history 18 events
-
2026-06-21days on market $269,000 Active 44 DOM
-
2026-06-18days on market $269,000 Active 41 DOM
-
2026-06-17days on market $269,000 Active 40 DOM
-
2026-06-16days on market $269,000 Active 39 DOM
-
2026-06-15days on market $269,000 Active 38 DOM
-
2026-06-13pricedays on market $269,000 Active 36 DOM
-
2026-06-09days on market $279,900 Active 32 DOM
-
2026-06-08days on market $279,900 Active 31 DOM
-
2026-06-07days on market $279,900 Active 30 DOM
-
2026-06-04days on market $279,900 Active 27 DOM
-
2026-06-03days on market $279,900 Active 26 DOM
-
2026-06-02days on market $279,900 Active 25 DOM
-
2026-06-01days on market $279,900 Active 24 DOM
-
2026-05-31days on market $279,900 Active 23 DOM
-
2026-05-15price $279,900 835-char remark
-
2026-05-12price $289,900 835-char remark
-
2026-05-08$299,900 Active 835-char remark
-
2024-08-05soldstatus $305,000
ⓘ Source: listings_history table (triggers on properties + properties_extension) + one-shot
backfill from property_details.listing_events for pre-trigger history.
Tax reassessment forecast MN · Partial reset (capped growth)
- Current annual tax
- $3,100 · $258/mo
- Projected year-2 tax
- $3,100 · $258/mo
- Expected delta
- $0/yr ($0/mo · 0.0%)
ⓘ Screening estimate from a state-policy table — verify with the county assessor before closing.
Climate risk First Street
- Flood 1/10 Low FEMA zone X (unshaded) · 0% chance over 30 yrs
- Wildfire 1/10 Low
- Heat 2/10 Low 7 d/yr ≥99°F today · 14 d/yr by 30 yrs out
- Wind 2/10 Low
- Air quality 3/10 Moderate 2 unhealthy d/yr today · 2 by 30 yrs out
Nearby sold comps map
Loading sold comps map…
Walkable amenities ~0.75 mi
Loading nearby amenities…
Taxation est. · year 1
- Rental income
- $32,956
- − Mortgage interest
- −$15,068
- − Property taxes
- −$3,100
- − Insurance
- −$1,345
- − Repairs & maintenance
- −$2,636
- − Management
- −$2,636
- − HOA
- −$4,620
- − Depreciation
- −$7,825
- Taxable loss
- −$4,276
- Est. tax savings @ 24.0%
- +$1,026
- After-tax cash flow
- $1,068/yr
For passive investors: Depreciation is non-cash, so a rental often shows a tax loss while cash-flowing — sheltering income. Rental losses are passive: they offset passive income freely, and up to $25,000/yr can offset ordinary (W-2) income if you actively participate and your MAGI is under $100k (phasing out to $0 by $150k); unused losses carry forward. On sale, claimed depreciation is recaptured at up to 25%, and gains may owe capital-gains tax (a 1031 exchange can defer both). Figures are a year-1 estimate at your 24.0% rate — not tax advice; consult a CPA.
Schools (NCES district)
- District
- Mahtomedi Public School District
- NCES district ID
- 2718750
- Math proficiency
- 67% ▼ -10.00%
- Reading proficiency
- 68% ▼ -11.00%
- Median HH income
- $95,268
- Composite
- 61.62/100
- National rank
- #747
- State rank
- #12 of 301 in MN
Livability — Mahtomedi
- Score
- 78/100
- State rank
- #116
- US rank
- #2658
Category grades
Schools grade is shown separately in the Schools card above.
Census & demographics
- Census place
- Mahtomedi, MN
- City population
- 8,926
- Population (ZIP)
- 8,926
Population outlook (Washington County) Hauer SSP2
- Today (2025)
- 278,554 people
- By 2030
- 290,465 · +4.3%
- By 2040
- 310,014 · +11.3%
- By 2050
- 324,118 · +16.4%
- By 2075
- 362,697 · +30.2%
- By 2100
- 381,491 · +37.0%
Race, ethnicity, and origin ACS 2023
- Neighborhood character
- Predominantly White (94%)
- Race & ethnicity
- White 94% Two or more races 3% Asian 2%
- Common ancestry
- Portuguese 11% Romanian 6% Scottish 6%
- Foreign-born
- 3% · Canada, China, Philippines
- Languages at home
- 94% English-only · German/W. Germanic 2% Other Asian/Pacific 1% Spanish 1%
Political lean MEDSL · Washington
- 2024 margin
- Lean D (+8.9) · D 53.5% · R 44.6% · Other 1.9%
- 2008→2024 swing
- +4.6pp toward D · 2008: 4.3pp · 2024: 8.9pp
- All cycles
- 2024: D+8.9 2020: D+9.2 2016: D+1.9 2012: D+0.8 2008: D+4.3
Not yet ingested
- Civics
- —
Market trends
- HPI YoY
- ▼ -107.17%
- Current HPI
- 238.3946
- Rent YoY
- —
- Metro
- —
- State GDP YoY
- ▲ 2.41%
- F500 in state
- 34
Industry mix (Fortune 500 HQ in MN)
| Industry | F500 HQs | Revenue |
|---|---|---|
| Healthcare | 2 | $407B |
|
||
| Retail | 2 | $150B |
|
||
| Consumer Goods | 2 | $32B |
|
||
| Industrial Machinery | 2 | $6B |
|
||
| Agriculture | 1 | $40B |
|
||
| Healthcare / Medical Devices | 1 | $32B |
|
||
Price history
-11.8% since first listed5 events — show timeline
- 2026-06-11 Price Changed $269,000 NORTHSTARMLS as Distributed by MLS Grid
- 2026-05-15 Price Changed $279,900 NORTHSTARMLS as Distributed by MLS Grid
- 2026-05-12 Price Changed $289,900 NORTHSTARMLS as Distributed by MLS Grid
- 2026-05-08 Listed $299,900 NORTHSTARMLS as Distributed by MLS Grid
- 2024-08-05 Sold (Public Records) $305,000 Public Records
Property tax history
+4.0%/yrLatest (2025): $3,100 · +3.4% YoY. Source: county tax records.
Cash-flow waterfall
monthlySold comps — $/sqft
last 12 mo · ≤1 miLoading sold comps…