 🔨 Auction
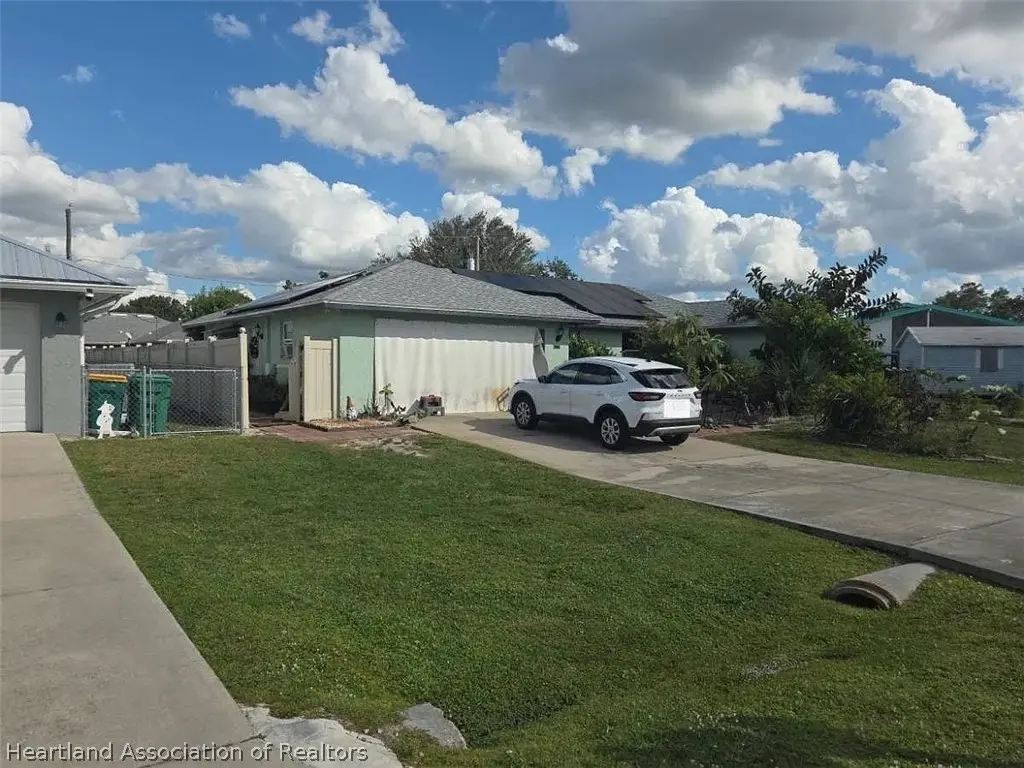
3086 Tarrywood Ter · Harbour Heights, FL
Flood risk 9/10 · Severe
- FEMA flood zone
- AE
- Chance of flooding over 30 yrs
- 0.99%
- Est. flood insurance / yr
- $1,737 – $8,500
Fire risk 2/10 · Minimal
- Est. fire insurance / yr
- $947 – $1,759
Heat risk 10/10 · Severe
- Hot days now (above 107°F)
- 7 days/yr
- Hot days in 30 yrs
- 29 days/yr
Wind risk 10/10 · Severe
- Chance of severe wind over 30 yrs
- 99.0%
Air-quality risk 2/10 · Minimal
- Unhealthy air days now
- 2 days/yr
- Unhealthy air days in 30 yrs
- 2 days/yr
Risk factors via First Street. Map © Google.
Why this score? — see what drove the D- grade
The composite is a weighted blend of 9 inputs, each scored 0–100. Each bar is that input's sub-score; the figure is the points it added to the 100-point composite (weight × sub-score).
- Cash flow +11.0/30.0
- ARV discount +7.5/15.0
- Schools +4.6/10.0
- 1% rule +3.2/10.0
- DSCR +3.2/10.0
- Livability +3.2/5.0
- Condition / age +2.5/5.0
- Rent growth +1.9/5.0
- Appreciation +0.0/10.0
$5,000
🖨 Deal sheet 📄 Offer letter ✓ Due diligence
Listing remarks
Foreclosure Auction Ends June 15, 2026 at 11:00 AM EST. Explore this charming 3-bedroom, 2-bath residence set in a peaceful and well-located Punta Gorda community. The list price is the opening bid for the online auction. Sold As-is. Explore more details and submit your bid through Federa Home App.
Key facts
- 0.23 acre lot
- Garage
- Built 1979
Property features AI
Exterior
- Parking: Garage (1 space)
- Utilities: Other water source; Other sewer
- Home design: Single family residence; One story; Residential property
- Construction: Construction materials: See remarks
- Exterior features: Front porch; Other roof
Interior
- Bedrooms: 1 total room
- Flooring: Other
- Bathrooms: 2 full bathrooms
- Heating & cooling: No heating; No cooling
- Interior features: Other flooring
Neighborhood map
What this means for you Summary
Snapshot
- This is a 3-bed/2.0-bath single-family listed at $5k.
Deal economics
- At list price, monthly cash flow is $-522 ($-6k/yr) — negative.
- The deal already cash-flows at list — no discount required.
- Meets the 1% rule at list price ($2k rent vs $5k).
- Cap rate 5.8% vs local median 4.0% in Harbour Heights — top-decile yield for the area; either an underpriced asset or a hidden risk that comps aren't pricing in. Stress-test before assuming the spread holds.
Location & tenants
- Location reads 64/100 on livability (#684 in FL) — a middle-class / working-renter tenant base. Strengths: crime A+, housing A+, employment B; Watch: schools F, amenities F, commute F.
- Charlotte (suburban): math 54% / reading 54% proficiency, ranked #22 of 73 in FL (top 30%) — acceptable for families but not a draw, mixed tenant base, ~2y average lease.
- Market conditions: Rents soft (-2.6%/yr); 553 active listings in the ZIP; 21 comparable units currently listed for rent nearby; rentals at typical pace (median 21d on market — plan ~3-4 weeks tenant-placement turnaround); 4,585 units permitted in Charlotte County in 2024 (703 in 5+ unit buildings).
- This rent runs 31% of the median local income ($72k/yr) — at the standard rent-burdened threshold; future hikes will face affordability resistance.
Forward outlook
- Local home prices are declining (-3.0%/yr); year-one equity from $2k of loan paydown is wiped out by about $7k of value loss. Plan a longer hold.
- Charlotte County population projected at +24% by 2050 — long-run rental-demand tailwind backs the buy-and-hold thesis.
Negotiation context
- Only 10 days on market — expect competitive offers; lowballing is unlikely to land.
Risks & watch-outs
- Watch-outs: property tax is 67.5% of price; flood insurance adds $427/mo.
- Climate carrying-cost: in FEMA flood zone AE (mandatory federal flood insurance); severe wind risk, 99% chance of damaging wind over 30y; extreme-heat days projected 7→29/yr by 2055 (HVAC capex compounding) — expect insurance premiums to compound above CPI over the hold.
Questions for the listing agent
- What do current leases actually rent for vs. the listed asking? Can we see a recent rent roll and the last 12 months of T-12 income?
- Built in 1979 — when were the roof, HVAC, electrical panel, plumbing, and water heater last replaced?
- Property tax is high relative to price — has the assessment been appealed recently, and will the sale trigger a re-assessment?
- What's the actual annual flood-insurance premium (NFIP or private), and is the property in a SFHA with mandatory coverage?
- Is there a deadline driving the sale (1031 exchange, divorce, estate, relocation)? That informs how much negotiation room exists.
- Schools are F-rated, which usually means shorter tenancies and higher turnover. Who's the typical renter profile here, and what's been the actual vacancy rate?
- The area grade is low — what's the realistic commute time and amenity access for the typical tenant pool here? Any planned neighborhood developments (good or bad) we should know about?
- What's the average days-on-market for RENTAL listings here right now (not sales)? A rising rental-DOM trend means longer vacancies and softer asking-rent achievability than the comps imply.
- What's the recent tenant-quality profile in this submarket — average credit score on applications, eviction rate, late-payment / NSF rate, and stable-employment percentage? A property-management company in the area should have these aggregated.
- How much new for-sale + rental construction is in the pipeline within 1–3 miles? Heavy new supply typically softens prices + rents 12–24 months out; constrained supply supports both.
Investment metrics
- 1% rule
- 0.82% ✗
- Cap rate
- 5.78%
- Cash-on-cash
- -1.82%
- DSCR
- 0.92
- GRM
- 10.1
CMA / ARV
- ARV (on-the-fly)
- $224,952
- Comps found
- 3
Show comp detail 3 sales within ~0.75 mi
| Address | Dist | Beds/Ba | Sqft | Sold | Price | $/sf | Match |
|---|---|---|---|---|---|---|---|
| 3172 Trevino Ter | 0.15mi | 3/2.0 | 1,310 (-2%) | 2mo | $220,000 | $168 | 87 |
| 3393 Sulstone Dr | 0.73mi | 3/2.0 | 1,429 (+7%) | 11mo | $240,000 | $168 | 46 |
| 3533 Peace River Dr | 0.67mi | 2/2.0 (-1) | 1,156 (-14%) | 19mo | $459,200 | $397 | 25 |
Match score weights: distance 35% · size 25% · config 20% · recency 20%. Top-matched comps best support the ARV.
Projected returns pro-forma
-3.0% appreciation · 0.0% rent growth · sell at horizon
- IRR
- -38.7%
- Equity multiple
- -0.19×
- Total profit
- $-74,811
- Equity at exit
- $33,541
- IRR
- -90.8%
- Equity multiple
- -1.03×
- Total profit
- $-127,682
- Equity at exit
- $19,450
Cash invested: $62,987 (down + closing). Projections, not guarantees.
Landlord ↔ Tenant lean methodology
- Overall (STATE)
- 87 Strongly Landlord-Friendly
- State Florida
- 87 Strongly Landlord-Friendly · R+3
- County
- — inherits STATE
- City
- — inherits STATE
ZIP-level market 33983
- Home prices YoY
- -5.1%
- Rents YoY
- -2.6%
- Active inventory
- 553
- Price-to-rent
- 0.2×
Monthly cashflow live
- Estimated rent
- $1,847 high interval (Pro) →
- Mortgage (P&I)
- −$1,180
- Tax est. 1.5%
- −$281 /mo · $3,374/yr
- Insurance
- −$94
- Flood insurance flood zone
- −$427 /mo · $5,118/yr
- HOA
- −$0
- Vacancy / Maint / Mgmt
- −$388
- Net cashflow
- $-522
Break-even live
UW: 25.0% down · 7.5% · 30yr · 1.5% tax · 5.0% vac · 8.0% maint · 8.0% mgmt
Financing live
Cash to close
- Down payment
- $56,238
- Closing costs
- $6,749
- Reserves months
- —
- Total cash needed
- —
Loan-product check · same deal, 3 products live
Conventional
25% down · 7.5% · 30yr
- Down + closing
- —
- Monthly P&I
- —
- Monthly cashflow
- —
- DSCR
- —
- Eligible?
- —
Personal DTI + credit; lowest rate.
DSCR
20% down · 8.5% · 30yr
- Down + closing
- —
- Monthly P&I
- —
- Monthly cashflow
- —
- DSCR
- —
- Eligible?
- —
No personal income docs; deal must DSCR.
Hard money
10% down · 12.0% · 12mo
- Down + closing
- —
- Monthly P&I
- —
- Monthly cashflow
- —
- DSCR
- —
- Eligible?
- —
Short-term bridge; refi at stabilization.
Rent comps 21 comps
| Address | Beds | Baths | Sqft | Rent | $/sqft | DOM | Units | Dist |
|---|---|---|---|---|---|---|---|---|
| 27263 Whitman Ave Punta Gorda, FL | 2.0 | 2.0 | 1130 | $1,450 | $1.28 | 13d | 1 | 0.08mi |
| 27284 Sunnybrook Rd Punta Gorda, FL | 2.0 | 1.0 | 1125 | $1,499 | $1.33 | 20d | 1 | 0.12mi |
| 3074 Broadpoint Dr Punta Gorda, FL | 2.0 | 2.0 | 902 | $1,500 | $1.66 | 20d | 1 | 0.16mi |
| 3234 Daytona Dr Punta Gorda, FL | 3.0 | 2.0 | 1442 | $2,500 | $1.73 | 20d | 1 | 0.22mi |
| 27381 Voyageur Dr Punta Gorda, FL | 3.0 | 2.0 | 1529 | $2,350 | $1.54 | 20d | 1 | 0.30mi |
| 27381 Voyageur Dr Punta Gorda, FL | 3.0 | 2.0 | 1529 | $2,350 | $1.54 | 13d | 1 | 0.30mi |
| 27250 Adams St Unit B Punta Gorda, FL | 2.0 | 1.0 | 937 | $1,400 | $1.49 | 20d | 1 | 0.38mi |
| 3187 Sulstone Dr Punta Gorda, FL | 3.0 | 2.0 | 1408 | $2,000 | $1.42 | 20d | 1 | 0.47mi |
| 27082 Adams St Unit A Punta Gorda, FL | 2.0 | 2.0 | 984 | $1,325 | $1.35 | 20d | 1 | 0.49mi |
| 27082 Adams St Unit B Punta Gorda, FL | 2.0 | 2.0 | 984 | $1,300 | $1.32 | 20d | 1 | 0.49mi |
| 27074 Adams St Punta Gorda, FL | 2.0 | 2.0 | 1052 | $1,399 | $1.33 | 20d | 1 | 0.50mi |
| 27066 Adams St Punta Gorda, FL | 2.0 | 2.0 | 1052 | $1,384 | $1.32 | 13d | 1 | 0.51mi |
| 27097 Omni Ln Punta Gorda, FL | 3.0 | 2.0 | 1056 | $4,100 | $3.88 | 20d | 1 | 0.55mi |
| 27048 Omni Ln Punta Gorda, FL | 3.0 | 2.0 | 1596 | $1,900 | $1.19 | 20d | 1 | 0.58mi |
| 27220 Washington St Port Charlotte, FL | 2.0 | 2.0 | 1052 | $1,425 | $1.35 | 20d | 1 | 0.74mi |
| 3415 Sulstone Dr Punta Gorda, FL | 3.0 | 2.0 | 1390 | $2,100 | $1.51 | 20d | 1 | 0.77mi |
| 27079 Washington St Punta Gorda, FL | 3.0 | 2.0 | 1200 | $1,650 | $1.38 | 13d | 1 | 0.77mi |
| 27085 Partin Dr Punta Gorda, FL | 2.0 | 2.0 | 1052 | $1,445 | $1.37 | 20d | 1 | 1.10mi |
| 27092 Partin Dr Unit B Punta Gorda, FL | 2.0 | 2.0 | 1041 | $1,400 | $1.34 | 20d | 1 | 1.13mi |
| 26485 Rampart Blvd Punta Gorda, FL | 2.0 | 2.0 | 884 | $1,522 | $1.72 | 20d | 2 | 1.18mi |
| 2194 Rio de Janeiro Ave Punta Gorda, FL | 3.0 | 2.0 | 1677 | $1,825 | $1.09 | 13d | 1 | 1.28mi |
Listing history 8 events
-
2026-06-15days on market $5,000 Active 10 DOM
-
2026-06-14days on market $5,000 Active 8 DOM
-
2026-06-13days on market $5,000 Active 7 DOM
-
2026-06-10days on market $5,000 Active 5 DOM
-
2026-06-09days on market $5,000 Active 4 DOM
-
2026-06-08days on market $5,000 Active 3 DOM
-
2026-06-07remarks 299-char remark
-
2026-06-07$5,000 Active 2 DOM
ⓘ Source: listings_history table (triggers on properties + properties_extension) + one-shot
backfill from property_details.listing_events for pre-trigger history.
Climate risk First Street
- Flood 9/10 Extreme FEMA zone AE · 99% chance over 30 yrs
- Wildfire 2/10 Low
- Heat 10/10 Extreme 7 d/yr ≥107°F today · 29 d/yr by 30 yrs out
- Wind 10/10 Extreme 99% chance of damaging wind over 30 yrs
- Air quality 2/10 Low 2 unhealthy d/yr today · 2 by 30 yrs out
Nearby sold comps map
Loading sold comps map…
Walkable amenities ~0.75 mi
Loading nearby amenities…
Taxation est. · year 1
- Rental income
- $22,167
- − Mortgage interest
- −$12,601
- − Property taxes
- −$3,374
- − Insurance
- −$6,243
- − Repairs & maintenance
- −$1,773
- − Management
- −$1,773
- − Depreciation
- −$6,544
- Taxable loss
- −$10,142
- Est. tax savings @ 24.0%
- +$2,434
- After-tax cash flow
- $-3,828/yr
For passive investors: Depreciation is non-cash, so a rental often shows a tax loss while cash-flowing — sheltering income. Rental losses are passive: they offset passive income freely, and up to $25,000/yr can offset ordinary (W-2) income if you actively participate and your MAGI is under $100k (phasing out to $0 by $150k); unused losses carry forward. On sale, claimed depreciation is recaptured at up to 25%, and gains may owe capital-gains tax (a 1031 exchange can defer both). Figures are a year-1 estimate at your 24.0% rate — not tax advice; consult a CPA.
Schools (NCES district)
- District
- Charlotte
- NCES district ID
- 1200240
- Math proficiency
- 54% ▼ -6.00%
- Reading proficiency
- 54% ▼ -1.00%
- Median HH income
- $44,864
- Composite
- 45.62/100
- National rank
- #2586
- State rank
- #22 of 73 in FL
Livability — Harbour Heights
- Score
- 64/100
- State rank
- #684
- US rank
- #14202
Category grades
Schools grade is shown separately in the Schools card above.
Census & demographics
- Census place
- Harbour Heights, FL
- County
- Charlotte County · 196,994 people
- Metro
- Punta Gorda, FL
- Population (ZIP)
- 18,471
- Household income
- $71,856
- Rent vs Own
- Severe rent burden
- 342.0
Population outlook (Charlotte County) Hauer SSP2
- Today (2025)
- 198,646 people
- By 2030
- 210,507 · +6.0%
- By 2040
- 230,857 · +16.2%
- By 2050
- 247,148 · +24.4%
- By 2075
- 281,777 · +41.8%
- By 2100
- 293,609 · +47.8%
Race, ethnicity, and origin ACS 2023
- Neighborhood character
- Predominantly White (78%)
- Race & ethnicity
- White 78% Hispanic / Latino 9% Black 9% Two or more races 6% Asian 1%
- Hispanic origin (detail)
- Puerto Rican 3% Cuban 2%
- Common ancestry
- Romanian 4% Lithuanian 3% Italian 2%
- Foreign-born
- 11% · Canada, Jamaica
- Languages at home
- 92% English-only · Spanish 4% Other Indo-European 1% Russian/Polish/Slavic 1%
Political lean MEDSL · Charlotte
- 2024 margin
- Solid R (+34.0) · D 32.7% · R 66.7%
- 2008→2024 swing
- -26.7pp toward R · 2008: -7.2pp · 2024: -34.0pp
- All cycles
- 2024: R+34.0 2020: R+26.6 2016: R+27.8 2012: R+14.3 2008: R+7.2
Not yet ingested
- Civics
- —
Market trends
- HPI YoY
- ▼ -18.76%
- Current HPI
- 346.0116
- Rent YoY
- ▼ -2.57%
- Metro
- Punta Gorda, FL
- State GDP YoY
- ▲ 3.28%
- F500 in state
- 36
Industry mix (Fortune 500 HQ in FL)
| Industry | F500 HQs | Revenue |
|---|---|---|
| Industrial Technology | 2 | $29B |
|
||
| Insurance | 2 | $17B |
|
||
| Retail | 1 | $60B |
|
||
| Technology Distribution | 1 | $58B |
|
||
| Homebuilding | 1 | $35B |
|
||
| Technology Manufacturing | 1 | $35B |
|
||
Price history
-92.3% since first listed2 events — show timeline
- 2026-06-05 Listed $5,000 HAOR as distributed by MLS GRID
- 1998-02-06 Sold (Public Records) $64,900 Public Records
Property tax history
+2.2%/yrLatest (2025): $1,268 · -8.2% YoY. Source: county tax records.
Cash-flow waterfall
monthlySold comps — $/sqft
last 12 mo · ≤1 miLoading sold comps…