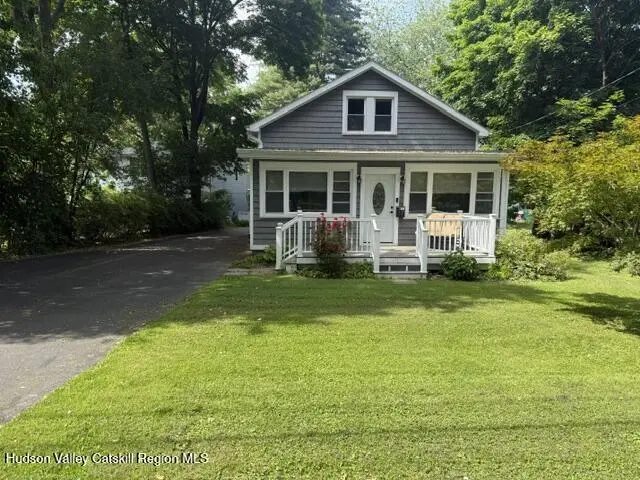
57 Van Dyck St · Coxsackie, NY
Flood risk 1/10 · Minimal
- FEMA flood zone
- X (unshaded)
- Chance of flooding over 30 yrs
- 0.0%
- Est. flood insurance / yr
- $473 – $860
Fire risk 4/10 · Minor
- Est. fire insurance / yr
- $691 – $1,283
Heat risk 4/10 · Minor
- Hot days now (above 98°F)
- 7 days/yr
- Hot days in 30 yrs
- 16 days/yr
Wind risk 3/10 · Minor
- Chance of severe wind over 30 yrs
- 8.0%
Air-quality risk 2/10 · Minimal
- Unhealthy air days now
- 0 days/yr
- Unhealthy air days in 30 yrs
- 1 days/yr
Risk factors via First Street. Map © Google.
Why this score? — see what drove the C grade
The composite is a weighted blend of 9 inputs, each scored 0–100. Each bar is that input's sub-score; the figure is the points it added to the 100-point composite (weight × sub-score).
- Cash flow +17.7/30.0
- Appreciation +10.0/10.0
- ARV discount +5.6/15.0
- DSCR +5.5/10.0
- 1% rule +4.5/10.0
- Schools +4.3/10.0
- Livability +3.7/5.0
- Rent growth +2.5/5.0
- Condition / age +2.5/5.0
$299,000
🖨 Deal sheet (PDF) 📄 Offer letter ✓ Due diligence
Listing remarks
Well-maintained three-bedroom home located on a quiet street in a desirable neighborhood. Conveniently situated near local dining, shopping, and the Hudson River waterfront, while offering an easy commute within 30 minutes to Albany or Hudson. The property features a primary bedroom with a walkout deck leading to a heated above-ground pool, a landscaped backyard, fully enclosed front porch for extra living space, and a spacious detached garage. Recent updates include a new roof, furnace, and upgraded electrical panel.
Key facts
- Landscaped backyard
- Walkout deck
- New roof
Tags
Property features AI
Exterior
- Parking: 1-car garage
- Utilities: Public water; 200+ amp electrical service
- Home design: Single-family residence; Residential property
- Construction: Below-grade finished area present
- Exterior features: Enclosed front porch; Above-ground heated pool
Interior
- Kitchen: Dishwasher; Gas oven; Microwave; Refrigerator
- Bedrooms: Master downstair(s)
- Bathrooms: 1 full bathroom
- Heating & cooling: Hot water heating; Ceiling fans for cooling
- Interior features: Master bedroom located on the main floor; Full, unfinished basement
- Laundry & utility: Washer; Dryer
Neighborhood map
What this means for you Summary
Snapshot
- This is a 4-bed/1.0-bath single-family listed at $299k.
Deal economics
- At list price, monthly cash flow is $242 ($3k/yr) — positive.
- The deal already cash-flows at list — no discount required.
- To meet the 1% rule (rent ≥ 1% of price), the offer needs to be $285k (4.7% below list).
- Recommended offer: $285k (4.7% below list) — sets the bar for 1% rule.
- Cap rate 7.3% vs local median 3.2% in Coxsackie — top-decile yield for the area; either an underpriced asset or a hidden risk that comps aren't pricing in. Stress-test before assuming the spread holds.
Location & tenants
- Location reads 73/100 on livability (#310 in NY) — a middle-class / working-renter tenant base. Strengths: housing A+, health & safety A+, crime A; Watch: amenities F, commute F.
- Coxsackie-Athens Central School District (town): math 43% / reading 56% proficiency, ranked #384 of 590 in NY (top 65%) — families likely to look elsewhere, expect single-tenant / working-renter base with shorter leases.
- Zoned schools: Coxsackie Elementary School (math 34% / reading 57%, grade D-, #1,268 of 2,108 statewide, top 60%, 236 students, 40% FRL); Coxsackie-Athens Middle School (math 22% / reading 46%, grade F, #497 of 729 statewide, top 69%, 364 students, 41% FRL); Coxsackie-Athens High School (math 87% / reading 82%, grade A, #379 of 1,100 statewide, top 36%, 365 students, 0% FRL) — zoned schools at 27% FRL track the district average.
- Market conditions: 49 active listings in the ZIP; 1 comparable units currently listed for rent nearby; 97 units permitted in Greene County in 2024 (0 in 5+ unit buildings).
Forward outlook
- In year one you build about $32k of equity ($2k loan paydown + $30k appreciation (10.0% local appreciation)).
- Greene County population projected at -22% by 2050 — secular population decline; favor cash flow + early exit over multi-decade hold.
- At projected returns (10.0% appreciation + 3.0% rent growth), your $84k cash investment doubles in ~3 years — after that, you're playing with house money.
- By year 2, paydown + projected appreciation supports a ~$51k cash-out refi (75% LTV) — recoverable capital for the next deal without selling this one.
Negotiation context
- Only 5 days on market — expect competitive offers; lowballing is unlikely to land.
- Current owner paid $59k; list at $299k implies a 407% gain — meaningful room to come down on a strong offer.
Risks & watch-outs
- Watch-outs: built in 1940 — expect roof / HVAC / electrical / plumbing capex.
Questions for the listing agent
- Built in 1940 — when were the roof, HVAC, electrical panel, plumbing, and water heater last replaced?
- Is there a deadline driving the sale (1031 exchange, divorce, estate, relocation)? That informs how much negotiation room exists.
- What's the average days-on-market for RENTAL listings here right now (not sales)? A rising rental-DOM trend means longer vacancies and softer asking-rent achievability than the comps imply.
- What's the recent tenant-quality profile in this submarket — average credit score on applications, eviction rate, late-payment / NSF rate, and stable-employment percentage? A property-management company in the area should have these aggregated.
- How much new for-sale + rental construction is in the pipeline within 1–3 miles? Heavy new supply typically softens prices + rents 12–24 months out; constrained supply supports both.
Investment metrics
- 1% rule
- 0.95% ✗
- Cap rate
- 7.26%
- Cash-on-cash
- 3.47%
- DSCR
- 1.15
- GRM
- 8.7
CMA / ARV
- ARV (on-the-fly)
- $286,604
- Comps found
- 1
Show comp detail 1 sale within ~0.75 mi
| Address | Dist | Beds/Ba | Sqft | Sold | Price | $/sf | Match |
|---|---|---|---|---|---|---|---|
| 53 Van Dyck St St | 0.02mi | 3/2.0 (-1) | 1,156 (+10%) | 17mo | $317,000 | $274 | 58 |
Match score weights: distance 35% · size 25% · config 20% · recency 20%. Top-matched comps best support the ARV.
Projected returns pro-forma
10.0% appreciation · 3.0% rent growth · sell at horizon
- IRR
- 26.8%
- Equity multiple
- 3.13×
- Total profit
- $178,263
- Equity at exit
- $269,363
- IRR
- 23.4%
- Equity multiple
- 7.13×
- Total profit
- $512,851
- Equity at exit
- $580,891
Cash invested: $83,720 (down + closing). Projections, not guarantees.
Landlord ↔ Tenant lean methodology
- Overall (STATE)
- 15 Strongly Tenant-Friendly
- State New York
- 15 Strongly Tenant-Friendly · D+10
- County
- — inherits STATE
- City
- — inherits STATE
ZIP-level market 12051
- Home prices YoY
- 17.7%
- Active inventory
- 49
- Price-to-rent
- 8.7×
Monthly cashflow live
- Estimated rent
- $2,850 medium interval (Pro) →
- Mortgage (P&I)
- −$1,568
- Tax from tax record
- −$317 /mo · $3,803/yr
- Insurance
- −$125
- HOA
- −$0
- Lot rent
- −$0
- Vacancy / Maint / Mgmt
- −$598
- Net cashflow
- $242
Break-even live
Sensitivity live
| Price | -10% $411 | -5% $327 | +0% $242 | +5% $157 | +10% $73 |
|---|---|---|---|---|---|
| Rent | -10% $17 | -5% $129 | +0% $242 | +5% $355 | +10% $467 |
| Rate | -1.0pp $393 | -0.5pp $318 | base $242 | +0.5pp $164 | +1.0pp $86 |
UW: 25.0% down · 7.5% · 30yr · 1.5% tax · 5.0% vac · 8.0% maint · 8.0% mgmt
Financing live
Cash to close
- Down payment
- $74,750
- Closing costs
- $8,970
- Reserves months
- —
- Total cash needed
- —
Loan-product check · same deal, 3 products live
Conventional
25% down · 7.5% · 30yr
- Down + closing
- —
- Monthly P&I
- —
- Monthly cashflow
- —
- DSCR
- —
- Eligible?
- —
Personal DTI + credit; lowest rate.
DSCR
20% down · 8.5% · 30yr
- Down + closing
- —
- Monthly P&I
- —
- Monthly cashflow
- —
- DSCR
- —
- Eligible?
- —
No personal income docs; deal must DSCR.
Hard money
10% down · 12.0% · 12mo
- Down + closing
- —
- Monthly P&I
- —
- Monthly cashflow
- —
- DSCR
- —
- Eligible?
- —
Short-term bridge; refi at stabilization.
Rent comps 1 comps
| Address | Beds | Baths | Sqft | Rent | $/sqft | DOM | Units | Dist |
|---|---|---|---|---|---|---|---|---|
| 37 Van Dyck St Coxsackie, NY | 3.0 | 2.0 | 1380 | $2,850 | $2.07 | 17d | 1 | 0.10mi |
Listing history 5 events
-
2026-06-16statusdays on market $299,000 Pending 5 DOM
-
2026-06-15days on market $299,000 Active 4 DOM
-
2026-06-14days on market $299,000 Active 2 DOM
-
2026-06-13remarks 523-char remark
-
2026-06-13$299,000 Active 1 DOM
ⓘ Source: listings_history table (triggers on properties + properties_extension) + one-shot
backfill from property_details.listing_events for pre-trigger history.
Tax reassessment forecast NY · Partial reset (capped growth)
- Current annual tax
- $3,803 · $317/mo
- Projected year-2 tax
- $4,428 · $369/mo
- Expected delta
- +$625/yr (+$52/mo · 16.4%)
ⓘ Screening estimate from a state-policy table — verify with the county assessor before closing.
Climate risk First Street
- Flood 1/10 Low FEMA zone X (unshaded) · 0% chance over 30 yrs
- Wildfire 4/10 Moderate
- Heat 4/10 Moderate 7 d/yr ≥98°F today · 16 d/yr by 30 yrs out
- Wind 3/10 Moderate 8% chance of damaging wind over 30 yrs
- Air quality 2/10 Low 0 unhealthy d/yr today · 1 by 30 yrs out
Nearby sold comps map
Loading sold comps map…
Walkable amenities ~0.75 mi
Loading nearby amenities…
Taxation est. · year 1
- Rental income
- $34,200
- − Mortgage interest
- −$16,749
- − Property taxes
- −$3,803
- − Insurance
- −$1,495
- − Repairs & maintenance
- −$2,736
- − Management
- −$2,736
- − Depreciation
- −$8,698
- Taxable loss
- −$2,017
- Est. tax savings @ 24.0%
- +$484
- After-tax cash flow
- $3,388/yr
For passive investors: Depreciation is non-cash, so a rental often shows a tax loss while cash-flowing — sheltering income. Rental losses are passive: they offset passive income freely, and up to $25,000/yr can offset ordinary (W-2) income if you actively participate and your MAGI is under $100k (phasing out to $0 by $150k); unused losses carry forward. On sale, claimed depreciation is recaptured at up to 25%, and gains may owe capital-gains tax (a 1031 exchange can defer both). Figures are a year-1 estimate at your 24.0% rate — not tax advice; consult a CPA.
Schools (NCES district)
- District
- Coxsackie-Athens Central School District
- NCES district ID
- 3608490
- Math proficiency
- 43% ▼ -1.00%
- Reading proficiency
- 56% ▲ 19.00%
- Median HH income
- $55,006
- Composite
- 42.8/100
- National rank
- #3143
- State rank
- #384 of 590 in NY
Livability — Coxsackie
- Score
- 73/100
- State rank
- #310
- US rank
- #5149
Category grades
Schools grade is shown separately in the Schools card above.
Census & demographics
- Census place
- Coxsackie, NY
- Population (ZIP)
- 5,706
Population outlook (Greene County) Hauer SSP2
- Today (2025)
- 44,963 people
- By 2030
- 43,126 · -4.1%
- By 2040
- 38,756 · -13.8%
- By 2050
- 34,913 · -22.4%
- By 2075
- 28,156 · -37.4%
- By 2100
- 22,296 · -50.4%
Race, ethnicity, and origin ACS 2023
- Neighborhood character
- Predominantly White (71%)
- Race & ethnicity
- White 71% Black 19% Hispanic / Latino 6% Two or more races 5%
- Hispanic origin (detail)
- Puerto Rican 2%
- Common ancestry
- Lithuanian 3% Romanian 2% Slovak 2%
- Foreign-born
- 5% · Canada
- Languages at home
- 95% English-only · Spanish 3% Other Indo-European 1%
Political lean MEDSL · Greene
- 2024 margin
- R (+17.0) · D 41.5% · R 58.5%
- 2008→2024 swing
- -7.1pp toward R · 2008: -9.9pp · 2024: -17.0pp
- All cycles
- 2024: R+17.0 2020: R+15.6 2016: R+27.4 2012: R+11.1 2008: R+9.9
Not yet ingested
- Civics
- —
Market trends
- HPI YoY
- ▲ 55.86%
- Current HPI
- 371.238
- Rent YoY
- —
- Metro
- —
- State GDP YoY
- ▲ 2.60%
- F500 in state
- 92
Industry mix (Fortune 500 HQ in NY)
| Industry | F500 HQs | Revenue |
|---|---|---|
| Financial Services | 10 | $950B |
|
||
| Consumer Goods | 9 | $162B |
|
||
| Insurance | 4 | $225B |
|
||
| Telecommunications | 2 | $144B |
|
||
| Pharmaceuticals | 2 | $112B |
|
||
| Media / Entertainment | 2 | $69B |
|
||
Price history
+406.8% since first listed2 events — show timeline
- 2026-06-11 Listed $299,000 HVCRMLS
- 2000-10-31 Sold (Public Records) $59,000 Public Records
Property tax history
+3.5%/yrLatest (2025): $3,803 · +1.2% YoY. Source: county tax records.
Cash-flow waterfall
monthlySold comps — $/sqft
last 12 mo · ≤1 miLoading sold comps…