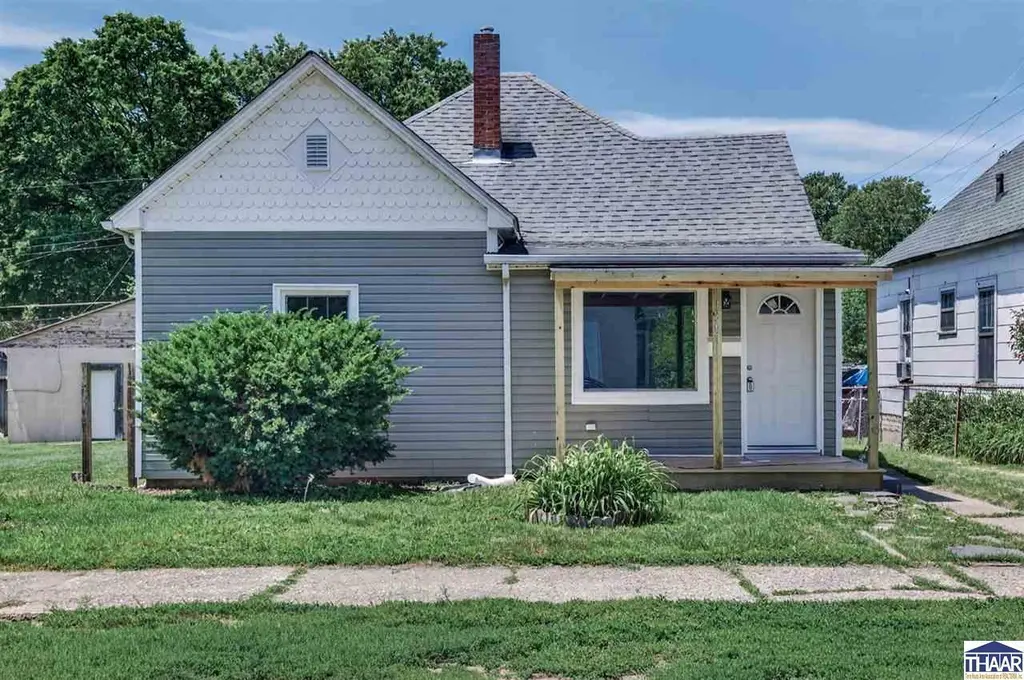
1307 S 21st St · Terre Haute, IN
Flood risk 4/10 · Minor
- FEMA flood zone
- X (unshaded)
- Chance of flooding over 30 yrs
- 0.24%
- Est. flood insurance / yr
- $473 – $860
Fire risk 3/10 · Minor
- Est. fire insurance / yr
- $717 – $1,331
Heat risk 4/10 · Minor
- Hot days now (above 104°F)
- 7 days/yr
- Hot days in 30 yrs
- 18 days/yr
Wind risk 2/10 · Minimal
- Chance of severe wind over 30 yrs
- 1.0%
Air-quality risk 3/10 · Minor
- Unhealthy air days now
- 3 days/yr
- Unhealthy air days in 30 yrs
- 4 days/yr
Risk factors via First Street. Map © Google.
Why this score? — see what drove the D+ grade
The composite is a weighted blend of 9 inputs, each scored 0–100. Each bar is that input's sub-score; the figure is the points it added to the 100-point composite (weight × sub-score).
- ARV discount +15.0/15.0
- Cash flow +14.5/30.0
- DSCR +4.4/10.0
- Livability +3.8/5.0
- Rent growth +3.5/5.0
- 1% rule +3.0/10.0
- Schools +2.9/10.0
- Condition / age +2.5/5.0
- Appreciation +0.0/10.0
$139,900
🖨 Deal sheet (PDF) 📄 Offer letter ✓ Due diligence
Listing remarks MLS
Beautiful rehab opportunity overlooking the city's eastside. 3 bedrooms and 1 bathroom awaiting the final touches from a savvy investor or handy homeowner. Large backyard enclosed by privacy fence. Property being sold as-is.
Key facts
- Rear parking
- Updated kitchen
- Main-level laundry
Tags
Property features AI
Exterior
- Utilities: Public sewer
- Home design: Single-family residence; 1 story; Residential zoning
- Construction: Vinyl siding; Shingle roof
- Exterior features: Porch
Interior
- Kitchen: Gas oven; Gas range; Microwave; Refrigerator
- Flooring: Carpet; Vinyl
- Bathrooms: 1 full bathroom
- Heating & cooling: Natural gas heating; Central air; Ceiling fans
- Interior features: Insulated windows; Full basement
Neighborhood map
What this means for you Summary
Snapshot
- This is a 3-bed/1.0-bath single-family listed at $140k.
Deal economics
- At list price, monthly cash flow is $30 ($356/yr) — positive.
- The deal already cash-flows at list — no discount required.
- To meet the 1% rule (rent ≥ 1% of price), the offer needs to be $112k (20.2% below list).
- Recommended offer: $112k (20.2% below list) — sets the bar for 1% rule.
- Cap rate 6.5% vs local median 4.7% in Terre Haute — top-decile yield for the area; either an underpriced asset or a hidden risk that comps aren't pricing in. Stress-test before assuming the spread holds.
Location & tenants
- Location reads 75/100 on livability (#63 in IN, #4,186 nationally) — a middle-class / working-renter tenant base. Strengths: cost of living A+, housing A+, health & safety A+; Watch: crime F, employment F.
- Vigo County School Corporation (urban): math 32% / reading 37% proficiency, ranked #202 of 301 in IN (top 67%) — families likely to look elsewhere, expect single-tenant / working-renter base with shorter leases.
- Zoned schools: Davis Park Elementary School (math 32% / reading 27%, grade F, #697 of 994 statewide, top 73%, 335 students, 88% FRL); Woodrow Wilson Middle School (math 21% / reading 31%, grade F, #240 of 330 statewide, top 73%, 701 students, 62% FRL); Terre Haute South Vigo High School (math 37% / reading 72%, grade C-, #79 of 369 statewide, top 26%, 1,610 students, 51% FRL) — zoned schools average 67% FRL vs 47% district-wide (20 pts higher); higher-poverty schools than district average — tighter screening recommended.
- Market conditions: Rents rising fast (+4.1%/yr); 177 active listings in the ZIP; 13 comparable units currently listed for rent nearby; rentals lingering (median 44d on market — plan ~5-8 weeks vacancy on turnover, expect pricing pressure); 100% of comp listings sitting > 30 days — soft ceiling on asking rent; 60 units permitted in Vigo County in 2024 (0 in 5+ unit buildings).
Forward outlook
- Local home prices are declining (-3.0%/yr); year-one equity from $967 of loan paydown is wiped out by about $4k of value loss. Plan a longer hold.
- Vigo County population projected to shrink 5% by 2050 — rents likely to lag national; underwrite the cash flow, not the appreciation.
Negotiation context
- Only 2 days on market — expect competitive offers; lowballing is unlikely to land.
- 2 sale attempts with the ask held roughly flat each time — persistent listings suggest the price (not the market) is what's stuck; bring a comps-based counter.
- Current owner paid $48k; list at $140k implies a 191% gain — meaningful room to come down on a strong offer.
Risks & watch-outs
- Watch-outs: built in 1900 — expect roof / HVAC / electrical / plumbing capex.
Questions for the listing agent
- Built in 1900 — when were the roof, HVAC, electrical panel, plumbing, and water heater last replaced?
- Is there a deadline driving the sale (1031 exchange, divorce, estate, relocation)? That informs how much negotiation room exists.
- Schools are D-rated, which usually means shorter tenancies and higher turnover. Who's the typical renter profile here, and what's been the actual vacancy rate?
- Crime grade is F in this area — have there been break-ins, vandalism, or insurance claims at this property in the last 3 years? What carrier currently insures it and at what premium?
- The area grade is low — what's the realistic commute time and amenity access for the typical tenant pool here? Any planned neighborhood developments (good or bad) we should know about?
- What's the average days-on-market for RENTAL listings here right now (not sales)? A rising rental-DOM trend means longer vacancies and softer asking-rent achievability than the comps imply.
- What's the recent tenant-quality profile in this submarket — average credit score on applications, eviction rate, late-payment / NSF rate, and stable-employment percentage? A property-management company in the area should have these aggregated.
- How much new for-sale + rental construction is in the pipeline within 1–3 miles? Heavy new supply typically softens prices + rents 12–24 months out; constrained supply supports both.
Investment metrics
- 1% rule
- 0.80% ✗
- Cap rate
- 6.55%
- Cash-on-cash
- 0.91%
- DSCR
- 1.04
- GRM
- 10.4
CMA / ARV
- ARV (on-the-fly)
- $173,712
- Comps found
- 12
Show comp detail 12 sales within ~0.75 mi
| Address | Dist | Beds/Ba | Sqft | Sold | Price | $/sf | Match |
|---|---|---|---|---|---|---|---|
| 1008 S 20th St | 0.18mi | 2/1.0 (-1) | 1,225 (-1%) | 1mo | $115,000 | $94 | 85 |
| 2512 Farrington St | 0.49mi | 3/1.0 | 1,245 (+1%) | 1mo | $149,900 | $120 | 75 |
| 1515 S 17th St | 0.32mi | 2/1.0 (-1) | 1,184 (-4%) | 5mo | $105,000 | $89 | 69 |
| 1006 S 25th St | 0.45mi | 2/2.0 (-1) | 1,207 (-2%) | 3mo | $169,900 | $141 | 64 |
| 941 S 25th St | 0.42mi | 2/1.0 (-1) | 1,102 (-11%) | 2mo | $115,000 | $104 | 56 |
| 2709 Crawford St | 0.67mi | 3/1.0 | 1,363 (+11%) | 1mo | $192,444 | $141 | 50 |
| 1419 S 12th St | 0.72mi | 3/2.0 | 1,146 (-7%) | 4mo | $177,000 | $154 | 48 |
| 1660 S Albert Way | 0.71mi | 3/2.0 | 1,318 (+7%) | 4mo | $260,000 | $197 | 48 |
| 1940 S 19th St | 0.57mi | 3/2.0 | 1,376 (+12%) | 4mo | $220,000 | $160 | 47 |
| 552 Monterey Ave | 0.55mi | 2/1.0 (-1) | 1,080 (-12%) | 3mo | $147,000 | $136 | 46 |
| 1944 S 19th St | 0.58mi | 3/2.0 | 1,376 (+12%) | 5mo | $213,750 | $155 | 46 |
| 1908 S 23rd St | 0.53mi | 2/2.0 (-1) | 1,072 (-13%) | 0mo | $176,852 | $165 | 44 |
Match score weights: distance 35% · size 25% · config 20% · recency 20%. Top-matched comps best support the ARV.
Projected returns pro-forma
-3.0% appreciation · 4.09% rent growth · sell at horizon
- IRR
- -13.8%
- Equity multiple
- 0.50×
- Total profit
- $-19,599
- Equity at exit
- $20,860
- IRR
- -3.6%
- Equity multiple
- 0.75×
- Total profit
- $-9,663
- Equity at exit
- $12,096
Cash invested: $39,172 (down + closing). Projections, not guarantees.
Landlord ↔ Tenant lean methodology
- Overall (STATE)
- 90 Strongly Landlord-Friendly
- State Indiana
- 90 Strongly Landlord-Friendly · R+11
- County
- — inherits STATE
- City
- — inherits STATE
ZIP-level market 47803
- Home prices YoY
- -28.6%
- Rents YoY
- 4.1%
- Active inventory
- 177
- Price-to-rent
- 10.4×
Monthly cashflow live
- Estimated rent
- $1,116 high interval (Pro) →
- Mortgage (P&I)
- −$734
- Tax from tax record
- −$60 /mo · $721/yr
- Insurance
- −$58
- HOA
- −$0
- Vacancy / Maint / Mgmt
- −$234
- Net cashflow
- $30
Break-even live
Sensitivity live
| Price | -10% $109 | -5% $69 | +0% $30 | +5% $-10 | +10% $-50 |
|---|---|---|---|---|---|
| Rent | -10% $-59 | -5% $-14 | +0% $30 | +5% $74 | +10% $118 |
| Rate | -1.0pp $100 | -0.5pp $65 | base $30 | +0.5pp $-7 | +1.0pp $-43 |
UW: 25.0% down · 7.5% · 30yr · 1.5% tax · 5.0% vac · 8.0% maint · 8.0% mgmt
Financing live
Cash to close
- Down payment
- $34,975
- Closing costs
- $4,197
- Reserves months
- —
- Total cash needed
- —
Loan-product check · same deal, 3 products live
Conventional
25% down · 7.5% · 30yr
- Down + closing
- —
- Monthly P&I
- —
- Monthly cashflow
- —
- DSCR
- —
- Eligible?
- —
Personal DTI + credit; lowest rate.
DSCR
20% down · 8.5% · 30yr
- Down + closing
- —
- Monthly P&I
- —
- Monthly cashflow
- —
- DSCR
- —
- Eligible?
- —
No personal income docs; deal must DSCR.
Hard money
10% down · 12.0% · 12mo
- Down + closing
- —
- Monthly P&I
- —
- Monthly cashflow
- —
- DSCR
- —
- Eligible?
- —
Short-term bridge; refi at stabilization.
Rent comps 13 comps
| Address | Beds | Baths | Sqft | Rent | $/sqft | DOM | Units | Dist |
|---|---|---|---|---|---|---|---|---|
| 1320 S 19th St Terre Haute, IN | 2.0 | 1.0 | 830 | $700 | $0.84 | 44d | 1 | 0.12mi |
| 501 S 19th St Terre Haute, IN | 2.0 | 1.0 | 1200 | $975 | $0.81 | 44d | 1 | 0.50mi |
| 435 S 18th St Terre Haute, IN | 3.0 | 1.0 | 1108 | $1,050 | $0.95 | 44d | 1 | 0.58mi |
| 1915 Poplar St Unit A Terre Haute, IN | 3.0 | 1.0 | 1412 | $1,200 | $0.85 | 44d | 1 | 0.61mi |
| 433 S 25th St Terre Haute, IN | 2.0 | 1.0 | 760 | $995 | $1.31 | 44d | 1 | 0.66mi |
| 1701 Ohio St Unit C Terre Haute, IN | 2.0 | 1.0 | 880 | $950 | $1.08 | 44d | 1 | 0.81mi |
| 1201 S 7th St Unit 3 Terre Haute, IN | 3.0 | 1.0 | 880 | $925 | $1.05 | 44d | 1 | 1.14mi |
| 1611 S 7th St Apt 4 Terre Haute, IN | 2.0 | 1.0 | 1022 | $795 | $0.78 | 44d | 1 | 1.19mi |
| 600 S Center St Unit 602 Terre Haute, IN | 3.0 | 1.5 | 1500 | $2,500 | $1.67 | 44d | 1 | 1.26mi |
| 2440 S 11th St Terre Haute, IN | 2.0 | 1.0 | 800 | $1,000 | $1.25 | 44d | 1 | 1.28mi |
| 500 College Ave Terre Haute, IN | 2.0 | 1.0 | 809 | $792 | $0.98 | 44d | 14 | 1.37mi |
| 66 Pear Tree Ln Terre Haute, IN | 2.0 | 1.0 | 868 | $875 | $1.01 | 44d | 1 | 1.38mi |
| 1011 S 4th St Terre Haute, IN | 2.0 | 1.0 | 1268 | $750 | $0.59 | 44d | 1 | 1.44mi |
Listing history 2 events
-
2026-06-07remarks 662-char remark
-
2026-06-07$139,900 Pending 2 DOM
ⓘ Source: listings_history table (triggers on properties + properties_extension) + one-shot
backfill from property_details.listing_events for pre-trigger history.
Tax reassessment forecast IN · Partial reset (capped growth)
- Current annual tax
- $721 · $60/mo
- Projected year-2 tax
- $955 · $80/mo
- Expected delta
- +$234/yr (+$20/mo · 32.5%)
ⓘ Screening estimate from a state-policy table — verify with the county assessor before closing.
Climate risk First Street
- Flood 4/10 Moderate FEMA zone X (unshaded) · 24% chance over 30 yrs
- Wildfire 3/10 Moderate
- Heat 4/10 Moderate 7 d/yr ≥104°F today · 18 d/yr by 30 yrs out
- Wind 2/10 Low 100% chance of damaging wind over 30 yrs
- Air quality 3/10 Moderate 3 unhealthy d/yr today · 4 by 30 yrs out
Nearby sold comps map
Loading sold comps map…
Walkable amenities ~0.75 mi
Loading nearby amenities…
Taxation est. · year 1
- Rental income
- $13,392
- − Mortgage interest
- −$7,837
- − Property taxes
- −$721
- − Insurance
- −$700
- − Repairs & maintenance
- −$1,071
- − Management
- −$1,071
- − Depreciation
- −$4,070
- Taxable loss
- −$2,077
- Est. tax savings @ 24.0%
- +$499
- After-tax cash flow
- $854/yr
For passive investors: Depreciation is non-cash, so a rental often shows a tax loss while cash-flowing — sheltering income. Rental losses are passive: they offset passive income freely, and up to $25,000/yr can offset ordinary (W-2) income if you actively participate and your MAGI is under $100k (phasing out to $0 by $150k); unused losses carry forward. On sale, claimed depreciation is recaptured at up to 25%, and gains may owe capital-gains tax (a 1031 exchange can defer both). Figures are a year-1 estimate at your 24.0% rate — not tax advice; consult a CPA.
Schools (NCES district)
- District
- Vigo County School Corporation
- NCES district ID
- 1812090
- Math proficiency
- 32% ▼ -10.00%
- Reading proficiency
- 37% ▼ -8.00%
- Median HH income
- $40,100
- Composite
- 28.97/100
- National rank
- #6625
- State rank
- #202 of 301 in IN
Livability — Terre Haute
- Score
- 75/100
- State rank
- #63
- US rank
- #4186
Category grades
Schools grade is shown separately in the Schools card above.
Census & demographics
- Census place
- Terre Haute, IN
- County
- Vigo County · 91,193 people
- City population
- 91,193
- Metro
- Terre Haute, IN
- Population (ZIP)
- 21,746
- Household income
- $60,565
- Rent vs Own
- Severe rent burden
- 571.0
Population outlook (Vigo County) Hauer SSP2
- Today (2025)
- 106,366 people
- By 2030
- 105,674 · -0.7%
- By 2040
- 103,731 · -2.5%
- By 2050
- 101,200 · -4.9%
- By 2075
- 95,674 · -10.1%
- By 2100
- 85,910 · -19.2%
Race, ethnicity, and origin ACS 2023
- Neighborhood character
- Predominantly White (86%)
- Race & ethnicity
- White 86% Asian 5% Two or more races 4% Black 3% Hispanic / Latino 3%
- Common ancestry
- Slovak 2% Lithuanian 2% Italian 1%
- Foreign-born
- 5% · China, Canada
- Languages at home
- 94% English-only · Chinese 2% Spanish 1% Other Asian/Pacific 1%
Political lean MEDSL · Vigo
- 2024 margin
- R (+18.1) · D 40.0% · R 58.1% · Other 2.0%
- 2008→2024 swing
- -33.9pp toward R · 2008: 15.8pp · 2024: -18.1pp
- All cycles
- 2024: R+18.1 2020: R+14.7 2016: R+15.2 2012: D+0.8 2008: D+15.8
Not yet ingested
- Civics
- —
Market trends
- HPI YoY
- ▼ -69.70%
- Current HPI
- 173.6547
- Rent YoY
- ▲ 4.09%
- Metro
- Terre Haute, IN
- State GDP YoY
- ▲ 2.90%
- F500 in state
- 18
Industry mix (Fortune 500 HQ in IN)
| Industry | F500 HQs | Revenue |
|---|---|---|
| Industrial Machinery | 2 | $37B |
|
||
| Healthcare | 1 | $177B |
|
||
| Pharmaceuticals | 1 | $45B |
|
||
| Metals / Steel | 1 | $18B |
|
||
| Agriculture | 1 | $17B |
|
||
| Packaging | 1 | $12B |
|
||
Price history
+115.2% since first listed5 events — show timeline
- 2026-06-07 Pending — THAAR
- 2026-06-05 Listed $139,900 THAAR
- 2025-11-07 Sold (MLS) $48,000 MIBOR as Distributed by MLS Grid
- 2025-11-03 Pending — MIBOR as Distributed by MLS Grid
- 2025-10-22 Listed $65,000 MIBOR as Distributed by MLS Grid
Property tax history
+8.9%/yrLatest (2024): $721 · +4.4% YoY. Source: county tax records.
Cash-flow waterfall
monthlySold comps — $/sqft
last 12 mo · ≤1 miLoading sold comps…