 🏷️ Likely Rental
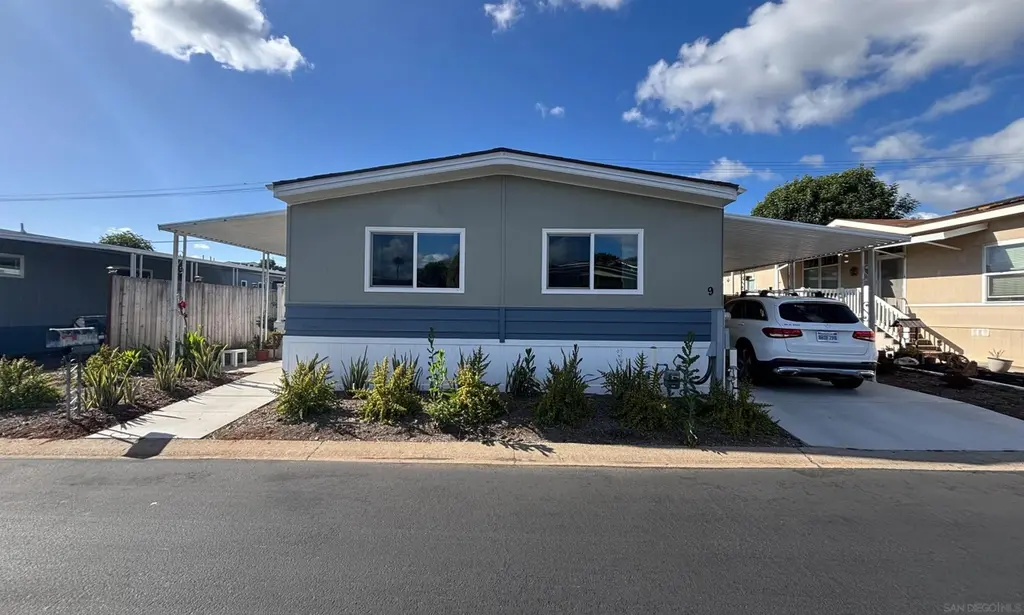
971 Borden Rd #9 · San Marcos, CA
Flood risk 1/10 · Minimal
- FEMA flood zone
- X (unshaded)
- Chance of flooding over 30 yrs
- 0.0%
- Est. flood insurance / yr
- $507 – $1,088
Fire risk 6/10 · Moderate
- Est. fire insurance / yr
- $659 – $1,223
Heat risk 5/10 · Moderate
- Hot days now (above 97°F)
- 7 days/yr
- Hot days in 30 yrs
- 23 days/yr
Wind risk 1/10 · Minimal
- Chance of severe wind over 30 yrs
- —
Air-quality risk 3/10 · Minor
- Unhealthy air days now
- 4 days/yr
- Unhealthy air days in 30 yrs
- 4 days/yr
Risk factors via First Street. Map © Google.
Why this score? — see what drove the B grade
The composite is a weighted blend of 9 inputs, each scored 0–100. Each bar is that input's sub-score; the figure is the points it added to the 100-point composite (weight × sub-score).
- Cash flow +24.8/30.0
- ARV discount +15.0/15.0
- DSCR +8.0/10.0
- 1% rule +6.4/10.0
- Schools +5.4/10.0
- Condition / age +4.0/5.0
- Livability +3.9/5.0
- Rent growth +2.6/5.0
- Appreciation +0.0/10.0
$264,000
🖨 Deal sheet 📄 Offer letter ✓ Due diligence
Listing remarks MLS
Remodeled, move in ready home available in a Family park w/ NO age restrictions and rent control! New central A/C, new dual pane windows, new interior & exterior paint, new flooring throughout, Quartz counters, new Kitchen & updated Bathrooms, all new fixtures and more! This open floor plan features a big great room that provides plenty of space to section of an area to convert to a 3rd bedroom or office if you desire! Both bedrooms feature walk in closets. The large driveway provides ample parking for up to 3 cars. A unique large private yard with two storage sheds! Great location nearby guest parking, community clubhouse, pool and amenities! Rancho San Marcos park offers a clubhouse, pool, spa, ample guest parking, and is located right across from Richland Elementary. Located in the San Marcos School District and walking distance to the newly remodeled Richland Elementary! Space rent is $1,500 per month + utilities.
Key facts
- 3 parking spots
- Community pool
- Built 1975
Property features AI
Finance
- Other: Pets allowed
- HOA & community: Community pool and clubhouse
Exterior
- Parking: 3 parking spaces
- Utilities: Sewer connected
- Home design: Mobile home (residential); Single-story; Entry at level 1
- Construction: Aluminum siding; Metal roof
- Exterior features: Wood fencing; Community pool; Community clubhouse; Shed(s); Sprinkler irrigation
Interior
- Kitchen: Built-in range; Dishwasher; Disposal
- Bedrooms: 3 possible bedrooms
- Flooring: Linoleum; Vinyl
- Bathrooms: 2 full bathrooms
- Heating & cooling: Central air conditioning; Forced air heating (natural gas)
- Interior features: Dishwasher; Disposal; Built-in range; Gas water heater; Linoleum and vinyl flooring
- Laundry & utility: Shared laundry in common area
Neighborhood map
What this means for you Summary
Snapshot
- This is a 2-bed/2.0-bath manufactured listed at $264k. Condition is rated good.
Deal economics
- At list price, monthly cash flow is $557 ($7k/yr) — positive.
- The deal already cash-flows at list — no discount required.
- Meets the 1% rule at list price ($3k rent vs $264k).
- Cap rate 8.8% vs local median 2.5% in San Marcos — top-decile yield for the area; either an underpriced asset or a hidden risk that comps aren't pricing in. Stress-test before assuming the spread holds.
Location & tenants
- Location reads 77/100 on livability (#80 in CA, #3,074 nationally) — a middle-class / working-renter tenant base. Strengths: amenities A+, commute A+, employment A+; Watch: health & safety D+, cost of living F.
- San Marcos Unified (suburban): math 52% / reading 67% proficiency, ranked #249 of 1,400 in CA (top 18%) — acceptable for families but not a draw, mixed tenant base, ~2y average lease.
- Market conditions: Rents flat; 115 active listings in the ZIP; 20 comparable units currently listed for rent nearby; rentals at typical pace (median 15d on market — plan ~3-4 weeks tenant-placement turnaround); solid renter incomes; 11,759 units permitted in San Diego County in 2024 (7,244 in 5+ unit buildings).
- This rent runs 37% of the median local income ($97k/yr) — at the standard rent-burdened threshold; future hikes will face affordability resistance.
Forward outlook
- Local home prices are declining (-3.0%/yr); year-one equity from $2k of loan paydown is wiped out by about $8k of value loss. Plan a longer hold.
- San Diego County population projected at +20% by 2050 — long-run rental-demand tailwind backs the buy-and-hold thesis.
Negotiation context
- Only 14 days on market — expect competitive offers; lowballing is unlikely to land.
- 2 sale attempts with the ask held roughly flat each time — persistent listings suggest the price (not the market) is what's stuck; bring a comps-based counter.
Risks & watch-outs
- Climate carrying-cost: major wildfire risk; extreme-heat days projected 7→23/yr by 2055 (HVAC capex compounding) — expect insurance premiums to compound above CPI over the hold.
Questions for the listing agent
- Built in 1975 — when were the roof, HVAC, electrical panel, plumbing, and water heater last replaced?
- Is there a deadline driving the sale (1031 exchange, divorce, estate, relocation)? That informs how much negotiation room exists.
- What's the average days-on-market for RENTAL listings here right now (not sales)? A rising rental-DOM trend means longer vacancies and softer asking-rent achievability than the comps imply.
- What's the recent tenant-quality profile in this submarket — average credit score on applications, eviction rate, late-payment / NSF rate, and stable-employment percentage? A property-management company in the area should have these aggregated.
- How much new for-sale + rental construction is in the pipeline within 1–3 miles? Heavy new supply typically softens prices + rents 12–24 months out; constrained supply supports both.
Investment metrics
- 1% rule
- 1.14% ✓
- Cap rate
- 8.82%
- Cash-on-cash
- 9.03%
- DSCR
- 1.40
- GRM
- 7.3
CMA / ARV
- ARV (on-the-fly)
- $377,200
- Comps found
- 7
Show comp detail 7 sales within ~0.75 mi
| Address | Dist | Beds/Ba | Sqft | Sold | Price | $/sf | Match |
|---|---|---|---|---|---|---|---|
| 971 Borden Rd #9 | 0.00mi | 2/2.0 | 1,152 (+0%) | 14mo | $245,000 | $213 | 88 |
| 971 Borden Rd #117 | 0.00mi | 2/2.0 | 1,248 (+8%) | 11mo | $225,000 | $180 | 77 |
| 1401 W El Norte Pkwy Spc 309 | 0.68mi | 2/2.0 | 1,152 (+0%) | 1mo | $442,900 | $384 | 67 |
| 909 Richland Rd Spc 122 | 0.16mi | 3/2.0 (+1) | 1,307 (+14%) | 21mo | $599,000 | $458 | 47 |
| 1401 El Norte Pkwy #217 | 0.68mi | 2/2.0 | 1,248 (+8%) | 10mo | $339,500 | $272 | 45 |
| 1401 El Norte Pkwy Spc 274 | 0.68mi | 2/2.0 | 1,250 (+9%) | 18mo | $410,000 | $328 | 39 |
| 1401 El Norte Pkwy Spc 35 Pkwy Spc 35 | 0.68mi | 3/2.0 (+1) | 1,041 (-10%) | 23mo | $430,000 | $413 | 28 |
Match score weights: distance 35% · size 25% · config 20% · recency 20%. Top-matched comps best support the ARV.
Projected returns pro-forma
-3.0% appreciation · 0.55% rent growth · sell at horizon
- IRR
- -5.4%
- Equity multiple
- 0.80×
- Total profit
- $-14,540
- Equity at exit
- $39,363
- IRR
- 1.0%
- Equity multiple
- 1.07×
- Total profit
- $4,832
- Equity at exit
- $22,826
Cash invested: $73,920 (down + closing). Projections, not guarantees.
Landlord ↔ Tenant lean methodology
- Overall (STATE)
- 18 Strongly Tenant-Friendly
- State California
- 18 Strongly Tenant-Friendly · D+13
- County
- — inherits STATE
- City
- — inherits STATE
ZIP-level market 92069
- Rents YoY
- 0.6%
- Active inventory
- 115
- Price-to-rent
- 7.3×
Monthly cashflow live
- Estimated rent
- $3,014 high interval (Pro) →
- Mortgage (P&I)
- −$1,384
- Tax est. 1.5%
- −$330 /mo · $3,960/yr
- Insurance
- −$110
- HOA
- −$0
- Vacancy / Maint / Mgmt
- −$633
- Net cashflow
- $557
Break-even live
UW: 25.0% down · 7.5% · 30yr · 1.5% tax · 5.0% vac · 8.0% maint · 8.0% mgmt
Financing live
Cash to close
- Down payment
- $66,000
- Closing costs
- $7,920
- Reserves months
- —
- Total cash needed
- —
Loan-product check · same deal, 3 products live
Conventional
25% down · 7.5% · 30yr
- Down + closing
- —
- Monthly P&I
- —
- Monthly cashflow
- —
- DSCR
- —
- Eligible?
- —
Personal DTI + credit; lowest rate.
DSCR
20% down · 8.5% · 30yr
- Down + closing
- —
- Monthly P&I
- —
- Monthly cashflow
- —
- DSCR
- —
- Eligible?
- —
No personal income docs; deal must DSCR.
Hard money
10% down · 12.0% · 12mo
- Down + closing
- —
- Monthly P&I
- —
- Monthly cashflow
- —
- DSCR
- —
- Eligible?
- —
Short-term bridge; refi at stabilization.
Rent comps 20 comps
| Address | Beds | Baths | Sqft | Rent | $/sqft | DOM | Units | Dist |
|---|---|---|---|---|---|---|---|---|
| 909 Richland Rd #89 San Marcos, CA | 2.0 | 2.0 | 1440 | $2,800 | $1.94 | 44d | 1 | 0.15mi |
| 975 Woodland Pkwy San Marcos, CA | 1.0–2.0 | 1.0–2.0 | 755 | $3,275 | $4.33 | 2d | 1 | 0.52mi |
| 452 Lynwood Ln San Marcos, CA | 3.0 | 2.0 | 1000 | $3,250 | $3.25 | 44d | 1 | 0.62mi |
| 772 Vineyard Rd Unit 772 San Marcos, CA | 2.0 | 1.0 | 861 | $2,600 | $3.02 | 44d | 1 | 0.80mi |
| 218 Woodland Pkwy #146 San Marcos, CA | 2.0 | 2.0 | 908 | $2,900 | $3.19 | 44d | 1 | 0.85mi |
| 220 Woodland Pkwy #250 San Marcos, CA | 1.0 | 1.0 | 700 | $3,500 | $5.00 | 44d | 1 | 0.85mi |
| 1920 Edith Dr Escondido, CA | 2.0 | 2.0 | 1330 | $3,699 | $2.78 | 2d | 1 | 0.86mi |
| 610 Sunset Ct San Marcos, CA | 3.0 | 2.0 | 1428 | $3,800 | $2.66 | 44d | 1 | 0.95mi |
| 1113 Privet St San Marcos, CA | 2.0 | 2.0 | 1008 | $2,595 | $2.57 | 24d | 1 | 1.09mi |
| 715 Ash Ln San Marcos, CA | 1.0–3.0 | 1.0–2.0 | 835 | $2,750 | $3.29 | 3d | 20 | 1.13mi |
| 595 Sirginson Rd Unit 97 San Marcos, CA | 2.0 | 1.0 | 832 | $3,100 | $3.73 | 24d | 1 | 1.13mi |
| 701 Ash Ln #202 San Marcos, CA | 3.0 | 2.0 | 919 | $2,895 | $3.15 | 15d | 1 | 1.15mi |
| 131 Avenida Chapala #105 San Marcos, CA | 3.0 | 2.5 | 1379 | $3,425 | $2.48 | 2d | 1 | 1.26mi |
| 570 E Barham Dr San Marcos, CA | 1.0–3.0 | 1.0–2.0 | 840 | $3,108 | $3.70 | 3d | 14 | 1.27mi |
| 506 E Barham Dr Unit 230 San Marcos, CA | 2.0 | 2.0 | 900 | $3,095 | $3.44 | 3d | 1 | 1.37mi |
| 506 E Barham Dr Unit 130 San Marcos, CA | 2.0 | 2.0 | 900 | $2,975 | $3.31 | 3d | 1 | 1.37mi |
| 506 E Barham Dr Unit 224 San Marcos, CA | 2.0 | 2.0 | 900 | $2,895 | $3.22 | 3d | 1 | 1.37mi |
| 506 E Barham Dr San Marcos, CA | 1.0–2.0 | 1.0–2.0 | 770 | $3,095 | $4.02 | 17d | 4 | 1.38mi |
| 295 Mission Villas Rd Unit 3 San Marcos, CA | 2.0 | 2.5 | 1105 | $3,100 | $2.81 | 13d | 1 | 1.45mi |
| 468 N Twin Oaks Valley Rd San Marcos, CA | 2.0 | 2.0 | 950 | $2,881 | $3.03 | 3d | 3 | 1.50mi |
Listing history 10 events
-
2026-06-18days on market $264,000 Active 14 DOM
-
2026-06-17days on market $264,000 Active 13 DOM
-
2026-06-16pricedays on market $264,000 Active 12 DOM
-
2026-06-15days on market $269,000 Active 11 DOM
-
2026-06-13days on market $269,000 Active 9 DOM
-
2026-06-09days on market $269,000 Active 5 DOM
-
2026-06-08days on market $269,000 Active 4 DOM
-
2026-06-07statusdays on market $269,000 Active 3 DOM
-
2026-06-04remarks 624-char remark
-
2026-06-04$269,000 Coming Soon 1 DOM
ⓘ Source: listings_history table (triggers on properties + properties_extension) + one-shot
backfill from property_details.listing_events for pre-trigger history.
Climate risk First Street
- Flood 1/10 Low FEMA zone X (unshaded) · 0% chance over 30 yrs
- Wildfire 6/10 Major
- Heat 5/10 Major 7 d/yr ≥97°F today · 23 d/yr by 30 yrs out
- Wind 1/10 Low
- Air quality 3/10 Moderate 4 unhealthy d/yr today · 4 by 30 yrs out
Nearby sold comps map
Loading sold comps map…
Walkable amenities ~0.75 mi
Loading nearby amenities…
Taxation est. · year 1
- Rental income
- $36,167
- − Mortgage interest
- −$14,788
- − Property taxes
- −$3,960
- − Insurance
- −$1,320
- − Repairs & maintenance
- −$2,893
- − Management
- −$2,893
- − Depreciation
- −$7,680
- Taxable income
- $2,632
- Est. tax owed @ 24.0%
- −$632
- After-tax cash flow
- $6,047/yr
For passive investors: Depreciation is non-cash, so a rental often shows a tax loss while cash-flowing — sheltering income. Rental losses are passive: they offset passive income freely, and up to $25,000/yr can offset ordinary (W-2) income if you actively participate and your MAGI is under $100k (phasing out to $0 by $150k); unused losses carry forward. On sale, claimed depreciation is recaptured at up to 25%, and gains may owe capital-gains tax (a 1031 exchange can defer both). Figures are a year-1 estimate at your 24.0% rate — not tax advice; consult a CPA.
Condition & rehab AI · 12 photos
This move-in ready manufactured home is in good condition with recent updates, including new dual-pane windows and quartz countertops. It offers a good balance of curb appeal and functionality.
Value-add opportunities
- Both Landscaping and irrigation system — Enhances curb appeal and water efficiency
- Both Carport roof replacement — Improves structural integrity and enhances curb appeal
Renovation cost estimate screening
Value-add ROI direction
- Both Landscaping and irrigation system — Enhances curb appeal and water efficiency ↑
- Both Carport roof replacement — Improves structural integrity and enhances curb appeal ↑
ⓘ Cost ranges are severity-bucket heuristics (US national rule-of-thumb). Get contractor quotes + a written scope before underwriting a rehab budget.
Schools (NCES district)
- District
- San Marcos Unified
- NCES district ID
- 0634880
- Math proficiency
- 52% ▲ 1.00%
- Reading proficiency
- 67% ▲ 2.00%
- Median HH income
- $64,752
- Composite
- 53.67/100
- National rank
- #3093
- State rank
- #249 of 1400 in CA
Livability — San Marcos
- Score
- 77/100
- State rank
- #80
- US rank
- #3074
Category grades
Schools grade is shown separately in the Schools card above.
Census & demographics
- Census place
- San Marcos, CA
- County
- San Diego County · 3,178,799 people
- City population
- 100,940
- Metro
- San Diego-Chula Vista-Carlsbad, CA
- Population (ZIP)
- 47,335
- Household income
- $96,771
- Rent vs Own
- Severe rent burden
- 2399.0
Population outlook (San Diego County) Hauer SSP2
- Today (2025)
- 3,678,185 people
- By 2030
- 3,856,546 · +4.8%
- By 2040
- 4,171,407 · +13.4%
- By 2050
- 4,421,607 · +20.2%
- By 2075
- 4,831,599 · +31.4%
- By 2100
- 4,832,502 · +31.4%
Race, ethnicity, and origin ACS 2023
- Neighborhood character
- Diverse neighborhood (Simpson 0.64)
- Race & ethnicity
- Hispanic / Latino 46% White 36% Two or more races 20% Asian 11% Native American 1% Black 1%
- Hispanic origin (detail)
- Mexican 41%
- Common ancestry
- Lithuanian 2% Romanian 2% Portuguese 2%
- Foreign-born
- 26% · Canada, China, Vietnam
- Languages at home
- 57% English-only · Spanish 32% Tagalog/Filipino 2% Other Asian/Pacific 2%
Political lean MEDSL · San Diego
- 2024 margin
- D (+16.8) · D 56.9% · R 40.1% · Other 2.9%
- 2008→2024 swing
- +6.6pp toward D · 2008: 10.2pp · 2024: 16.8pp
- All cycles
- 2024: D+16.8 2020: D+22.8 2016: D+17.8 2012: D+5.1 2008: D+10.2
Not yet ingested
- Civics
- —
Market trends
- HPI YoY
- ▼ -522.69%
- Current HPI
- 376.182
- Rent YoY
- ▲ 0.55%
- Metro
- San Diego-Chula Vista-Carlsbad, CA
- State GDP YoY
- ▲ 3.21%
- F500 in state
- 116
Industry mix (Fortune 500 HQ in CA)
| Industry | F500 HQs | Revenue |
|---|---|---|
| Technology | 27 | $1,492B |
|
||
| Financial Services | 3 | $174B |
|
||
| Retail | 3 | $44B |
|
||
| Insurance | 3 | $26B |
|
||
| Media / Entertainment | 2 | $115B |
|
||
| Pharmaceuticals / Biotech | 2 | $62B |
|
||
Price history
+7.6% since first listed5 events — show timeline
- 2026-06-04 Listed $269,000 SDMLS
- 2026-06-03 Coming Soon $269,000 SDMLS
- 2025-05-06 Sold (MLS) $245,000 CRMLS
- 2025-04-24 Pending — CRMLS
- 2025-03-26 Listed $249,900 CRMLS
Cash-flow waterfall
monthlySold comps — $/sqft
last 12 mo · ≤1 miLoading sold comps…