1053 N Scales St · Reidsville, NC
Flood risk 1/10 · Minimal
- FEMA flood zone
- X (unshaded)
- Chance of flooding over 30 yrs
- 0.0%
- Est. flood insurance / yr
- $507 – $1,088
Fire risk 3/10 · Minor
- Est. fire insurance / yr
- $906 – $1,684
Heat risk 5/10 · Moderate
- Hot days now (above 103°F)
- 7 days/yr
- Hot days in 30 yrs
- 18 days/yr
Wind risk 4/10 · Minor
- Chance of severe wind over 30 yrs
- 7.0%
Air-quality risk 3/10 · Minor
- Unhealthy air days now
- 2 days/yr
- Unhealthy air days in 30 yrs
- 3 days/yr
Risk factors via First Street. Map © Google.
Why this score? — see what drove the B- grade
The composite is a weighted blend of 9 inputs, each scored 0–100. Each bar is that input's sub-score; the figure is the points it added to the 100-point composite (weight × sub-score).
- Cash flow +30.0/30.0
- 1% rule +10.0/10.0
- DSCR +10.0/10.0
- ARV discount +7.5/15.0
- Schools +3.3/10.0
- Livability +3.0/5.0
- Rent growth +2.5/5.0
- Condition / age +2.5/5.0
- Appreciation +0.0/10.0
$49,900
🖨 Deal sheet (PDF) 📄 Offer letter ✓ Due diligence
Listing remarks
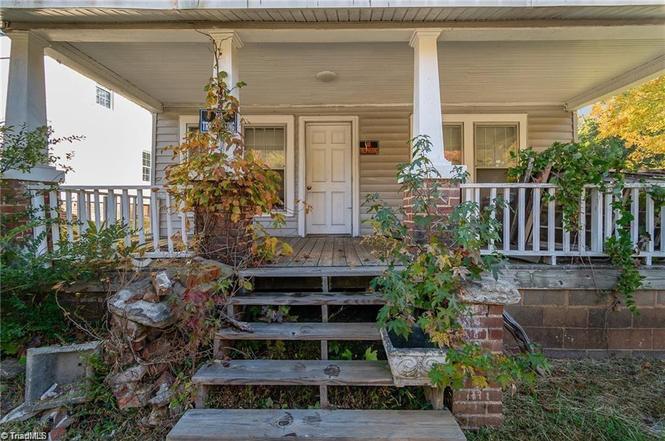
A renovation not completed. All plumbing and electrical has already been replaced in the entire house - The plumbing to the retaining wall just before the sidewalk. The fun parts - putting in your own personal touches - haven't been completed yet so this is a most ideal project for the first time flipper or seasoned renovator. Note a lot of new building materials are present in the house and what you see will remain for you to finish the project with minimal expense. House is condemned so all work will need to be completed to get it out of condemned status with the City and obtain a new CO.
Key facts
- 5,662 sq ft lot
- Built 1924
- Listed 78 days
Property features AI
Finance
- Other: Three fireplaces total; Bonus rooms and flexible living spaces
- HOA & community: No homeowners association
Exterior
- Parking: Driveway parking; no garage
- Utilities: Public water; Public sewer; Electric water heater
- Home design: Residential stick/site-built house; One-and-one-half stories; Built in 1924; Existing structure
- Construction: Wood siding construction
- Exterior features: City lot; Sloped/stepped lot; Lot dimensions approximately 49 x 120 x 49 x 115; Lot number E-11; Public-maintained road access
Interior
- Kitchen: Electric water heater
- Bedrooms: Bedrooms located on the Main and Second levels (multiple bonus rooms listed)
- Bathrooms: 1 full bathroom
- Heating & cooling: Forced air heating; Electric heating; No central cooling listed
- Interior features: Crawl space basement (no finished basement); Three fireplaces, one located in the den; Ten total rooms
- Laundry & utility: Electric heating system (see Heating & Cooling for details)
Neighborhood map
What this means for you Summary
Snapshot
- This is a 3-bed/1.0-bath single-family listed at $50k.
Deal economics
- At list price, monthly cash flow is $387 ($5k/yr) — positive.
- The deal already cash-flows at list — no discount required.
- Meets the 1% rule at list price ($913 rent vs $50k).
- Recommended offer: $47k (6.0% below list) — sets the bar for market timing.
- Cap rate 15.6% vs local median 3.7% in Reidsville — top-decile yield for the area; either an underpriced asset or a hidden risk that comps aren't pricing in. Stress-test before assuming the spread holds.
Location & tenants
- Location reads 59/100 on livability (#553 in NC) — a working-class tenant base; expect higher turnover. Strengths: cost of living A+, housing A; Watch: crime F, amenities F, commute F.
- Rockingham County Schools (rural): math 38% / reading 40% proficiency, ranked #120 of 178 in NC (top 67%) — families likely to look elsewhere, expect single-tenant / working-renter base with shorter leases.
- Zoned schools: Reidsville Middle (math 27% / reading 33%, grade F, #335 of 475 statewide, top 72%, 614 students, 100% FRL); Reidsville High (math 42% / reading 32%, grade F, #414 of 535 statewide, top 79%, 753 students, 100% FRL) — zoned schools average 100% FRL vs 52% district-wide (48 pts higher); higher-poverty schools than district average — tighter screening recommended.
- Market conditions: 258 active listings in the ZIP; 3 comparable units currently listed for rent nearby; rentals at typical pace (median 25d on market — plan ~3-4 weeks tenant-placement turnaround); 344 units permitted in Rockingham County in 2024 (0 in 5+ unit buildings).
Forward outlook
- Local home prices are declining (-3.0%/yr); year-one equity from $345 of loan paydown is wiped out by about $1k of value loss. Plan a longer hold.
- Rockingham County population projected at -22% by 2050 — secular population decline; favor cash flow + early exit over multi-decade hold.
- At projected returns (-3.0% appreciation + 3.0% rent growth), your $14k cash investment doubles in ~4 years — after that, you're playing with house money.
Negotiation context
- It's been on market 78 days — a 6% lower offer ($47k) is reasonable based on typical stale-listing flexibility.
- 3 sale attempts with the ask held roughly flat each time — persistent listings suggest the price (not the market) is what's stuck; bring a comps-based counter.
Risks & watch-outs
- Watch-outs: built in 1924 — expect roof / HVAC / electrical / plumbing capex.
- Climate carrying-cost: extreme-heat days projected 7→18/yr by 2055 (HVAC capex compounding) — expect insurance premiums to compound above CPI over the hold.
Questions for the listing agent
- It's been on market 78 days. Have you received any prior offers? Is the seller open to a 6% concession, seller financing, or rate buy-down credit?
- Built in 1924 — when were the roof, HVAC, electrical panel, plumbing, and water heater last replaced?
- Why hasn't it sold? Are there any deal-killer items the seller is aware of (foundation, flood, title, zoning, code violations)?
- Is there a deadline driving the sale (1031 exchange, divorce, estate, relocation)? That informs how much negotiation room exists.
- Schools are D-rated, which usually means shorter tenancies and higher turnover. Who's the typical renter profile here, and what's been the actual vacancy rate?
- Crime grade is F in this area — have there been break-ins, vandalism, or insurance claims at this property in the last 3 years? What carrier currently insures it and at what premium?
- What's the average days-on-market for RENTAL listings here right now (not sales)? A rising rental-DOM trend means longer vacancies and softer asking-rent achievability than the comps imply.
- What's the recent tenant-quality profile in this submarket — average credit score on applications, eviction rate, late-payment / NSF rate, and stable-employment percentage? A property-management company in the area should have these aggregated.
- How much new for-sale + rental construction is in the pipeline within 1–3 miles? Heavy new supply typically softens prices + rents 12–24 months out; constrained supply supports both.
Investment metrics
- 1% rule
- 1.83% ✓
- Cap rate
- 15.60%
- Cash-on-cash
- 33.24%
- DSCR
- 2.48
- GRM
- 4.6
CMA / ARV
- ARV (on-the-fly)
- $158,696
- Comps found
- 12
Show comp detail 12 sales within ~0.75 mi
| Address | Dist | Beds/Ba | Sqft | Sold | Price | $/sf | Match |
|---|---|---|---|---|---|---|---|
| 626 King St | 0.23mi | 3/1.0 | 965 (+1%) | 2mo | $160,000 | $166 | 86 |
| 903 Norman St | 0.33mi | 3/1.0 | 957 (+0%) | 1mo | $180,000 | $188 | 84 |
| 503 Carroll St | 0.40mi | 3/1.0 | 884 (-8%) | 0mo | $156,500 | $177 | 69 |
| 304 Roanoke St | 0.55mi | 3/1.0 | 1,025 (+7%) | 3mo | $175,000 | $171 | 59 |
| 704 Roach St | 0.46mi | 2/1.5 (-1) | 874 (-9%) | 2mo | $33,000 | $38 | 55 |
| 1305 Wentworth St | 0.61mi | 2/1.0 (-1) | 960 (+0%) | 14mo | $197,000 | $205 | 54 |
| 971 Willow St | 0.72mi | 3/1.0 | 1,020 (+7%) | 3mo | $152,500 | $150 | 53 |
| 912 Wilson St | 0.43mi | 3/1.0 | 839 (-12%) | 10mo | $120,000 | $143 | 51 |
| 29 Circle Dr | 0.64mi | 3/1.0 | 875 (-8%) | 10mo | $32,000 | $37 | 48 |
| 151 Holly Hill Dr | 0.60mi | 3/1.5 | 1,032 (+8%) | 12mo | $205,000 | $199 | 47 |
| 702 Roach St | 0.46mi | 2/1.0 (-1) | 812 (-15%) | 10mo | $130,000 | $160 | 40 |
| 1012 Autumn Ln | 0.66mi | 3/2.0 | 1,073 (+12%) | 12mo | $166,700 | $155 | 35 |
Match score weights: distance 35% · size 25% · config 20% · recency 20%. Top-matched comps best support the ARV.
Projected returns pro-forma
-3.0% appreciation · 3.0% rent growth · sell at horizon
- IRR
- 28.5%
- Equity multiple
- 2.19×
- Total profit
- $16,574
- Equity at exit
- $7,440
- IRR
- 35.9%
- Equity multiple
- 4.31×
- Total profit
- $46,207
- Equity at exit
- $4,314
Cash invested: $13,972 (down + closing). Projections, not guarantees.
Landlord ↔ Tenant lean methodology
- Overall (STATE)
- 85 Strongly Landlord-Friendly
- State North Carolina
- 85 Strongly Landlord-Friendly · R+3
- County
- — inherits STATE
- City
- — inherits STATE
ZIP-level market 27320
- Home prices YoY
- -30.8%
- Active inventory
- 258
- Price-to-rent
- 4.6×
Monthly cashflow live
- Estimated rent
- $913 medium interval (Pro) →
- Mortgage (P&I)
- −$262
- Tax from tax record
- −$52 /mo · $623/yr
- Insurance
- −$21
- HOA
- −$0
- Vacancy / Maint / Mgmt
- −$192
- Net cashflow
- $387
Break-even live
Sensitivity live
| Price | -10% $415 | -5% $401 | +0% $387 | +5% $373 | +10% $359 |
|---|---|---|---|---|---|
| Rent | -10% $315 | -5% $351 | +0% $387 | +5% $423 | +10% $459 |
| Rate | -1.0pp $412 | -0.5pp $400 | base $387 | +0.5pp $374 | +1.0pp $361 |
UW: 25.0% down · 7.5% · 30yr · 1.5% tax · 5.0% vac · 8.0% maint · 8.0% mgmt
Financing live
Cash to close
- Down payment
- $12,475
- Closing costs
- $1,497
- Reserves months
- —
- Total cash needed
- —
Loan-product check · same deal, 3 products live
Conventional
25% down · 7.5% · 30yr
- Down + closing
- —
- Monthly P&I
- —
- Monthly cashflow
- —
- DSCR
- —
- Eligible?
- —
Personal DTI + credit; lowest rate.
DSCR
20% down · 8.5% · 30yr
- Down + closing
- —
- Monthly P&I
- —
- Monthly cashflow
- —
- DSCR
- —
- Eligible?
- —
No personal income docs; deal must DSCR.
Hard money
10% down · 12.0% · 12mo
- Down + closing
- —
- Monthly P&I
- —
- Monthly cashflow
- —
- DSCR
- —
- Eligible?
- —
Short-term bridge; refi at stabilization.
Rent comps 3 comps
| Address | Beds | Baths | Sqft | Rent | $/sqft | DOM | Units | Dist |
|---|---|---|---|---|---|---|---|---|
| 202 Mulberry St Reidsville, NC | 2.0 | 1.0 | 899 | $1,025 | $1.14 | 25d | 1 | 0.43mi |
| 528 N Scales St Unit C Reidsville, NC | 2.0 | 1.0 | 1080 | $825 | $0.76 | 25d | 1 | 0.44mi |
| 110 Arlington St Reidsville, NC | 2.0 | 1.0 | 1000 | $850 | $0.85 | 25d | 1 | 0.87mi |
Listing history 18 events
-
2026-06-13statusdays on market $49,900 Pending 78 DOM
-
2026-06-10days on market $49,900 Active 76 DOM
-
2026-06-09days on market $49,900 Active 75 DOM
-
2026-06-08days on market $49,900 Active 74 DOM
-
2026-06-07days on market $49,900 Active 73 DOM
-
2026-06-03days on market $49,900 Active 69 DOM
-
2026-06-02days on market $49,900 Active 68 DOM
-
2026-06-01days on market $49,900 Active 67 DOM
-
2026-05-31days on market $49,900 Active 66 DOM
-
2026-05-31days on market $49,900 Active 65 DOM
-
2026-04-15status Active
-
2026-02-26status Pending
-
2026-02-06$49,900 Active
-
2025-12-08price $54,900
-
2025-04-19historical
-
2025-03-05price $79,900
-
2025-03-05$79,900 Active
-
2025-01-10price $94,900
ⓘ Source: listings_history table (triggers on properties + properties_extension) + one-shot
backfill from property_details.listing_events for pre-trigger history.
Tax reassessment forecast NC · Resets to sale price
- Current annual tax
- $623 · $52/mo
- Projected year-2 tax
- $623 · $52/mo
- Expected delta
- $0/yr ($0/mo · 0.0%)
ⓘ Screening estimate from a state-policy table — verify with the county assessor before closing.
Climate risk First Street
- Flood 1/10 Low FEMA zone X (unshaded) · 0% chance over 30 yrs
- Wildfire 3/10 Moderate
- Heat 5/10 Major 7 d/yr ≥103°F today · 18 d/yr by 30 yrs out
- Wind 4/10 Moderate 7% chance of damaging wind over 30 yrs
- Air quality 3/10 Moderate 2 unhealthy d/yr today · 3 by 30 yrs out
Nearby sold comps map
Loading sold comps map…
Walkable amenities ~0.75 mi
Loading nearby amenities…
Taxation est. · year 1
- Rental income
- $10,959
- − Mortgage interest
- −$2,795
- − Property taxes
- −$623
- − Insurance
- −$250
- − Repairs & maintenance
- −$877
- − Management
- −$877
- − Depreciation
- −$1,452
- Taxable income
- $4,086
- Est. tax owed @ 24.0%
- −$981
- After-tax cash flow
- $3,664/yr
For passive investors: Depreciation is non-cash, so a rental often shows a tax loss while cash-flowing — sheltering income. Rental losses are passive: they offset passive income freely, and up to $25,000/yr can offset ordinary (W-2) income if you actively participate and your MAGI is under $100k (phasing out to $0 by $150k); unused losses carry forward. On sale, claimed depreciation is recaptured at up to 25%, and gains may owe capital-gains tax (a 1031 exchange can defer both). Figures are a year-1 estimate at your 24.0% rate — not tax advice; consult a CPA.
Schools (NCES district)
- District
- Rockingham County Schools
- NCES district ID
- 3703990
- Math proficiency
- 38% ▼ -2.00%
- Reading proficiency
- 40% ▲ 1.00%
- Median HH income
- $38,914
- Composite
- 32.6/100
- National rank
- #5673
- State rank
- #120 of 178 in NC
Livability — Reidsville
- Score
- 59/100
- State rank
- #553
- US rank
- #20359
Category grades
Schools grade is shown separately in the Schools card above.
Census & demographics
- Census place
- Reidsville, NC
- City population
- 38,610
- Population (ZIP)
- 38,610
Population outlook (Rockingham County) Hauer SSP2
- Today (2025)
- 87,103 people
- By 2030
- 83,763 · -3.8%
- By 2040
- 76,082 · -12.7%
- By 2050
- 68,106 · -21.8%
- By 2075
- 52,531 · -39.7%
- By 2100
- 39,871 · -54.2%
Race, ethnicity, and origin ACS 2023
- Neighborhood character
- Majority White (64%)
- Race & ethnicity
- White 64% Black 23% Two or more races 8% Hispanic / Latino 7%
- Hispanic origin (detail)
- Mexican 4%
- Common ancestry
- Slovak 2% Serbian 2% Italian 2%
- Foreign-born
- 3% · Canada
- Languages at home
- 94% English-only · Spanish 5%
Political lean MEDSL · Rockingham
- 2024 margin
- Solid R (+35.9) · D 31.7% · R 67.6%
- 2008→2024 swing
- -19.9pp toward R · 2008: -16.0pp · 2024: -35.9pp
- All cycles
- 2024: R+35.9 2020: R+32.0 2016: R+30.0 2012: R+21.3 2008: R+16.0
Not yet ingested
- Civics
- —
Market trends
- HPI YoY
- ▼ -91.42%
- Current HPI
- 205.028
- Rent YoY
- —
- Metro
- —
- State GDP YoY
- ▲ 3.28%
- F500 in state
- 26
Industry mix (Fortune 500 HQ in NC)
| Industry | F500 HQs | Revenue |
|---|---|---|
| Financial Services | 2 | $213B |
|
||
| Retail | 2 | $95B |
|
||
| Industrial Conglomerate | 1 | $38B |
|
||
| Metals / Steel | 1 | $35B |
|
||
| Utilities | 1 | $30B |
|
||
| Industrial Machinery | 1 | $19B |
|
||
Price history
-47.4% since first listed8 events — show timeline
- 2026-04-15 Relisted — Triad MLS
- 2026-02-26 Pending — Triad MLS
- 2026-02-06 Listed $49,900 Triad MLS
- 2025-12-08 Price Changed $54,900 Triad MLS
- 2025-04-19 Listing Removed — TMLS
- 2025-03-05 Price Changed $79,900 Triad MLS
- 2025-03-05 Listed $79,900 TMLS
- 2025-01-10 Price Changed $94,900 Triad MLS
Property tax history
+0.8%/yrLatest (2025): $623 · +0.0% YoY. Source: county tax records.
Cash-flow waterfall
monthlySold comps — $/sqft
last 12 mo · ≤1 miLoading sold comps…