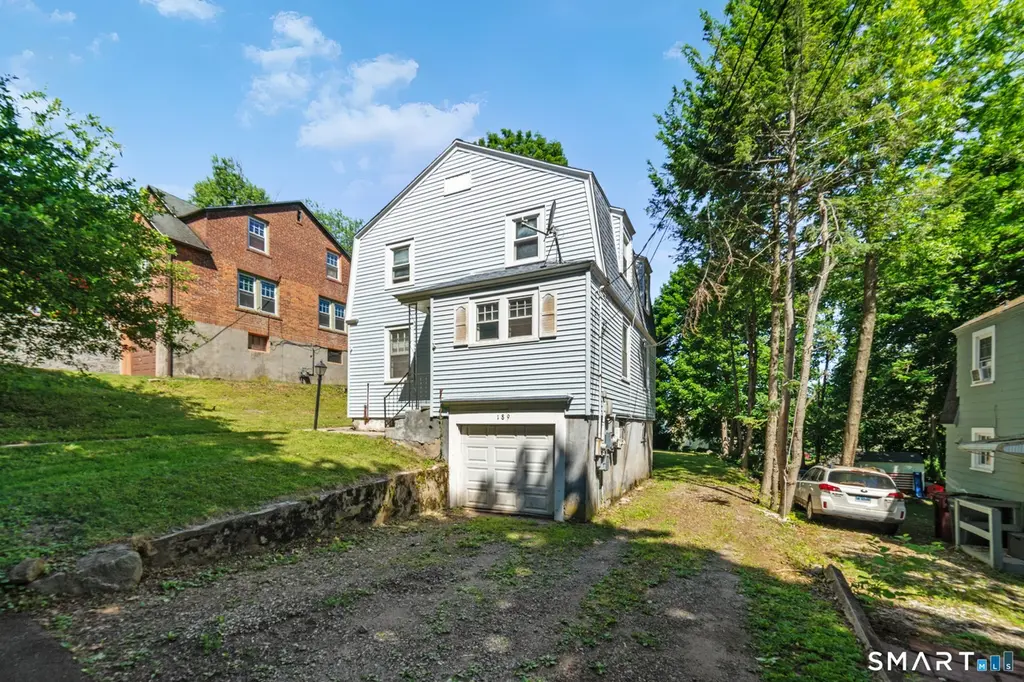
189 Andrew Ave · Naugatuck, CT
Flood risk 6/10 · Moderate
- FEMA flood zone
- X (unshaded)
- Chance of flooding over 30 yrs
- 0.7%
- Est. flood insurance / yr
- $473 – $860
Fire risk 4/10 · Minor
- Est. fire insurance / yr
- $829 – $1,539
Heat risk 5/10 · Moderate
- Hot days now (above 97°F)
- 7 days/yr
- Hot days in 30 yrs
- 16 days/yr
Wind risk 6/10 · Moderate
- Chance of severe wind over 30 yrs
- 27.0%
Air-quality risk 3/10 · Minor
- Unhealthy air days now
- 2 days/yr
- Unhealthy air days in 30 yrs
- 4 days/yr
Risk factors via First Street. Map © Google.
Why this score? — see what drove the D+ grade
The composite is a weighted blend of 9 inputs, each scored 0–100. Each bar is that input's sub-score; the figure is the points it added to the 100-point composite (weight × sub-score).
- Cash flow +14.2/30.0
- ARV discount +12.8/15.0
- DSCR +4.3/10.0
- Rent growth +4.1/5.0
- 1% rule +3.9/10.0
- Livability +3.9/5.0
- Schools +3.3/10.0
- Condition / age +2.5/5.0
- Appreciation +0.0/10.0
$299,900
🖨 Deal sheet (PDF) 📄 Offer letter ✓ Due diligence
Listing remarks
Spacious 5-bedroom, 2-full-bath Colonial offering over 1,700 sq ft of living space in Naugatuck's desirable Andrew Avenue neighborhood. Expanded over the years to accommodate today's living needs, this home provides a flexible floor plan with room for everyone while maintaining its classic charm. The property has been well maintained and features a roof approximately 9 years old, vinyl siding, and a layout that is comfortable as-is while offering opportunities to update and personalize to your own style. Generous room sizes, abundant living space, and endless potential make this a property worth exploring. A front under-house garage offers convenient interior access to the home, while the o
Key facts
- Flexible floor plan
- Vinyl siding
- Workshop
Tags
Property features AI
Exterior
- Parking: Attached garage; 3 total garage spaces; Driveway (private, crushed stone/gravel); Unpaved parking areas; 2 parking spaces (total listed)
- Utilities: Public water connected; Public sewer connected (sewer fee approximately $150 every 3 months); Domestic hot water from oil; Electric service (standard)
- Home design: Single family home; Blue exterior siding
- Construction: Frame and concrete construction; Vinyl siding; Concrete foundation; Asphalt shingle roof
- Exterior features: Lighting; Level, sloping and open lot
Interior
- Kitchen: Gas range; Refrigerator; Freezer
- Bedrooms: 5 bedrooms
- Bathrooms: 2 full bathrooms
- Heating & cooling: Hot water heat (oil fuel); Window unit cooling; Above-ground fuel tank
- Interior features: Cable available; Foyer; Workshop; Full unfinished basement with garage and interior access and concrete floor; Attic with access via hatch; Total of 8 rooms
- Laundry & utility: Washer; Electric dryer; Laundry located in the basement (lower level)
Neighborhood map
What this means for you Summary
Snapshot
- This is a 5-bed/2.0-bath single-family listed at $300k.
Deal economics
- At list price, monthly cash flow is $51 ($615/yr) — positive.
- The deal already cash-flows at list — no discount required.
- To meet the 1% rule (rent ≥ 1% of price), the offer needs to be $267k (10.8% below list).
- Recommended offer: $267k (10.8% below list) — sets the bar for 1% rule.
- Cap rate 6.5% vs local median 3.4% in Naugatuck — top-decile yield for the area; either an underpriced asset or a hidden risk that comps aren't pricing in. Stress-test before assuming the spread holds.
Location & tenants
- Location reads 77/100 on livability (#42 in CT, #2,997 nationally) — a middle-class / working-renter tenant base. Strengths: crime A+, housing A+, health & safety A+; Watch: amenities F, commute D-.
- Naugatuck School District (suburban): math 32% / reading 43% proficiency, ranked #105 of 153 in CT (top 69%) — families likely to look elsewhere, expect single-tenant / working-renter base with shorter leases.
- Zoned schools: Andrew Avenue School (math 47% / reading 47%, grade D-, #256 of 553 statewide, top 48%, 239 students, 75% FRL); Naugatuck High School (math 20% / reading 44%, grade F, #129 of 194 statewide, top 69%, 1,288 students, 52% FRL) — zoned schools average 64% FRL vs 35% district-wide (29 pts higher); higher-poverty schools than district average — tighter screening recommended.
- Market conditions: Rents rising fast (+6.2%/yr); 113 active listings in the ZIP; solid renter incomes; 502 units permitted in Naugatuck Valley Planning Region in 2024 (171 in 5+ unit buildings).
- This rent runs 33% of the median local income ($96k/yr) — at the standard rent-burdened threshold; future hikes will face affordability resistance.
Forward outlook
- Local home prices are declining (-3.0%/yr); year-one equity from $2k of loan paydown is wiped out by about $9k of value loss. Plan a longer hold.
Negotiation context
- Only 3 days on market — expect competitive offers; lowballing is unlikely to land.
- Current owner paid $150k; list at $300k implies a 100% gain — meaningful room to come down on a strong offer.
Risks & watch-outs
- Watch-outs: built in 1938 — expect roof / HVAC / electrical / plumbing capex.
- Climate carrying-cost: major flood risk; major wind risk, 27% chance of damaging wind over 30y; extreme-heat days projected 7→16/yr by 2055 (HVAC capex compounding) — expect insurance premiums to compound above CPI over the hold.
Questions for the listing agent
- Built in 1938 — when were the roof, HVAC, electrical panel, plumbing, and water heater last replaced?
- Is there a deadline driving the sale (1031 exchange, divorce, estate, relocation)? That informs how much negotiation room exists.
- The area grade is low — what's the realistic commute time and amenity access for the typical tenant pool here? Any planned neighborhood developments (good or bad) we should know about?
- What's the average days-on-market for RENTAL listings here right now (not sales)? A rising rental-DOM trend means longer vacancies and softer asking-rent achievability than the comps imply.
- What's the recent tenant-quality profile in this submarket — average credit score on applications, eviction rate, late-payment / NSF rate, and stable-employment percentage? A property-management company in the area should have these aggregated.
- How much new for-sale + rental construction is in the pipeline within 1–3 miles? Heavy new supply typically softens prices + rents 12–24 months out; constrained supply supports both.
Investment metrics
- 1% rule
- 0.89% ✗
- Cap rate
- 6.50%
- Cash-on-cash
- 0.73%
- DSCR
- 1.03
- GRM
- 9.3
CMA / ARV
- ARV (on-the-fly)
- $340,224
- Comps found
- 9
Show comp detail 9 sales within ~0.75 mi
| Address | Dist | Beds/Ba | Sqft | Sold | Price | $/sf | Match |
|---|---|---|---|---|---|---|---|
| 239 Lewis St | 0.39mi | 4/2.0 (-1) | 1,768 (-0%) | 6mo | $415,000 | $235 | 71 |
| 37 Goodyear Ave | 0.47mi | 6/2.5 (+1) | 1,785 (+1%) | 4mo | $340,000 | $190 | 66 |
| 71 Cliff St | 0.56mi | 4/2.0 (-1) | 1,719 (-3%) | 1mo | $375,000 | $218 | 63 |
| 30 Pond St | 0.51mi | 5/2.0 | 1,815 (+2%) | 12mo | $180,000 | $99 | 62 |
| 55 Moore Ave | 0.53mi | 4/1.5 (-1) | 1,924 (+9%) | 0mo | $370,000 | $192 | 54 |
| 20 George St | 0.62mi | 4/2.0 (-1) | 1,649 (-7%) | 1mo | $360,000 | $218 | 54 |
| 15 Frederick St | 0.67mi | 4/1.5 (-1) | 1,830 (+3%) | 16mo | $355,000 | $194 | 43 |
| 177 Cliff St | 0.69mi | 6/1.5 (+1) | 1,900 (+7%) | 7mo | $298,500 | $157 | 43 |
| 35 Fairchild St | 0.47mi | 4/2.5 (-1) | 2,028 (+14%) | 5mo | $382,000 | $188 | 42 |
Match score weights: distance 35% · size 25% · config 20% · recency 20%. Top-matched comps best support the ARV.
Projected returns pro-forma
-3.0% appreciation · 6.23% rent growth · sell at horizon
- IRR
- -11.6%
- Equity multiple
- 0.57×
- Total profit
- $-36,325
- Equity at exit
- $44,716
- IRR
- 1.8%
- Equity multiple
- 1.14×
- Total profit
- $12,060
- Equity at exit
- $25,930
Cash invested: $83,972 (down + closing). Projections, not guarantees.
Landlord ↔ Tenant lean methodology
- Overall (STATE)
- 27 Tenant-Leaning
- State Connecticut
- 27 Tenant-Leaning · D+7
- County
- — inherits STATE
- City
- — inherits STATE
ZIP-level market 06770
- Home prices YoY
- -33.3%
- Rents YoY
- 6.2%
- Active inventory
- 113
- Price-to-rent
- 9.3×
Monthly cashflow live
- Estimated rent
- $2,674 medium interval (Pro) →
- Mortgage (P&I)
- −$1,573
- Tax from tax record
- −$364 /mo · $4,367/yr
- Insurance
- −$125
- HOA
- −$0
- Vacancy / Maint / Mgmt
- −$562
- Net cashflow
- $51
Break-even live
Sensitivity live
| Price | -10% $221 | -5% $136 | +0% $51 | +5% $-34 | +10% $-118 |
|---|---|---|---|---|---|
| Rent | -10% $-160 | -5% $-54 | +0% $51 | +5% $157 | +10% $263 |
| Rate | -1.0pp $202 | -0.5pp $128 | base $51 | +0.5pp $-26 | +1.0pp $-105 |
UW: 25.0% down · 7.5% · 30yr · 1.5% tax · 5.0% vac · 8.0% maint · 8.0% mgmt
Financing live
Cash to close
- Down payment
- $74,975
- Closing costs
- $8,997
- Reserves months
- —
- Total cash needed
- —
Loan-product check · same deal, 3 products live
Conventional
25% down · 7.5% · 30yr
- Down + closing
- —
- Monthly P&I
- —
- Monthly cashflow
- —
- DSCR
- —
- Eligible?
- —
Personal DTI + credit; lowest rate.
DSCR
20% down · 8.5% · 30yr
- Down + closing
- —
- Monthly P&I
- —
- Monthly cashflow
- —
- DSCR
- —
- Eligible?
- —
No personal income docs; deal must DSCR.
Hard money
10% down · 12.0% · 12mo
- Down + closing
- —
- Monthly P&I
- —
- Monthly cashflow
- —
- DSCR
- —
- Eligible?
- —
Short-term bridge; refi at stabilization.
Listing history 3 events
-
2026-06-22days on market $299,900 Active 3 DOM
-
2026-06-18remarks 699-char remark
-
2026-06-18$299,900 Active 1 DOM
ⓘ Source: listings_history table (triggers on properties + properties_extension) + one-shot
backfill from property_details.listing_events for pre-trigger history.
Tax reassessment forecast CT · Partial reset (capped growth)
- Current annual tax
- $4,367 · $364/mo
- Projected year-2 tax
- $5,392 · $449/mo
- Expected delta
- +$1,025/yr (+$85/mo · 23.5%)
ⓘ Screening estimate from a state-policy table — verify with the county assessor before closing.
Climate risk First Street
- Flood 6/10 Major FEMA zone X (unshaded) · 70% chance over 30 yrs
- Wildfire 4/10 Moderate
- Heat 5/10 Major 7 d/yr ≥97°F today · 16 d/yr by 30 yrs out
- Wind 6/10 Major 27% chance of damaging wind over 30 yrs
- Air quality 3/10 Moderate 2 unhealthy d/yr today · 4 by 30 yrs out
Nearby sold comps map
Loading sold comps map…
Walkable amenities ~0.75 mi
Loading nearby amenities…
Taxation est. · year 1
- Rental income
- $32,094
- − Mortgage interest
- −$16,799
- − Property taxes
- −$4,367
- − Insurance
- −$1,500
- − Repairs & maintenance
- −$2,568
- − Management
- −$2,568
- − Depreciation
- −$8,724
- Taxable loss
- −$4,431
- Est. tax savings @ 24.0%
- +$1,063
- After-tax cash flow
- $1,679/yr
For passive investors: Depreciation is non-cash, so a rental often shows a tax loss while cash-flowing — sheltering income. Rental losses are passive: they offset passive income freely, and up to $25,000/yr can offset ordinary (W-2) income if you actively participate and your MAGI is under $100k (phasing out to $0 by $150k); unused losses carry forward. On sale, claimed depreciation is recaptured at up to 25%, and gains may owe capital-gains tax (a 1031 exchange can defer both). Figures are a year-1 estimate at your 24.0% rate — not tax advice; consult a CPA.
Schools (NCES district)
- District
- Naugatuck School District
- NCES district ID
- 0902640
- Math proficiency
- 32% ▼ -13.00%
- Reading proficiency
- 43% ▼ -11.00%
- Median HH income
- $61,060
- Composite
- 33.44/100
- National rank
- #5463
- State rank
- #105 of 153 in CT
Livability — Naugatuck
- Score
- 77/100
- State rank
- #42
- US rank
- #2997
Category grades
Schools grade is shown separately in the Schools card above.
Census & demographics
- Census place
- Naugatuck, CT
- County
- New Haven County · 688,236 people
- City population
- 31,823
- Metro
- New Haven-Milford, CT
- Population (ZIP)
- 31,823
- Household income
- $96,208
- Rent vs Own
- Severe rent burden
- 788.0
Population outlook (Naugatuck Valley County) Hauer SSP2
- By 2040
- 496,846
Race, ethnicity, and origin ACS 2023
- Neighborhood character
- Diverse neighborhood (Simpson 0.59)
- Race & ethnicity
- White 61% Hispanic / Latino 17% Two or more races 12% Black 11% Asian 4%
- Hispanic origin (detail)
- Puerto Rican 10% Dominican 1%
- Common ancestry
- Romanian 7% Russian 6% Lithuanian 4%
- Foreign-born
- 17% · Canada, Jamaica, China
- Languages at home
- 77% English-only · Spanish 10% Other Indo-European 7% Other Asian/Pacific 2%
Political lean MEDSL · Naugatuck Valley
- 2024 margin
- Lean R (+7.4) · D 45.6% · R 53.0% · Other 1.4%
- All cycles
- 2024: R+7.4
Not yet ingested
- Civics
- —
Market trends
- HPI YoY
- ▼ -108.73%
- Current HPI
- 217.6177
- Rent YoY
- ▲ 6.23%
- Metro
- New Haven-Milford, CT
- State GDP YoY
- ▲ 1.06%
- F500 in state
- 38
Industry mix (Fortune 500 HQ in CT)
| Industry | F500 HQs | Revenue |
|---|---|---|
| Industrial Machinery | 4 | $38B |
|
||
| Insurance | 3 | $71B |
|
||
| Financial Services | 2 | $25B |
|
||
| Transportation / Logistics | 2 | $18B |
|
||
| Healthcare | 1 | $247B |
|
||
| Telecommunications | 1 | $55B |
|
||
Price history
+99.9% since first listed2 events — show timeline
- 2026-06-18 Listed $299,900 Smart MLS
- 2002-03-25 Sold (Public Records) $150,000 Public Records
Property tax history
+0.9%/yrLatest (2022): $4,367 · +0.0% YoY. Source: county tax records.
Cash-flow waterfall
monthlySold comps — $/sqft
last 12 mo · ≤1 miLoading sold comps…