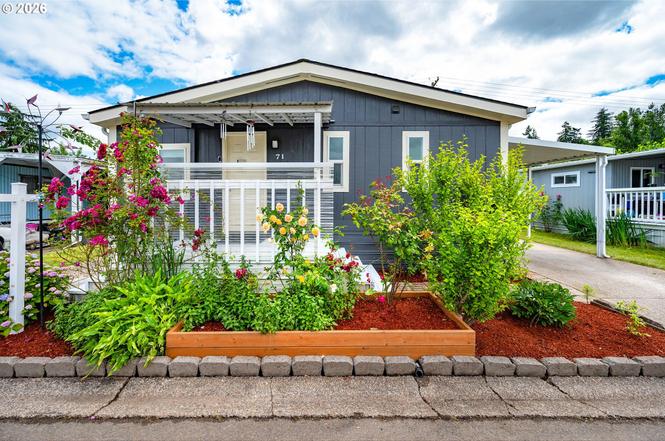
5335 Daisy St #71 · Springfield, OR
Flood risk 1/10 · Minimal
- FEMA flood zone
- X (unshaded)
- Chance of flooding over 30 yrs
- 0.0%
- Est. flood insurance / yr
- $507 – $1,088
Fire risk 5/10 · Moderate
- Est. fire insurance / yr
- $498 – $926
Heat risk 4/10 · Minor
- Hot days now (above 91°F)
- 7 days/yr
- Hot days in 30 yrs
- 15 days/yr
Wind risk 1/10 · Minimal
- Chance of severe wind over 30 yrs
- —
Air-quality risk 10/10 · Severe
- Unhealthy air days now
- 13 days/yr
- Unhealthy air days in 30 yrs
- 15 days/yr
Risk factors via First Street. Map © Google.
Why this score? — see what drove the B+ grade
The composite is a weighted blend of 9 inputs, each scored 0–100. Each bar is that input's sub-score; the figure is the points it added to the 100-point composite (weight × sub-score).
- Cash flow +30.0/30.0
- ARV discount +15.0/15.0
- DSCR +10.0/10.0
- 1% rule +8.2/10.0
- Livability +4.2/5.0
- Rent growth +3.3/5.0
- Condition / age +2.5/5.0
- Schools +2.4/10.0
- Appreciation +0.0/10.0
$165,000
🖨 Deal sheet (PDF) 📄 Offer letter ✓ Due diligence
Listing remarks
Welcome to Granada Estates, an all-ages community where this beautifully updated 4-bedroom, 2-bath home offers space, comfort, and flexibility for the way people live today. Step inside to a bright open floor plan with vaulted ceilings in the living room and main bedroom, giving the home an airy and inviting feel. The fully updated kitchen and bathrooms bring a fresh, polished finish, making this home truly move-in ready. The four-bedroom layout gives you options. There is room for family, guests, a home office, creative space, or extended living. Whether you need privacy, flexibility, or just more breathing room, this home delivers practical space without feeling crowded. Outside, the prop
Key facts
- Tool shed
- Established garden
- Updated bathrooms
Tags
Property features AI
Finance
- Other: Property is resale; Main level living area reported as 1,378 (unit in park)
- Financial info: Lot rent (monthly)
- HOA & community: Community amenities include basketball court, party room, pool, and recreation facilities; Land lease in effect (land lease expires November 30, 2027); Lot rent charged monthly
Exterior
- Parking: Covered parking; Driveway; Carport
- Utilities: Electric fuel; Community water; Community sewer; Cable internet available
- Home design: Manufactured home in a park; Residential property; Single‑story (main living on one level); Built in 1989; No notable view; Skirting foundation
- Construction: Composition roof; T‑111 siding; Frame construction for outbuilding; Skirting foundation; Year built: 1989
- Exterior features: Patio; Tool shed; Workshop (12 x 12, frame construction with T‑111 siding, fiberglass roof); Yard; Level lot
Interior
- Kitchen: Dishwasher; Free‑standing refrigerator; Pantry
- Bedrooms: Primary bedroom (main level, ~15 x 13); Second bedroom (main level, ~12 x 8); Third bedroom (main level, ~12 x 7); Fourth bedroom (main level, ~12 x 7)
- Bathrooms: 2 full bathrooms (both on the main level)
- Heating & cooling: Forced air heating; Wall cooling unit(s)
- Interior features: Ceiling fan(s); Laundry area; Vinyl window frames; Basement (other)
- Laundry & utility: Laundry area; Electric hot water
Neighborhood map
What this means for you Summary
Snapshot
- This is a 4-bed/2.0-bath manufactured listed at $165k.
Deal economics
- At list price, monthly cash flow is $711 ($9k/yr) — positive.
- The deal already cash-flows at list — no discount required.
- Meets the 1% rule at list price ($2k rent vs $165k).
- Cap rate 11.5% vs local median 3.0% in Springfield — top-decile yield for the area; either an underpriced asset or a hidden risk that comps aren't pricing in. Stress-test before assuming the spread holds.
Location & tenants
- Location reads 83/100 on livability (#40 in OR, #934 nationally) — a professional / high-income tenant draw. Strengths: amenities A+, commute A+, housing A+; Watch: crime D+, employment D+.
- Springfield SD 19 (suburban): math 19% / reading 38% proficiency, ranked #48 of 58 in OR (top 83%) — low school quality limits family demand, transient renter base, plan for 1-2y turnover.
- Zoned schools: Mt Vernon Elementary School (math 5% / reading 34%, grade F, #366 of 412 statewide, top 91%, 412 students, 63% FRL); Agnes Stewart Middle School (math 16% / reading 36%, grade F, #101 of 128 statewide, top 80%, 513 students, 63% FRL); Thurston High School (math 22% / reading 52%, grade F, #85 of 143 statewide, top 61%, 1,277 students, 65% FRL).
- Market conditions: Rents rising (+3.4%/yr); 270 active listings in the ZIP; 10 comparable units currently listed for rent nearby; rentals at typical pace (median 15d on market — plan ~3-4 weeks tenant-placement turnaround); solid renter incomes; 1,808 units permitted in Lane County in 2024 (972 in 5+ unit buildings).
- This rent runs 33% of the median local income ($80k/yr) — at the standard rent-burdened threshold; future hikes will face affordability resistance.
Forward outlook
- Local home prices are declining (-3.0%/yr); year-one equity from $1k of loan paydown is wiped out by about $5k of value loss. Plan a longer hold.
- Lane County population projected at +15% by 2050 — long-run rental-demand tailwind backs the buy-and-hold thesis.
- At projected returns (-3.0% appreciation + 3.4% rent growth), your $46k cash investment doubles in ~7 years — after that, you're playing with house money.
Negotiation context
- Only 10 days on market — expect competitive offers; lowballing is unlikely to land.
Risks & watch-outs
- Climate carrying-cost: moderate wildfire risk — expect insurance premiums to compound above CPI over the hold.
Questions for the listing agent
- Is there a deadline driving the sale (1031 exchange, divorce, estate, relocation)? That informs how much negotiation room exists.
- Schools are D-rated, which usually means shorter tenancies and higher turnover. Who's the typical renter profile here, and what's been the actual vacancy rate?
- Crime grade is D in this area — have there been break-ins, vandalism, or insurance claims at this property in the last 3 years? What carrier currently insures it and at what premium?
- What's the average days-on-market for RENTAL listings here right now (not sales)? A rising rental-DOM trend means longer vacancies and softer asking-rent achievability than the comps imply.
- What's the recent tenant-quality profile in this submarket — average credit score on applications, eviction rate, late-payment / NSF rate, and stable-employment percentage? A property-management company in the area should have these aggregated.
- How much new for-sale + rental construction is in the pipeline within 1–3 miles? Heavy new supply typically softens prices + rents 12–24 months out; constrained supply supports both.
Investment metrics
- 1% rule
- 1.32% ✓
- Cap rate
- 11.46%
- Cash-on-cash
- 18.46%
- DSCR
- 1.82
- GRM
- 6.3
CMA / ARV
- ARV (on-the-fly)
- $314,184
- Comps found
- 12
Show comp detail 12 sales within ~0.75 mi
| Address | Dist | Beds/Ba | Sqft | Sold | Price | $/sf | Match |
|---|---|---|---|---|---|---|---|
| 5254 Forsythia Dr | 0.08mi | 3/2.0 (-1) | 1,440 (+4%) | 3mo | $286,000 | $199 | 81 |
| 658 S 57th St #81 | 0.28mi | 3/2.0 (-1) | 1,344 (-2%) | 4mo | $57,000 | $42 | 74 |
| 5256 Daisy St | 0.16mi | 3/2.0 (-1) | 1,344 (-2%) | 15mo | $353,000 | $263 | 71 |
| 5660 Daisy St #34 | 0.35mi | 3/2.0 (-1) | 1,394 (+1%) | 10mo | $337,147 | $242 | 68 |
| 5660 Daisy St #69 | 0.35mi | 3/2.0 (-1) | 1,296 (-6%) | 4mo | $295,000 | $228 | 66 |
| 205 S 54th St #37 | 0.28mi | 3/2.0 (-1) | 1,488 (+8%) | 7mo | $57,500 | $39 | 63 |
| 5660 Daisy St #4 | 0.35mi | 3/2.0 (-1) | 1,325 (-4%) | 14mo | $299,000 | $226 | 60 |
| 5335 S Main St #155 | 0.28mi | 3/2.0 (-1) | 1,188 (-14%) | 8mo | $54,000 | $45 | 52 |
| 5335 Main St #214 | 0.28mi | 3/2.0 (-1) | 1,188 (-14%) | 8mo | $74,500 | $63 | 52 |
| 5089 D St | 0.72mi | 3/2.0 (-1) | 1,456 (+6%) | 2mo | $349,000 | $240 | 50 |
| 1281 S 57th Pl | 0.63mi | 3/2.0 (-1) | 1,512 (+10%) | 0mo | $376,100 | $249 | 50 |
| 4675 Union Ter | 0.75mi | 3/2.0 (-1) | 1,458 (+6%) | 12mo | $386,000 | $265 | 40 |
Match score weights: distance 35% · size 25% · config 20% · recency 20%. Top-matched comps best support the ARV.
Projected returns pro-forma
-3.0% appreciation · 3.38% rent growth · sell at horizon
- IRR
- 10.5%
- Equity multiple
- 1.42×
- Total profit
- $19,319
- Equity at exit
- $24,602
- IRR
- 19.9%
- Equity multiple
- 2.70×
- Total profit
- $78,364
- Equity at exit
- $14,266
Cash invested: $46,200 (down + closing). Projections, not guarantees.
Landlord ↔ Tenant lean methodology
- Overall (STATE)
- 28 Tenant-Leaning
- State Oregon
- 28 Tenant-Leaning · D+6
- County
- — inherits STATE
- City
- — inherits STATE
ZIP-level market 97478
- Rents YoY
- 3.4%
- Active inventory
- 270
- Price-to-rent
- 6.3×
Monthly cashflow live
- Estimated rent
- $2,173 high interval (Pro) →
- Mortgage (P&I)
- −$865
- Tax from tax record
- −$72 /mo · $859/yr
- Insurance
- −$69
- HOA
- −$0
- Vacancy / Maint / Mgmt
- −$456
- Net cashflow
- $711
Break-even live
Sensitivity live
| Price | -10% $804 | -5% $758 | +0% $711 | +5% $664 | +10% $617 |
|---|---|---|---|---|---|
| Rent | -10% $539 | -5% $625 | +0% $711 | +5% $797 | +10% $882 |
| Rate | -1.0pp $794 | -0.5pp $753 | base $711 | +0.5pp $668 | +1.0pp $625 |
UW: 25.0% down · 7.5% · 30yr · 1.5% tax · 5.0% vac · 8.0% maint · 8.0% mgmt
Financing live
Cash to close
- Down payment
- $41,250
- Closing costs
- $4,950
- Reserves months
- —
- Total cash needed
- —
Loan-product check · same deal, 3 products live
Conventional
25% down · 7.5% · 30yr
- Down + closing
- —
- Monthly P&I
- —
- Monthly cashflow
- —
- DSCR
- —
- Eligible?
- —
Personal DTI + credit; lowest rate.
DSCR
20% down · 8.5% · 30yr
- Down + closing
- —
- Monthly P&I
- —
- Monthly cashflow
- —
- DSCR
- —
- Eligible?
- —
No personal income docs; deal must DSCR.
Hard money
10% down · 12.0% · 12mo
- Down + closing
- —
- Monthly P&I
- —
- Monthly cashflow
- —
- DSCR
- —
- Eligible?
- —
Short-term bridge; refi at stabilization.
Rent comps 10 comps
| Address | Beds | Baths | Sqft | Rent | $/sqft | DOM | Units | Dist |
|---|---|---|---|---|---|---|---|---|
| 5040 E St #12 Springfield, OR | 3.0 | 1.0 | 912 | $1,895 | $2.08 | 45d | 1 | 0.87mi |
| 5040 E St #21 Springfield, OR | 3.0 | 1.0 | 1000 | $1,795 | $1.79 | 15d | 1 | 0.87mi |
| 5040 E St #1 Springfield, OR | 3.0 | 1.0 | 1000 | $1,895 | $1.90 | 15d | 1 | 0.87mi |
| 1012 53rd St Springfield, OR | 3.0 | 2.0 | 1249 | $2,195 | $1.76 | 15d | 1 | 1.08mi |
| 1152 S 43rd Pl Springfield, OR | 3.0 | 2.5 | 1539 | $2,595 | $1.69 | 15d | 1 | 1.10mi |
| 1075 56th Pl Springfield, OR | 3.0 | 1.0 | 904 | $1,795 | $1.99 | 45d | 1 | 1.12mi |
| 339 S 42nd St Unit 317 Springfield, OR | 3.0 | 2.5 | 1444 | $1,895 | $1.31 | 15d | 1 | 1.23mi |
| 4173 Glacier View Dr Springfield, OR | 3.0 | 2.5 | 1250 | $2,175 | $1.74 | 15d | 1 | 1.25mi |
| 617 S 41st Ct Unit 610 Springfield, OR | 3.0 | 2.5 | 1500 | $2,050 | $1.37 | 15d | 1 | 1.34mi |
| 617 S 41st Ct Unit 606 Springfield, OR | 3.0 | 2.5 | 1500 | $2,100 | $1.40 | 15d | 1 | 1.34mi |
Listing history 7 events
-
2026-06-22days on market $165,000 Active 10 DOM
-
2026-06-18days on market $165,000 Active 7 DOM
-
2026-06-17days on market $165,000 Active 6 DOM
-
2026-06-16days on market $165,000 Active 5 DOM
-
2026-06-15days on market $165,000 Active 4 DOM
-
2026-06-14remarks 699-char remark
-
2026-06-14$165,000 Active 2 DOM
ⓘ Source: listings_history table (triggers on properties + properties_extension) + one-shot
backfill from property_details.listing_events for pre-trigger history.
Tax reassessment forecast OR · Resets to sale price
- Current annual tax
- $859 · $72/mo
- Projected year-2 tax
- $1,600 · $133/mo
- Expected delta
- +$742/yr (+$62/mo · 86.4%)
ⓘ Screening estimate from a state-policy table — verify with the county assessor before closing.
Climate risk First Street
- Flood 1/10 Low FEMA zone X (unshaded) · 0% chance over 30 yrs
- Wildfire 5/10 Major
- Heat 4/10 Moderate 7 d/yr ≥91°F today · 15 d/yr by 30 yrs out
- Wind 1/10 Low
- Air quality 10/10 Extreme 13 unhealthy d/yr today · 15 by 30 yrs out
Nearby sold comps map
Loading sold comps map…
Walkable amenities ~0.75 mi
Loading nearby amenities…
Taxation est. · year 1
- Rental income
- $26,072
- − Mortgage interest
- −$9,243
- − Property taxes
- −$859
- − Insurance
- −$825
- − Repairs & maintenance
- −$2,086
- − Management
- −$2,086
- − Depreciation
- −$4,800
- Taxable income
- $6,174
- Est. tax owed @ 24.0%
- −$1,482
- After-tax cash flow
- $7,048/yr
For passive investors: Depreciation is non-cash, so a rental often shows a tax loss while cash-flowing — sheltering income. Rental losses are passive: they offset passive income freely, and up to $25,000/yr can offset ordinary (W-2) income if you actively participate and your MAGI is under $100k (phasing out to $0 by $150k); unused losses carry forward. On sale, claimed depreciation is recaptured at up to 25%, and gains may owe capital-gains tax (a 1031 exchange can defer both). Figures are a year-1 estimate at your 24.0% rate — not tax advice; consult a CPA.
Schools (NCES district)
- District
- Springfield SD 19
- NCES district ID
- 4111670
- Math proficiency
- 19% ▼ -13.00%
- Reading proficiency
- 38% ▼ -10.00%
- Median HH income
- $42,236
- Composite
- 24.14/100
- National rank
- #7746
- State rank
- #48 of 58 in OR
Livability — Springfield
- Score
- 83/100
- State rank
- #40
- US rank
- #934
Category grades
Schools grade is shown separately in the Schools card above.
Census & demographics
- Census place
- Springfield, OR
- County
- Lane County · 310,476 people
- City population
- 76,907
- Metro
- Eugene-Springfield, OR
- Population (ZIP)
- 39,373
- Household income
- $80,086
- Rent vs Own
- Severe rent burden
- 904.0
Population outlook (Lane County) Hauer SSP2
- Today (2025)
- 391,933 people
- By 2030
- 405,860 · +3.6%
- By 2040
- 429,386 · +9.6%
- By 2050
- 452,016 · +15.3%
- By 2075
- 508,825 · +29.8%
- By 2100
- 531,208 · +35.5%
Race, ethnicity, and origin ACS 2023
- Neighborhood character
- Predominantly White (79%)
- Race & ethnicity
- White 79% Hispanic / Latino 12% Two or more races 9% Native American 1% Asian 1%
- Hispanic origin (detail)
- Mexican 9%
- Common ancestry
- Slovak 4% Lithuanian 3% Portuguese 3%
- Foreign-born
- 4% · Canada
- Languages at home
- 94% English-only · Spanish 5% Tagalog/Filipino 1%
Political lean MEDSL · Lane
- 2024 margin
- Strong D (+23.1) · D 60.0% · R 36.9% · Other 3.1%
- 2008→2024 swing
- -4.3pp toward R · 2008: 27.4pp · 2024: 23.1pp
- All cycles
- 2024: D+23.1 2020: D+24.3 2016: D+18.9 2012: D+23.4 2008: D+27.4
Not yet ingested
- Civics
- —
Market trends
- HPI YoY
- ▼ -395.83%
- Current HPI
- 302.9203
- Rent YoY
- ▲ 3.38%
- Metro
- Eugene-Springfield, OR
- State GDP YoY
- ▲ 2.05%
- F500 in state
- 2
Industry mix (Fortune 500 HQ in OR)
| Industry | F500 HQs | Revenue |
|---|---|---|
| Consumer Goods | 1 | $51B |
|
||
Price history
1 event — show timeline
- 2026-06-11 Listed $165,000 RMLS
Property tax history
+20.6%/yrLatest (2025): $859 · +1.6% YoY. Source: county tax records.
Cash-flow waterfall
monthlySold comps — $/sqft
last 12 mo · ≤1 miLoading sold comps…