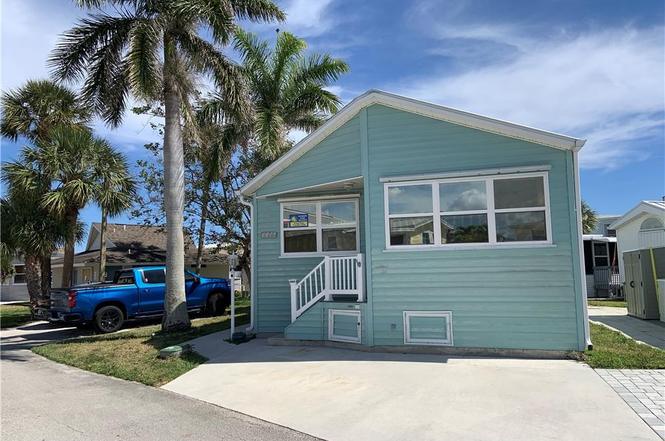
1156 Nettles Blvd · Hutchinson Island South, FL
Flood risk 9/10 · Severe
- FEMA flood zone
- X (shaded)
- Chance of flooding over 30 yrs
- 0.99%
- Est. flood insurance / yr
- $507 – $1,088
Fire risk 1/10 · Minimal
- Est. fire insurance / yr
- $947 – $1,759
Heat risk 10/10 · Severe
- Hot days now (above 106°F)
- 7 days/yr
- Hot days in 30 yrs
- 23 days/yr
Wind risk 10/10 · Severe
- Chance of severe wind over 30 yrs
- 99.0%
Air-quality risk 2/10 · Minimal
- Unhealthy air days now
- 1 days/yr
- Unhealthy air days in 30 yrs
- 2 days/yr
Risk factors via First Street. Map © Google.
Why this score? — see what drove the D- grade
The composite is a weighted blend of 9 inputs, each scored 0–100. Each bar is that input's sub-score; the figure is the points it added to the 100-point composite (weight × sub-score).
- Cash flow +9.7/30.0
- ARV discount +7.5/15.0
- 1% rule +4.7/10.0
- Schools +3.7/10.0
- Livability +3.1/5.0
- DSCR +2.8/10.0
- Rent growth +2.8/5.0
- Condition / age +2.5/5.0
- Appreciation +0.0/10.0
$379,900
🖨 Deal sheet (PDF) 📄 Offer letter ✓ Due diligence
Listing remarks
COASTAL BEACH HOME Custom Built --- located next to Green Space Area & #4 Bath House a highly DESIREABLE LOCATION. Vinyl Siding Exterior, NEW METAL ROOF, 2-ZONE A/C, and Storm Shutters. The 1,348 Sq Ft HOME has 2-Bed /2 1/2-Bath PLUS A DEN/OFFICE. The Great Room Floor Plan exhibits many windows for natural light plus Wood-Look Laminate Flooring. DESTINATION Resort Community has LOADS of AMENITIES: Clubhouse Cafe, Exercise room, Tennis courts, Pickle ball, Basketball, Shuffle board, Horse shoes, Boat Ramp, Fishing Pier, FUN 35+ NETTLES Clubs and MORE>>> Private OCEAN BEACH access. .. RELAX at the Indian River-side pool or our Atlantic Ocean-side pool.
Key facts
- Metal roof
- Natural light
- Storm shutters
Tags
Property features AI
Finance
- Other: Community amenities include basketball court, beach, boat facilities, bocce court, clubhouse, dog park, fitness center, fishing, library, pier, playground, park, pickleball, on-site property manager, pool, restaurant, shuffleboard, street lights, sidewalks, tennis courts, and trails/paths; Community pool and spa; Cabana as an additional structure
- Financial info: Pets allowed with restrictions and limits
- HOA & community: Homeowners association present; Association fee includes management, common areas, cable TV, grounds maintenance, phone, recreation facilities, reserve fund, sewer, security, trash, and water; Association fee applies
Exterior
- Parking: Driveway
- Security: Closed-circuit cameras; Gated community with guard; On-site security guard
- Utilities: Electricity available and connected; Water available; Sewer available; Trash collection; Cable available; Phone available
- Home design: 2 stories; Under construction; Metal roof; Frame construction with vinyl siding; Interior lot; Facing a private, paved road
- Construction: Metal roof; Frame construction; Vinyl siding
- Exterior features: Storm/security shutters; Cabana; Beach access; Boat ramp/lift access
Interior
- Kitchen: Dishwasher; Electric range; Disposal; Icemaker; Microwave; Refrigerator
- Bedrooms: Space for 3 bedrooms
- Flooring: Carpet; Laminate
- Bathrooms: 2 full bathrooms; 1 half bathroom
- Heating & cooling: Central heating (electric); Central air conditioning (electric)
- Interior features: Kitchen island; Combined living and dining area; Unfurnished
- Laundry & utility: Washer; Dryer; Water heater
Neighborhood map
What this means for you Summary
Snapshot
- This is a 2-bed/2.0-bath condo listed at $380k.
Deal economics
- At list price, monthly cash flow is $-314 ($-4k/yr) — negative.
- To cash-flow at today's rent, offer at most $324k (14.6% below list).
- To meet the 1% rule (rent ≥ 1% of price), the offer needs to be $367k (3.4% below list).
- Recommended offer: $324k (14.6% below list) — sets the bar for cash-flow.
- Cap rate 5.5% vs local median 2.0% in Hutchinson Island South — top-decile yield for the area; either an underpriced asset or a hidden risk that comps aren't pricing in. Stress-test before assuming the spread holds.
Location & tenants
- Location reads 61/100 on livability (#783 in FL) — a middle-class / working-renter tenant base. Strengths: crime A+, housing B; Watch: cost of living C-, amenities F, commute F.
- St. Lucie (urban): math 40% / reading 48% proficiency, ranked #51 of 73 in FL (top 70%) — families likely to look elsewhere, expect single-tenant / working-renter base with shorter leases.
- Zoned schools: Manatee Academy K-8 (math 53% / reading 51%, grade C-, #990 of 2,144 statewide, top 48%, 1,664 students, 65% FRL); Southern Oaks Middle School (math 39% / reading 43%, grade F, #353 of 571 statewide, top 63%, 894 students, 76% FRL); Fort Pierce Central High School (math 15% / reading 45%, grade F, #441 of 667 statewide, top 67%, 3,091 students, 62% FRL).
- Market conditions: Rents rising (+1.0%/yr); 538 active listings in the ZIP; 40 comparable units currently listed for rent nearby; rentals at typical pace (median 25d on market — plan ~3-4 weeks tenant-placement turnaround); 4,868 units permitted in St. Lucie County in 2024 (268 in 5+ unit buildings).
- At $3,668/mo this rent would consume 63% of the median local household income ($70k/yr) (locally 946% of renters already pay >50% of income on rent) — very limited rent-growth headroom before tenants either downsize or default.
Forward outlook
- Local home prices are declining (-3.0%/yr); year-one equity from $3k of loan paydown is wiped out by about $11k of value loss. Plan a longer hold.
- St. Lucie County population projected at +20% by 2050 — long-run rental-demand tailwind backs the buy-and-hold thesis.
Negotiation context
- It's been on market 416 days — a 12% lower offer ($334k) is reasonable based on typical stale-listing flexibility.
- 4 sale attempts since 2y ago; this cycle's ask has dropped $40k (10%) from the opening price — seller is motivated, your offer sets the floor, not the list.
Risks & watch-outs
- Watch-outs: flood insurance adds $66/mo.
- Climate carrying-cost: severe flood risk; severe wind risk, 99% chance of damaging wind over 30y; extreme-heat days projected 7→23/yr by 2055 (HVAC capex compounding) — expect insurance premiums to compound above CPI over the hold.
Questions for the listing agent
- What do current leases actually rent for vs. the listed asking? Can we see a recent rent roll and the last 12 months of T-12 income?
- It's been on market 416 days. Have you received any prior offers? Is the seller open to a 15% concession, seller financing, or rate buy-down credit?
- What's the actual annual flood-insurance premium (NFIP or private), and is the property in a SFHA with mandatory coverage?
- What does the HOA fee cover, when was the last increase, and are there any pending special assessments or reserve-fund shortfalls?
- Any open or pending special assessments — roof, HVAC, plumbing, elevator, façade? What's the per-unit balance and payoff schedule, and is the seller paying it off at close or rolling it to the buyer?
- Why hasn't it sold? Are there any deal-killer items the seller is aware of (foundation, flood, title, zoning, code violations)?
- Is there a deadline driving the sale (1031 exchange, divorce, estate, relocation)? That informs how much negotiation room exists.
- Schools are D-rated, which usually means shorter tenancies and higher turnover. Who's the typical renter profile here, and what's been the actual vacancy rate?
- The area grade is low — what's the realistic commute time and amenity access for the typical tenant pool here? Any planned neighborhood developments (good or bad) we should know about?
- What's the average days-on-market for RENTAL listings here right now (not sales)? A rising rental-DOM trend means longer vacancies and softer asking-rent achievability than the comps imply.
- What's the recent tenant-quality profile in this submarket — average credit score on applications, eviction rate, late-payment / NSF rate, and stable-employment percentage? A property-management company in the area should have these aggregated.
- How much new apartment / multifamily construction is in the pipeline within 1–3 miles? Heavy new supply (>2% of stock underway) typically softens rents 12–24 months out; light construction supports rent growth.
Investment metrics
- 1% rule
- 0.97% ✗
- Cap rate
- 5.51%
- Cash-on-cash
- -2.79%
- DSCR
- 0.88
- GRM
- 8.6
CMA / ARV
No comps found within radius.
Projected returns pro-forma
-3.0% appreciation · 1.0% rent growth · sell at horizon
- IRR
- -24.9%
- Equity multiple
- 0.17×
- Total profit
- $-88,372
- Equity at exit
- $56,644
- IRR
- -30.0%
- Equity multiple
- -0.22×
- Total profit
- $-129,535
- Equity at exit
- $32,847
Cash invested: $106,372 (down + closing). Projections, not guarantees.
Landlord ↔ Tenant lean methodology
- Overall (STATE)
- 87 Strongly Landlord-Friendly
- State Florida
- 87 Strongly Landlord-Friendly · R+3
- County
- — inherits STATE
- City
- — inherits STATE
ZIP-level market 34957
- Rents YoY
- 1.0%
- Active inventory
- 538
- Price-to-rent
- 8.6×
Monthly cashflow live
- Estimated rent
- $3,668 high interval (Pro) →
- Mortgage (P&I)
- −$1,992
- Tax from tax record
- −$575 /mo · $6,898/yr
- Insurance
- −$158
- Flood insurance flood zone
- −$66 /mo · $798/yr
- HOA
- −$420
- Vacancy / Maint / Mgmt
- −$770
- Net cashflow
- $-314
Break-even live
Sensitivity live
| Price | -10% $-99 | -5% $-206 | +0% $-314 | +5% $-421 | +10% $-529 |
|---|---|---|---|---|---|
| Rent | -10% $-604 | -5% $-459 | +0% $-314 | +5% $-169 | +10% $-24 |
| Rate | -1.0pp $-123 | -0.5pp $-217 | base $-314 | +0.5pp $-412 | +1.0pp $-512 |
UW: 25.0% down · 7.5% · 30yr · 1.5% tax · 5.0% vac · 8.0% maint · 8.0% mgmt
Financing live
Cash to close
- Down payment
- $94,975
- Closing costs
- $11,397
- Reserves months
- —
- Total cash needed
- —
Loan-product check · same deal, 3 products live
Conventional
25% down · 7.5% · 30yr
- Down + closing
- —
- Monthly P&I
- —
- Monthly cashflow
- —
- DSCR
- —
- Eligible?
- —
Personal DTI + credit; lowest rate.
DSCR
20% down · 8.5% · 30yr
- Down + closing
- —
- Monthly P&I
- —
- Monthly cashflow
- —
- DSCR
- —
- Eligible?
- —
No personal income docs; deal must DSCR.
Hard money
10% down · 12.0% · 12mo
- Down + closing
- —
- Monthly P&I
- —
- Monthly cashflow
- —
- DSCR
- —
- Eligible?
- —
Short-term bridge; refi at stabilization.
Rent comps 40 comps
| Address | Beds | Baths | Sqft | Rent | $/sqft | DOM | Units | Dist |
|---|---|---|---|---|---|---|---|---|
| 1333 Nettles Blvd Unit 1546511P Jensen Beach, FL | 2.0 | 2.0 | 1797 | $3,122 | $1.74 | 15d | 1 | 0.36mi |
| 9425 S Ocean Dr #67 Jensen Beach, FL | 2.0 | 1.5 | 1270 | $2,400 | $1.89 | 23d | 1 | 0.88mi |
| 9490 S Ocean Dr #611 Jensen Beach, FL | 2.0 | 2.0 | 1053 | $2,750 | $2.61 | 15d | 1 | 0.90mi |
| 9490 S Ocean Dr #213 Jensen Beach, FL | 2.0 | 2.0 | 1053 | $2,600 | $2.47 | 25d | 1 | 0.90mi |
| 9490 S Ocean Dr Unit 615A Jensen Beach, FL | 2.0 | 2.0 | 1100 | $2,900 | $2.64 | 25d | 1 | 0.90mi |
| 9490 S Ocean Dr Unit 912-A Jensen Beach, FL | 2.0 | 2.0 | 1053 | $3,200 | $3.04 | 25d | 1 | 0.90mi |
| 9900 S Ocean Dr Jensen Beach, FL | 1.0–2.0 | 2.0 | 1009 | $3,500 | $3.47 | 25d | 5 | 0.93mi |
| 9600 S Ocean Dr Jensen Beach, FL | 2.0–4.0 | 2.0–3.5 | 2051 | $2,500 | $1.22 | 25d | 3 | 0.94mi |
| 9960 S Ocean Dr #5 Jensen Beach, FL | 2.0 | 2.0 | 1703 | $5,000 | $2.94 | 25d | 1 | 0.95mi |
| 9940 S Ocean Dr Jensen Beach, FL | 1.0–2.0 | 1.5–2.0 | 1009 | $3,500 | $3.47 | 15d | 5 | 0.95mi |
| 9550 S Ocean Dr #4 Jensen Beach, FL | 2.0 | 2.0 | 1228 | $6,500 | $5.29 | 15d | 1 | 0.95mi |
| 9550 S Ocean Dr #4 Jensen Beach, FL | 2.0 | 2.0 | 1228 | $6,500 | $5.29 | 25d | 1 | 0.95mi |
| 9550 S Ocean Dr #705 Jensen Beach, FL | 3.0 | 2.0 | 1544 | $7,000 | $4.53 | 25d | 1 | 0.95mi |
| 9500 S Ocean Dr #809 Jensen Beach, FL | 2.0 | 2.0 | 1228 | $5,500 | $4.48 | 25d | 1 | 0.96mi |
| 9500 S Ocean Dr Unit 9500PH10 Jensen Beach, FL | 2.0 | 2.0 | 1437 | $6,500 | $4.52 | 25d | 1 | 0.96mi |
| 9500 S Ocean Dr #201 Jensen Beach, FL | 2.0 | 2.0 | 1437 | $5,400 | $3.76 | 25d | 1 | 0.96mi |
| 9500 S Ocean Dr #9 Jensen Beach, FL | 2.0 | 2.0 | 1228 | $4,950 | $4.03 | 25d | 1 | 0.96mi |
| 9500 S Ocean Dr #1308 Jensen Beach, FL | 2.0 | 2.0 | 1224 | $3,100 | $2.53 | 25d | 1 | 0.96mi |
| 9500 S Ocean Dr #10 Jensen Beach, FL | 2.0 | 2.0 | 1437 | $4,000 | $2.78 | 25d | 1 | 0.96mi |
| 9500 S Ocean Dr #1307 Jensen Beach, FL | 2.0 | 2.0 | 1228 | $3,000 | $2.44 | 15d | 1 | 0.96mi |
| 9500 S Ocean Dr #1310 Jensen Beach, FL | 2.0 | 2.0 | 1437 | $6,000 | $4.18 | 25d | 1 | 0.96mi |
| 9950 S Ocean Dr #4 Jensen Beach, FL | 2.0 | 2.0 | 1411 | $3,500 | $2.48 | 25d | 1 | 0.97mi |
| 9403 S Ocean Dr Unit 3D Jensen Beach, FL | 2.0 | 2.0 | 1328 | $1,800 | $1.36 | 25d | 1 | 0.98mi |
| 9960 S Ocean Dr #502 Jensen Beach, FL | 2.0 | 2.0 | 1434 | $3,000 | $2.09 | 25d | 1 | 0.99mi |
| 9490 S Ocean Dr Unit 113 A Jensen Beach, FL | 2.0 | 2.0 | 1053 | $4,200 | $3.99 | 25d | 1 | 1.01mi |
| 9400 S Ocean Dr Unit 1003B Jensen Beach, FL | 2.0 | 2.0 | 1053 | $2,700 | $2.56 | 25d | 1 | 1.02mi |
| 10000 S Ocean Dr #206 Jensen Beach, FL | 2.0 | 2.0 | 1264 | $5,100 | $4.03 | 25d | 1 | 1.03mi |
| 9400 S Ocean Dr #202 Jensen Beach, FL | 2.0 | 2.0 | 1053 | $5,600 | $5.32 | 25d | 1 | 1.03mi |
| 9400 S Ocean Dr #307 Jensen Beach, FL | 2.0 | 2.0 | 1053 | $2,500 | $2.37 | 25d | 1 | 1.03mi |
| 9400 S Ocean Dr #707 Jensen Beach, FL | 2.0 | 2.0 | 1053 | $3,000 | $2.85 | 25d | 1 | 1.03mi |
| 9400 S Ocean Dr Unit 608B Jensen Beach, FL | 2.0 | 2.0 | 1112 | $6,500 | $5.85 | 25d | 1 | 1.03mi |
| 9400 S Ocean Dr Unit 706B Jensen Beach, FL | 2.0 | 2.0 | 1053 | $3,500 | $3.32 | 25d | 1 | 1.03mi |
| 9400 S Ocean Dr Unit 604B Jensen Beach, FL | 2.0 | 2.0 | 1053 | $5,400 | $5.13 | 25d | 1 | 1.04mi |
| 9400 S Ocean Dr Unit 504B Jensen Beach, FL | 2.0 | 2.0 | 1053 | $2,400 | $2.28 | 25d | 1 | 1.04mi |
| 10044 S Ocean Dr Jensen Beach, FL | 2.0–3.0 | 2.0 | 1305 | $2,500 | $1.91 | 25d | 6 | 1.08mi |
| 10044 S Ocean Dr Jensen Beach, FL | 2.0–3.0 | 2.0 | 1305 | $2,500 | $1.91 | 15d | 7 | 1.08mi |
| 10102 S Ocean Dr #107 Jensen Beach, FL | 2.0 | 2.0 | 1053 | $2,200 | $2.09 | 25d | 1 | 1.16mi |
| 10102 S Ocean Dr Unit 401A Jensen Beach, FL | 2.0 | 2.0 | 1113 | $2,990 | $2.69 | 25d | 1 | 1.17mi |
| 10102 S Ocean Dr Unit 703 Jensen Beach, FL | 2.0 | 2.0 | 1053 | $3,800 | $3.61 | 25d | 1 | 1.17mi |
| 10102 S Ocean Dr Unit 307A Jensen Beach, FL | 2.0 | 2.0 | 1053 | $2,600 | $2.47 | 25d | 1 | 1.17mi |
HOA detail condo
- Monthly dues
- $420 · $5,040/yr
- Likely covers
- pool
- Assessments
- None detected in remarks — confirm with the listing agent.
Listing history 29 events
-
2026-06-21days on market $379,900 Active 416 DOM
-
2026-06-18days on market $379,900 Active 413 DOM
-
2026-06-17days on market $379,900 Active 412 DOM
-
2026-06-16days on market $379,900 Active 411 DOM
-
2026-06-15days on market $379,900 Active 410 DOM
-
2026-06-14days on market $379,900 Active 408 DOM
-
2026-06-13days on market $379,900 Active 407 DOM
-
2026-06-10days on market $379,900 Active 405 DOM
-
2026-06-09days on market $379,900 Active 404 DOM
-
2026-06-08days on market $379,900 Active 403 DOM
-
2026-06-07days on market $379,900 Active 402 DOM
-
2026-06-05days on market $379,900 Active 399 DOM
-
2026-06-03days on market $379,900 Active 398 DOM
-
2026-06-02days on market $379,900 Active 397 DOM
-
2026-06-01days on market $379,900 Active 396 DOM
-
2026-05-31days on market $379,900 Active 395 DOM
-
2026-05-30days on market $379,900 Active 394 DOM
-
2026-04-16status Active
-
2026-04-12status Pending
-
2026-03-23price $379,900
-
2026-01-07status Active
-
2026-01-07status Pending
-
2025-11-16price $389,900
-
2025-08-24price $399,000
-
2025-07-18price $405,000
-
2025-04-28$419,900 Active
-
2024-08-16historical
-
2024-05-03price $435,000
-
2024-03-04$449,900 Active
ⓘ Source: listings_history table (triggers on properties + properties_extension) + one-shot
backfill from property_details.listing_events for pre-trigger history.
Tax reassessment forecast FL · Resets to sale price
- Current annual tax
- $6,898 · $575/mo
- Projected year-2 tax
- $6,898 · $575/mo
- Expected delta
- $0/yr ($0/mo · 0.0%)
ⓘ Screening estimate from a state-policy table — verify with the county assessor before closing.
Climate risk First Street
- Flood 9/10 Extreme FEMA zone X (shaded) · 99% chance over 30 yrs
- Wildfire 1/10 Low
- Heat 10/10 Extreme 7 d/yr ≥106°F today · 23 d/yr by 30 yrs out
- Wind 10/10 Extreme 99% chance of damaging wind over 30 yrs
- Air quality 2/10 Low 1 unhealthy d/yr today · 2 by 30 yrs out
Nearby sold comps map
Loading sold comps map…
Walkable amenities ~0.75 mi
Loading nearby amenities…
Taxation est. · year 1
- Rental income
- $44,019
- − Mortgage interest
- −$21,280
- − Property taxes
- −$6,898
- − Insurance
- −$2,697
- − Repairs & maintenance
- −$3,522
- − Management
- −$3,522
- − HOA
- −$5,040
- − Depreciation
- −$11,052
- Taxable loss
- −$9,990
- Est. tax savings @ 24.0%
- +$2,398
- After-tax cash flow
- $-1,369/yr
For passive investors: Depreciation is non-cash, so a rental often shows a tax loss while cash-flowing — sheltering income. Rental losses are passive: they offset passive income freely, and up to $25,000/yr can offset ordinary (W-2) income if you actively participate and your MAGI is under $100k (phasing out to $0 by $150k); unused losses carry forward. On sale, claimed depreciation is recaptured at up to 25%, and gains may owe capital-gains tax (a 1031 exchange can defer both). Figures are a year-1 estimate at your 24.0% rate — not tax advice; consult a CPA.
Schools (NCES district)
- District
- St. Lucie
- NCES district ID
- 1201770
- Math proficiency
- 40% ▼ -11.00%
- Reading proficiency
- 48% ▼ -4.00%
- Median HH income
- $44,737
- Composite
- 37.28/100
- National rank
- #4449
- State rank
- #51 of 73 in FL
Livability — Hutchinson Island South
- Score
- 61/100
- State rank
- #783
- US rank
- #17768
Category grades
Schools grade is shown separately in the Schools card above.
Census & demographics
- Census place
- Hutchinson Island South, FL
- County
- Martin County · 165,223 people
- Metro
- Port St. Lucie, FL
- Population (ZIP)
- 23,462
- Household income
- $70,403
- Rent vs Own
- Severe rent burden
- 946.0
Population outlook (St. Lucie County) Hauer SSP2
- Today (2025)
- 338,016 people
- By 2030
- 355,687 · +5.2%
- By 2040
- 385,521 · +14.1%
- By 2050
- 406,106 · +20.1%
- By 2075
- 441,054 · +30.5%
- By 2100
- 436,885 · +29.2%
Race, ethnicity, and origin ACS 2023
- Neighborhood character
- Predominantly White (85%)
- Race & ethnicity
- White 85% Hispanic / Latino 7% Two or more races 6% Asian 2% Black 2%
- Hispanic origin (detail)
- Mexican 1% Puerto Rican 2% Cuban 1%
- Common ancestry
- Romanian 4% Slovak 3% Lithuanian 3%
- Foreign-born
- 10% · Canada, Jamaica
- Languages at home
- 90% English-only · Spanish 5% Other Indo-European 2% Tagalog/Filipino 1%
Political lean MEDSL · St. Lucie
- 2024 margin
- Lean R (+9.1) · D 45.1% · R 54.2%
- 2008→2024 swing
- -21.2pp toward R · 2008: 12.1pp · 2024: -9.1pp
- All cycles
- 2024: R+9.1 2020: R+1.6 2016: R+2.5 2012: D+7.9 2008: D+12.1
Not yet ingested
- Civics
- —
Market trends
- HPI YoY
- ▼ -319.66%
- Current HPI
- 340.0172
- Rent YoY
- ▲ 1.00%
- Metro
- Port St. Lucie, FL
- State GDP YoY
- ▲ 3.28%
- F500 in state
- 36
Industry mix (Fortune 500 HQ in FL)
| Industry | F500 HQs | Revenue |
|---|---|---|
| Industrial Technology | 2 | $29B |
|
||
| Insurance | 2 | $17B |
|
||
| Retail | 1 | $60B |
|
||
| Technology Distribution | 1 | $58B |
|
||
| Homebuilding | 1 | $35B |
|
||
| Technology Manufacturing | 1 | $35B |
|
||
Price history
-15.6% since first listed12 events — show timeline
- 2026-04-16 Relisted — MCRTC
- 2026-04-12 Pending — MCRTC
- 2026-03-23 Price Changed $379,900 MCRTC
- 2026-01-07 Relisted — MCRTC
- 2026-01-07 Pending — MCRTC
- 2025-11-16 Price Changed $389,900 MCRTC
- 2025-08-24 Price Changed $399,000 MCRTC
- 2025-07-18 Price Changed $405,000 MCRTC
- 2025-04-28 Listed $419,900 MCRTC
- 2024-08-16 Listing Removed — MCRTC
- 2024-05-03 Price Changed $435,000 MCRTC
- 2024-03-04 Listed $449,900 MCRTC
Property tax history
+14.1%/yrLatest (2025): $6,898 · -5.0% YoY. Source: county tax records.
Cash-flow waterfall
monthlySold comps — $/sqft
last 12 mo · ≤1 miLoading sold comps…