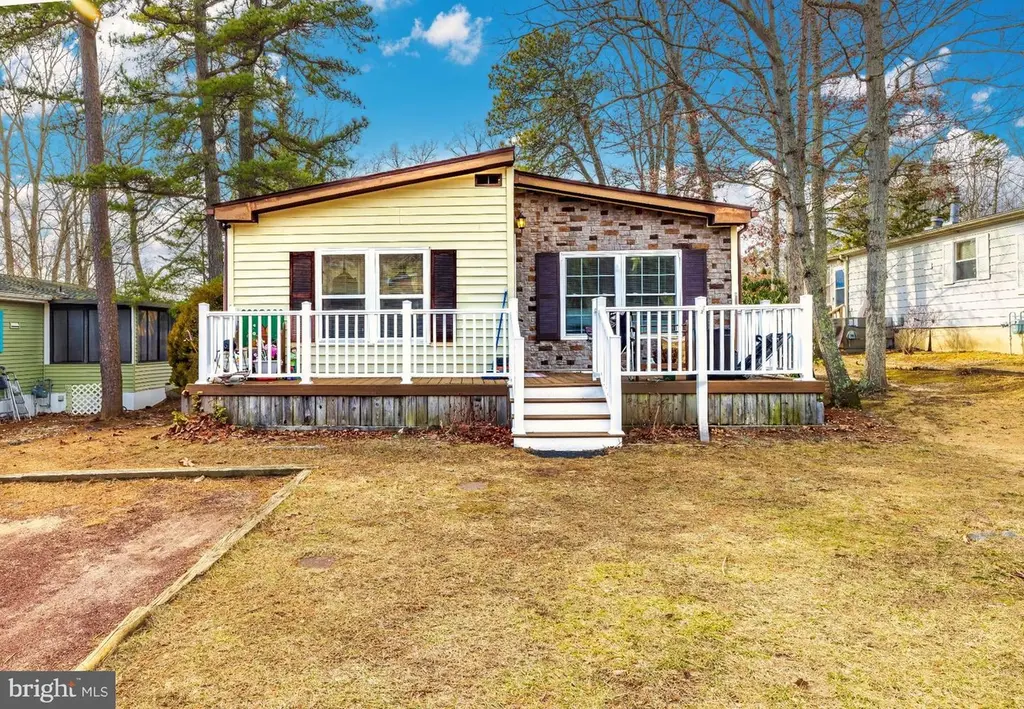
16 Holly Ct · Estell Manor, NJ
Flood risk No data
- FEMA flood zone
- —
- Chance of flooding over 30 yrs
- —
- Est. flood insurance / yr
- —
Fire risk No data
- Est. fire insurance / yr
- —
Heat risk No data
- Hot days now (above threshold)
- —
- Hot days in 30 yrs
- —
Wind risk No data
- Chance of severe wind over 30 yrs
- —
Air-quality risk No data
- Unhealthy air days now
- —
- Unhealthy air days in 30 yrs
- —
Risk factors via First Street. Map © Google.
Why this score? — see what drove the A grade
The composite is a weighted blend of 9 inputs, each scored 0–100. Each bar is that input's sub-score; the figure is the points it added to the 100-point composite (weight × sub-score).
- Cash flow +30.0/30.0
- ARV discount +15.0/15.0
- 1% rule +10.0/10.0
- DSCR +10.0/10.0
- Appreciation +10.0/10.0
- Schools +4.7/10.0
- Livability +3.2/5.0
- Rent growth +2.5/5.0
- Condition / age +2.5/5.0
$122,500
🖨 Deal sheet 📄 Offer letter ✓ Due diligence
Listing remarks MLS
Welcome to this charming 2-bedroom, 2-bathroom home in the highly sought-after neighborhood of The Oaks of Weymouth. With its inviting curb appeal and charming design, this property offers the perfect blend of comfort and style. The spacious master suite is a true highlight, featuring large windows that flood the room with natural light, a generous walk-in closet, and a luxurious en-suite bathroom with a soaking tub and separate shower. It’s your own private retreat. The open-concept living and dining areas create a seamless flow for entertaining, while the well-appointed kitchen offers ample cabinet space and a cozy breakfast nook. The second bedroom is perfect for guests or a home office, with easy access to the second full bath. The Oaks of Weymouth is a beautiful, tranquil community with tree-lined streets and friendly neighbors. Enjoy all the community center has to offer including swimming pool, tennis, pickleball, cards, billiards, and even line dancing in the community clubhouse! Don’t miss out on this gem! Schedule your showing today and make this home yours
Key facts
- Master suite
- Walk-in closet
- Soaking tub
Tags
Neighborhood map
What this means for you Summary
Snapshot
- This is a 2-bed/2.0-bath manufactured listed at $122k.
Deal economics
- At list price, monthly cash flow is $1k ($12k/yr) — positive.
- The deal already cash-flows at list — no discount required.
- Meets the 1% rule at list price ($2k rent vs $122k).
- Recommended offer: $108k (12.0% below list) — sets the bar for market timing.
- Cap rate 16.1% vs local median 6.1% in Estell Manor — top-decile yield for the area; either an underpriced asset or a hidden risk that comps aren't pricing in. Stress-test before assuming the spread holds.
Location & tenants
- Location reads 64/100 on livability (#414 in NJ) — a middle-class / working-renter tenant base. Strengths: crime A+, employment A+, housing A+; Watch: schools C-, amenities F, commute F.
- Weymouth Township School District (rural): math 50% / reading 55% proficiency, ranked #351 of 612 in NJ (top 57%) — acceptable for families but not a draw, mixed tenant base, ~2y average lease.
- Market conditions: 240 active listings in the ZIP; solid renter incomes; 672 units permitted in Atlantic County in 2024 (258 in 5+ unit buildings).
- This rent runs 36% of the median local income ($77k/yr) — at the standard rent-burdened threshold; future hikes will face affordability resistance.
Forward outlook
- In year one you build about $13k of equity ($847 loan paydown + $12k appreciation (10.0% local appreciation)).
- Atlantic County population projected at -12% by 2050 — secular population decline; favor cash flow + early exit over multi-decade hold.
- At projected returns (10.0% appreciation + 3.0% rent growth), your $34k cash investment doubles in ~2 years — after that, you're playing with house money.
- By year 3, paydown + projected appreciation supports a ~$33k cash-out refi (75% LTV) — recoverable capital for the next deal without selling this one.
Negotiation context
- It's been on market 139 days — a 12% lower offer ($108k) is reasonable based on typical stale-listing flexibility.
- 7 sale attempts since 26y ago with the ask held roughly flat each time — persistent listings suggest the price (not the market) is what's stuck; bring a comps-based counter.
- Current owner paid $87k; 41% above their basis — modest negotiation headroom, anchor on the comps not their cost.
Questions for the listing agent
- It's been on market 139 days. Have you received any prior offers? Is the seller open to a 12% concession, seller financing, or rate buy-down credit?
- Why hasn't it sold? Are there any deal-killer items the seller is aware of (foundation, flood, title, zoning, code violations)?
- Is there a deadline driving the sale (1031 exchange, divorce, estate, relocation)? That informs how much negotiation room exists.
- What's the average days-on-market for RENTAL listings here right now (not sales)? A rising rental-DOM trend means longer vacancies and softer asking-rent achievability than the comps imply.
- What's the recent tenant-quality profile in this submarket — average credit score on applications, eviction rate, late-payment / NSF rate, and stable-employment percentage? A property-management company in the area should have these aggregated.
- How much new for-sale + rental construction is in the pipeline within 1–3 miles? Heavy new supply typically softens prices + rents 12–24 months out; constrained supply supports both.
Investment metrics
- 1% rule
- 1.91% ✓
- Cap rate
- 16.14%
- Cash-on-cash
- 35.16%
- DSCR
- 2.56
- GRM
- 4.4
CMA / ARV
- ARV (median comp)
- $199,659
- List price
- $122,500
- Delta
- -38.65%
- Verdict
- UNDERPRICED
- Comps
- 20 within 1.0 mi
Show comp detail 2 sales within ~0.75 mi
| Address | Dist | Beds/Ba | Sqft | Sold | Price | $/sf | Match |
|---|---|---|---|---|---|---|---|
| 2 Cedar Ct | 0.05mi | 2/2.0 | 1,350 (+4%) | 12mo | $199,000 | $147 | 81 |
| 8 Walnut Ct | 0.36mi | 3/2.0 (+1) | 1,200 (-8%) | 18mo | $212,000 | $177 | 50 |
Match score weights: distance 35% · size 25% · config 20% · recency 20%. Top-matched comps best support the ARV.
Projected returns pro-forma
10.0% appreciation · 3.0% rent growth · sell at horizon
- IRR
- 51.3%
- Equity multiple
- 4.81×
- Total profit
- $130,756
- Equity at exit
- $110,358
- IRR
- 44.9%
- Equity multiple
- 10.76×
- Total profit
- $334,793
- Equity at exit
- $237,991
Cash invested: $34,300 (down + closing). Projections, not guarantees.
Landlord ↔ Tenant lean methodology
- Overall (STATE)
- 21 Tenant-Leaning
- State New Jersey
- 21 Tenant-Leaning · D+6
- County
- — inherits STATE
- City
- — inherits STATE
ZIP-level market 08330
- Home prices YoY
- 3.9%
- Active inventory
- 240
- Price-to-rent
- 4.4×
Monthly cashflow live
- Estimated rent
- $2,344 medium interval (Pro) →
- Mortgage (P&I)
- −$642
- Tax est. 1.5%
- −$153 /mo · $1,838/yr
- Insurance
- −$51
- HOA
- −$0
- Vacancy / Maint / Mgmt
- −$492
- Net cashflow
- $1,005
Break-even live
UW: 25.0% down · 7.5% · 30yr · 1.5% tax · 5.0% vac · 8.0% maint · 8.0% mgmt
Financing live
Cash to close
- Down payment
- $30,625
- Closing costs
- $3,675
- Reserves months
- —
- Total cash needed
- —
Loan-product check · same deal, 3 products live
Conventional
25% down · 7.5% · 30yr
- Down + closing
- —
- Monthly P&I
- —
- Monthly cashflow
- —
- DSCR
- —
- Eligible?
- —
Personal DTI + credit; lowest rate.
DSCR
20% down · 8.5% · 30yr
- Down + closing
- —
- Monthly P&I
- —
- Monthly cashflow
- —
- DSCR
- —
- Eligible?
- —
No personal income docs; deal must DSCR.
Hard money
10% down · 12.0% · 12mo
- Down + closing
- —
- Monthly P&I
- —
- Monthly cashflow
- —
- DSCR
- —
- Eligible?
- —
Short-term bridge; refi at stabilization.
Listing history 26 events
-
2026-06-09status $122,500 Pending 139 DOM
-
2026-06-08days on market $122,500 Active 139 DOM
-
2026-06-07days on market $122,500 Active 138 DOM
-
2026-06-05days on market $122,500 Active 135 DOM
-
2026-06-03days on market $122,500 Active 134 DOM
-
2026-06-02days on market $122,500 Active 133 DOM
-
2026-06-01pricedays on market $122,500 Active 132 DOM
-
2026-05-31days on market $110,000 Active 131 DOM
-
2026-05-30days on market $110,000 Active 130 DOM
-
2026-01-20$122,500 Active 1095-char remark
Show marketing remark (1095 chars)
Welcome to this charming 2-bedroom, 2-bathroom home in the highly sought-after neighborhood of The Oaks of Weymouth. With its inviting curb appeal and charming design, this property offers the perfect blend of comfort and style. The spacious master suite is a true highlight, featuring large windows that flood the room with natural light, a generous walk-in closet, and a luxurious en-suite bathroom with a soaking tub and separate shower. It’s your own private retreat. The open-concept living and dining areas create a seamless flow for entertaining, while the well-appointed kitchen offers ample cabinet space and a cozy breakfast nook. The second bedroom is perfect for guests or a home office, with easy access to the second full bath. The Oaks of Weymouth is a beautiful, tranquil community with tree-lined streets and friendly neighbors. Enjoy all the community center has to offer including swimming pool, tennis, pickleball, cards, billiards, and even line dancing in the community clubhouse! Don’t miss out on this gem! Schedule your showing today and make this home yours
-
2026-01-01$122,500 Active 1096-char remark
Show marketing remark (1096 chars)
Welcome to this charming 2-bedroom, 2-bathroom home in the highly sought-after neighborhood of The Oaks of Weymouth. With its inviting curb appeal and charming design, this property offers the perfect blend of comfort and style. The spacious master suite is a true highlight, featuring large windows that flood the room with natural light, a generous walk-in closet, and a luxurious en-suite bathroom with a soaking tub and separate shower. It’s your own private retreat. The open-concept living and dining areas create a seamless flow for entertaining, while the well-appointed kitchen offers ample cabinet space and a cozy breakfast nook. The second bedroom is perfect for guests or a home office, with easy access to the second full bath. The Oaks of Weymouth is a beautiful, tranquil community with tree-lined streets and friendly neighbors. Enjoy all the community center has to offer including swimming pool, tennis, pickleball, cards, billiards, and even line dancing in the community clubhouse! Don’t miss out on this gem! Schedule your showing today and make this home yours.
-
2025-12-31historical
-
2025-11-27price $122,900
-
2025-10-21price $129,500
-
2025-09-30status Active
-
2025-05-20historical Active Under Contract
-
2025-02-23$135,000 Active
-
2023-06-07soldstatus $87,000 Sold
-
2023-04-26historical Under Contract
-
2023-02-27$95,000 Active
-
2003-12-10soldstatus $70,000
-
2003-11-10historical
-
2003-08-11$79,000
-
2000-09-27soldstatus $64,000
-
2000-08-04historical
-
2000-05-23$64,000
ⓘ Source: listings_history table (triggers on properties + properties_extension) + one-shot
backfill from property_details.listing_events for pre-trigger history.
Nearby sold comps map
Loading sold comps map…
Walkable amenities ~0.75 mi
Loading nearby amenities…
Taxation est. · year 1
- Rental income
- $28,124
- − Mortgage interest
- −$6,862
- − Property taxes
- −$1,838
- − Insurance
- −$612
- − Repairs & maintenance
- −$2,250
- − Management
- −$2,250
- − Depreciation
- −$3,564
- Taxable income
- $10,749
- Est. tax owed @ 24.0%
- −$2,580
- After-tax cash flow
- $9,479/yr
For passive investors: Depreciation is non-cash, so a rental often shows a tax loss while cash-flowing — sheltering income. Rental losses are passive: they offset passive income freely, and up to $25,000/yr can offset ordinary (W-2) income if you actively participate and your MAGI is under $100k (phasing out to $0 by $150k); unused losses carry forward. On sale, claimed depreciation is recaptured at up to 25%, and gains may owe capital-gains tax (a 1031 exchange can defer both). Figures are a year-1 estimate at your 24.0% rate — not tax advice; consult a CPA.
Schools (NCES district)
- District
- Weymouth Township School District
- NCES district ID
- 3417850
- Math proficiency
- 50% ▲ 5.00%
- Reading proficiency
- 55% ▲ 10.00%
- Median HH income
- $54,908
- Composite
- 47.23/100
- National rank
- #5081
- State rank
- #351 of 612 in NJ
Livability — Estell Manor
- Score
- 64/100
- State rank
- #414
- US rank
- #14535
Category grades
Schools grade is shown separately in the Schools card above.
Census & demographics
- County
- Atlantic County · 143,611 people
- City population
- 1,269
- Metro
- Atlantic City-Hammonton, NJ
- Population (ZIP)
- 29,972
- Household income
- $77,167
- Rent vs Own
- Severe rent burden
- 1003.0
Population outlook (Atlantic County) Hauer SSP2
- Today (2025)
- 268,948 people
- By 2030
- 264,497 · -1.7%
- By 2040
- 252,261 · -6.2%
- By 2050
- 237,846 · -11.6%
- By 2075
- 210,650 · -21.7%
- By 2100
- 180,234 · -33.0%
Race, ethnicity, and origin ACS 2023
- Neighborhood character
- Diverse neighborhood (Simpson 0.62)
- Race & ethnicity
- White 58% Hispanic / Latino 16% Black 14% Two or more races 13% Asian 4%
- Hispanic origin (detail)
- Puerto Rican 7% Dominican 4%
- Common ancestry
- Romanian 3% Italian 2% Lithuanian 1%
- Foreign-born
- 9% · Canada, Vietnam, Guatemala
- Languages at home
- 84% English-only · Spanish 10% Tagalog/Filipino 1% Other Indo-European 1%
Political lean MEDSL · Atlantic
- 2024 margin
- Toss-up / Even · D 47.7% · R 50.7% · Other 1.6%
- 2008→2024 swing
- -18.1pp toward R · 2008: 15.1pp · 2024: -3.0pp
- All cycles
- 2024: R+3.0 2020: D+6.7 2016: D+6.2 2012: D+17.2 2008: D+15.1
Not yet ingested
- Civics
- —
Market trends
- HPI YoY
- ▲ 11.58%
- Current HPI
- 308.5148
- Rent YoY
- —
- Metro
- Atlantic City-Hammonton, NJ
- State GDP YoY
- ▲ 2.05%
- F500 in state
- 34
Industry mix (Fortune 500 HQ in NJ)
| Industry | F500 HQs | Revenue |
|---|---|---|
| Consumer Goods | 3 | $31B |
|
||
| Pharmaceuticals | 2 | $153B |
|
||
| Technology | 2 | $21B |
|
||
| Insurance | 2 | $20B |
|
||
| Healthcare | 2 | $19B |
|
||
| Financial Services | 1 | $70B |
|
||
Price history
+91.4% since first listed17 events — show timeline
- 2026-01-20 Listed $122,500 BRIGHT MLS
- 2026-01-01 Listed $122,500 SJSRMLS
- 2025-12-31 Listing Removed — BRIGHT MLS
- 2025-11-27 Price Changed $122,900 BRIGHT MLS
- 2025-10-21 Price Changed $129,500 BRIGHT MLS
- 2025-09-30 Relisted — BRIGHT MLS
- 2025-05-20 Contingent — BRIGHT MLS
- 2025-02-23 Listed $135,000 BRIGHT MLS
- 2023-06-07 Sold (MLS) $87,000 SJSRMLS
- 2023-04-26 Contingent — SJSRMLS
- 2023-02-27 Listed $95,000 SJSRMLS
- 2003-12-10 Sold (MLS) $70,000 SJSRMLS
- 2003-11-10 Listing Removed — SJSRMLS
- 2003-08-11 Listed $79,000 SJSRMLS
- 2000-09-27 Sold (MLS) $64,000 SJSRMLS
- 2000-08-04 Listing Removed — SJSRMLS
- 2000-05-23 Listed $64,000 SJSRMLS
Cash-flow waterfall
monthlySold comps — $/sqft
last 12 mo · ≤1 miLoading sold comps…